Le Bitcoin Cash échoue à 478 $ – Mais les haussiers du BCH peuvent-ils défendre 406 $ ensuite ?

ambcryptoPublished on 2026-04-09Last updated on 2026-04-09

Abstract

Bitcoin Cash (BCH) a affiché une faible performance hebdomadaire (-1%) et mensuelle (-1,25%), nettement inférieure à celle de Bitcoin. Son cours évolue dans une fourchette entre 272$ et 685$ depuis février 2024. Le niveau de support à 478$, qui servait auparavant de soutien, est désormais une résistance, confirmant la domination des vendeurs. La structure baissière est visible sur les graphiques, avec une rupture de la fourchette de trading à court terme (448$-484$) début avril. Les objectifs de prix baissiers suivants sont 406$ et 385$. Bien qu'un rebond vers 455$-465$ soit possible, la tendance globale reste baissière. Les investisseurs à long terme pourraient envisager d'acheter uniquement si le prix descend en dessous de 300$.

Le Bitcoin Cash [BCH] n'a baissé que de moins de 1 % au cours de la semaine écoulée et n'a perdu que 1,25 % sur le mois dernier. Il a sous-performé par rapport au Bitcoin [BTC], qui a progressé de 7,5 % en une semaine et n'a augmenté que de un peu plus de 1 % en 30 jours.

Cette faiblesse relative du Bitcoin Cash indiquait un manque de conviction du marché, mais en surface, cela semble anodin.

Cependant, son action sur les prix en avril a été révélatrice. Dans la bataille entre les haussiers et les baissiers, un camp était clairement gagnant.

Alerte spoiler, ce ne sont pas les haussiers du Bitcoin Cash

Source : BCH/USDT sur TradingView

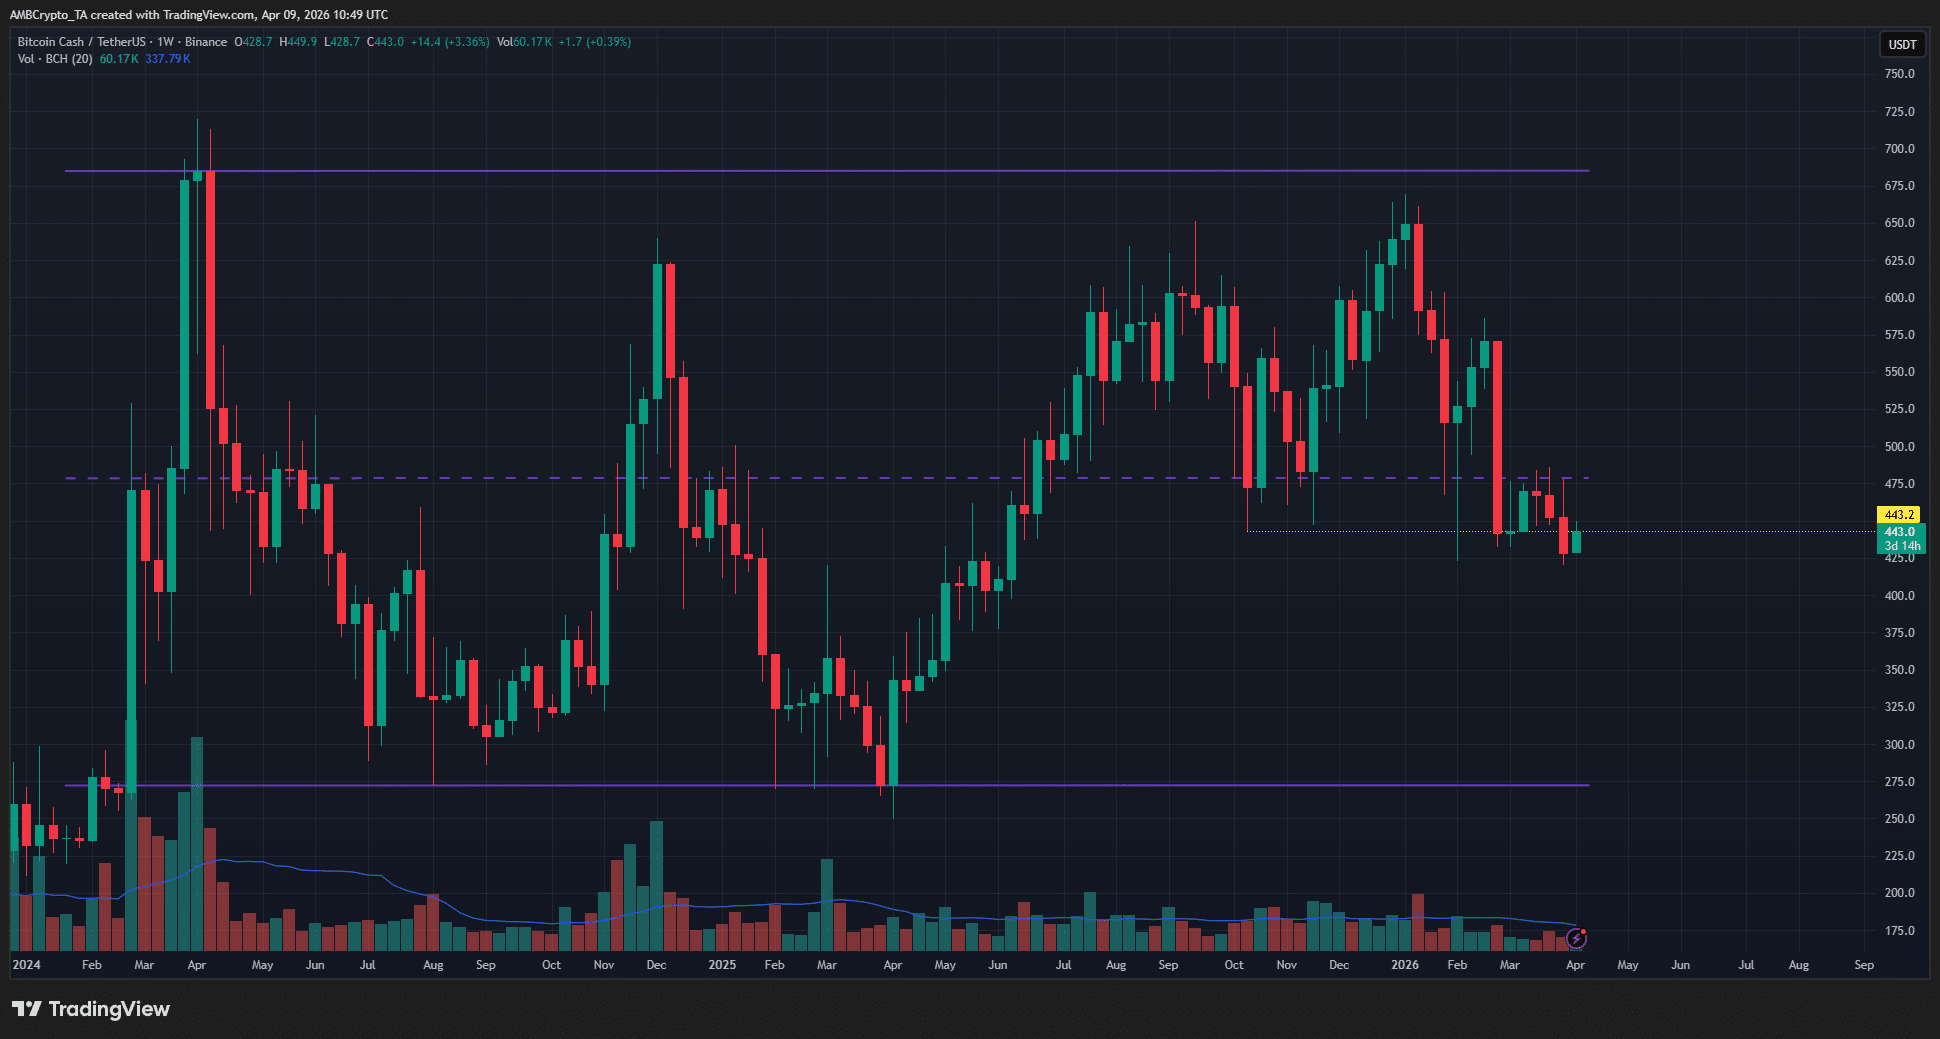
Depuis février 2024, le Bitcoin Cash évolue dans une fourchette (violette) allant de 272 $ à 685 $. L'altcoin a tenté, sans succès, d'atteindre les sommets de cette fourchette à trois reprises depuis décembre 2024.

En 2025, le support médian à 478 $ a agi plusieurs fois comme un support. Au cours du mois dernier, il a été testé comme une résistance. L'incapacité à dépasser ce niveau lors du rallye crypto de la mi-mars a confirmé que les baissiers contrôlaient le marché.

Le plus bas de 443 $ du krach d'octobre était en train d'être retesté comme résistance au moment de la rédaction. D'autres pertes de prix devraient probablement survenir dans les prochains mois.

Les investisseurs à long terme peuvent attendre une chute en dessous de 300 $ avant d'envisager d'acheter du BCH.

Appel à l'action des traders – Est-il temps de vendre maintenant ?

Source : BCH/USDT sur TradingView

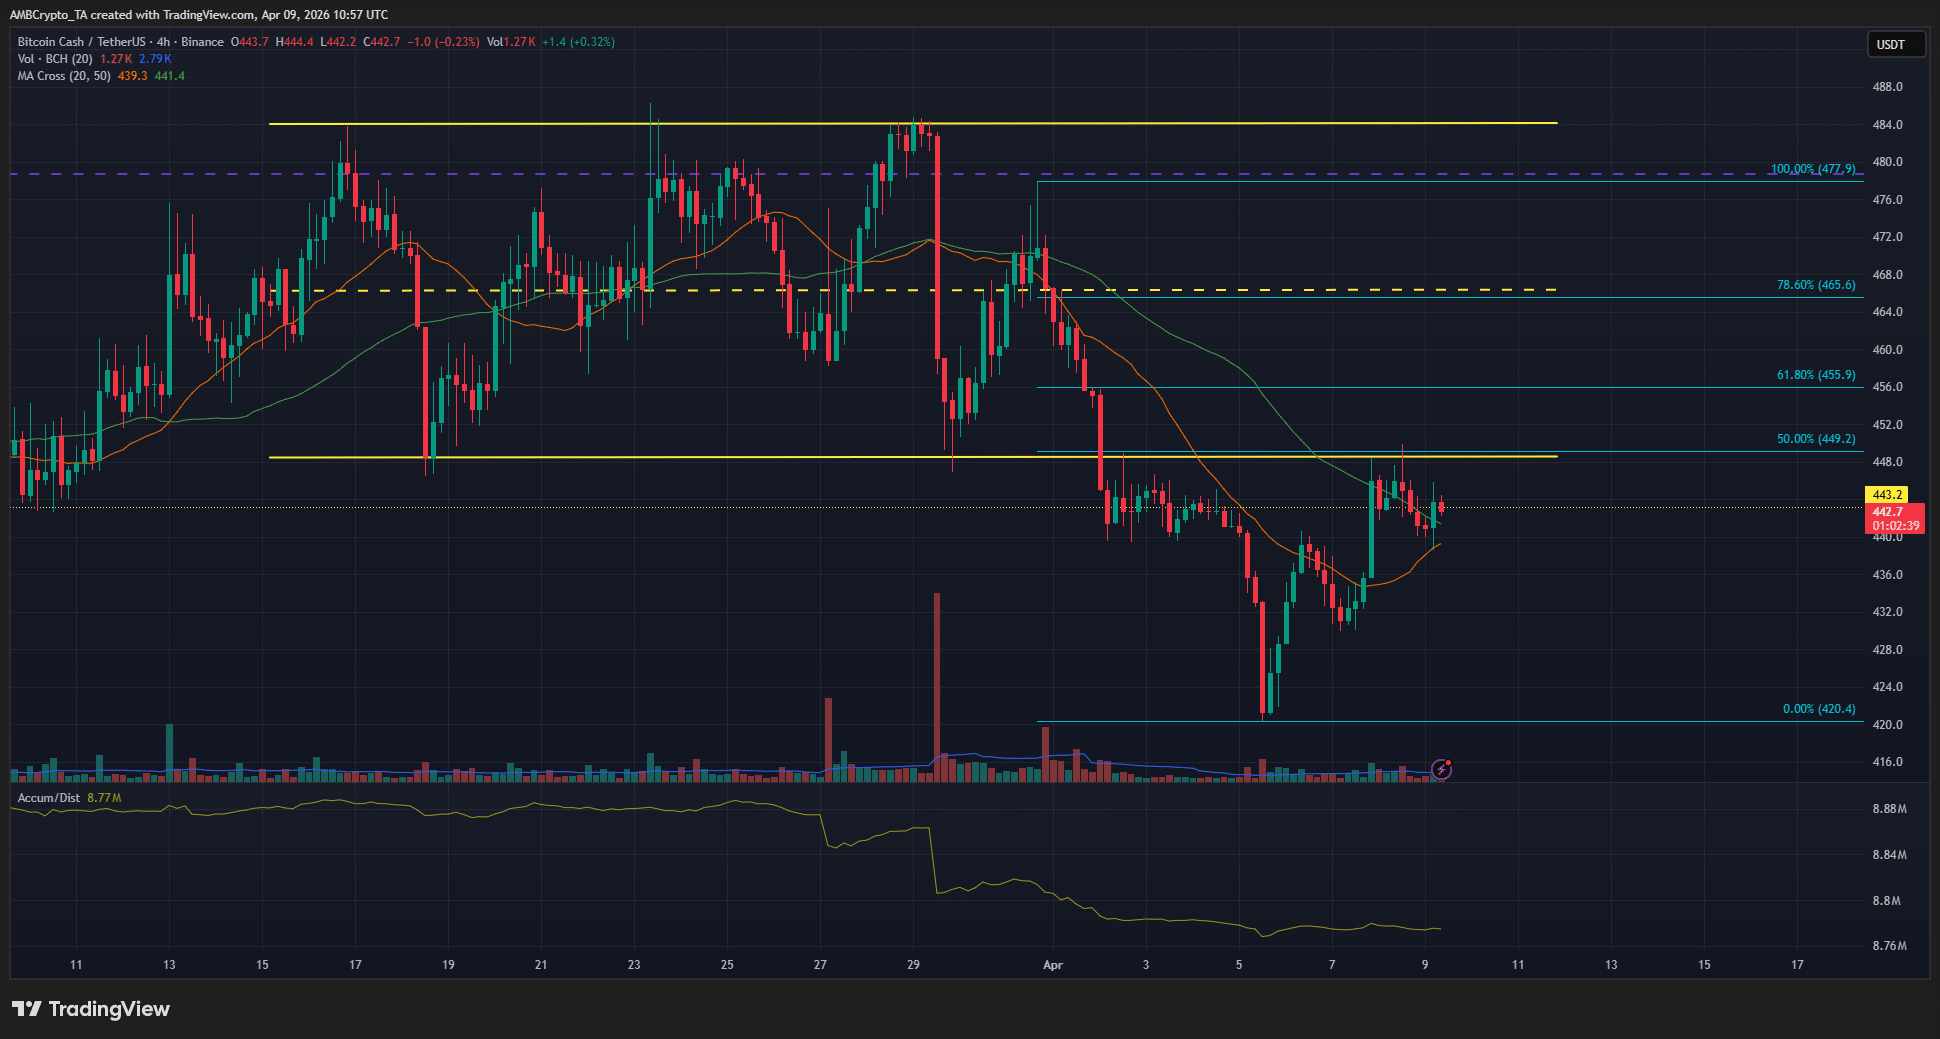
Le graphique en 4 heures montrait une structure de swing baissière. La fourchette à court terme entre 448 $ et 484 $ a été franchie début avril. Les plus bas de la fourchette étaient retestés comme résistance au moment de la rédaction.

De plus, en utilisant le mouvement de swing H4 à la baisse, un ensemble de niveaux de retracement de Fibonacci (cyan) a été tracé.

Le niveau des 50 % à 449,2 $ a été testé, et le prix commençait à baisser à partir de là.

Il est possible que le rebond actuel puisse s'étendre vers 455 $ - 465 $.

Cependant, la direction de la tendance était baissière, et les traders de Bitcoin Cash doivent se préparer à une baisse des prix dans les prochaines semaines.

Les niveaux d'extension de Fibonacci ont montré que 406 $ et 385 $ étaient les prochains objectifs de prix baissiers.


Résumé final

  • Les formations de fourchettes à court et long terme ont montré que les niveaux clés ont été franchis et ont averti d'un mouvement de prix baissier supplémentaire.
  • Les prochains objectifs de prix du BCH sont 306 $ et 385 $, bien qu'un rebond vers 455 $ - 465 $ était une possibilité avant une telle chute.

Related Questions

QQuelle a été la performance de Bitcoin Cash (BCH) par rapport à Bitcoin (BTC) sur une semaine et un mois ?

ASur une semaine, Bitcoin Cash a perdu moins de 1 %, tandis que Bitcoin a gagné 7,5 %. Sur un mois, BCH a perdu 1,25 % et BTC a progressé d'un peu plus de 1 %.

QQuelle est la fourchette de prix dans laquelle le Bitcoin Cash s'est négocié depuis février 2024 ?

ADepuis février 2024, Bitcoin Cash s'est négocié dans une fourchette allant de 272 $ à 685 $.

QQuel niveau de soutien à moyen terme a été testé comme une résistance au cours du dernier mois ?

ALe soutien à moyen terme à 478 $, qui a agi comme un support à plusieurs reprises en 2025, a été testé comme un niveau de résistance au cours du dernier mois.

QQuels sont les prochains objectifs de prix baissiers pour le BCH selon les niveaux d'extension de Fibonacci ?

ASelon les niveaux d'extension de Fibonacci, les prochains objectifs de prix baissiers pour le BCH sont 406 $ et 385 $.

QQuelle recommandation est faite aux investisseurs à long terme concernant l'achat de BCH ?

ALa recommandation faite aux investisseurs à long terme est d'attendre une baisse en dessous de 300 $ avant d'envisager d'acheter du BCH.

Related Reads

Behind HYPE's Repeated Record Highs, the 'Minions' in the Ecosystem Can't Keep Up

While HYPE, the native token of the Hyperliquid ecosystem, surges to new all-time highs above $76 and attracts significant institutional ETF inflows, a starkly different reality unfolds within its HyperEVM application layer. Multiple core DeFi protocols across lending, NFTs, stablecoins, and DEXs have announced shutdowns between May and June. The article argues HYPE functions more like an "application stock" than a traditional ecosystem token. Its value is anchored to the trading fees from Hyperliquid's core perpetual contracts platform (HyperCore), which boasts a diversified revenue stream from crypto, commodities, and indices. Approximately 97% of protocol fees fund buybacks and burns of HYPE. This means HYPE's price is largely decoupled from the health of projects built on HyperEVM. The closures of significant projects like lending protocol HypurrFi (peak TVL >$300M) and NFT marketplace Drip.Trade highlight a structural tension. Hyperliquid's minimalist philosophy offers infrastructure without official grants, liquidity support, or marketing coordination for HyperEVM projects. This forces protocols into a fiercely competitive environment from day one. Furthermore, the success of HyperCore creates a liquidity vacuum, and mechanisms like HIP-3 (allowing direct perpetual market deployment) divert user attention and capital away from application-layer projects. The stronger the core perpetual trading business becomes, the more difficult it is for peripheral "DeFi lego" projects to survive and capture value, despite the flagship token's rising price.

Foresight News9m ago

Behind HYPE's Repeated Record Highs, the 'Minions' in the Ecosystem Can't Keep Up

Foresight News9m ago

Conversation with Arthur Hayes: AI Has Drained Market Liquidity, BTC Will Be Below 100k by Year-End

In this June 2026 podcast interview, BitMEX co-founder Arthur Hayes explains his decision to sell his major crypto holdings (HYPE, NEAR, Worldcoin, Zcash). His rationale is based on a macro view linking oil prices, the Iran conflict, US politics, and an impending AI bubble burst. Hayes argues that high oil prices, driven by the ongoing war, will pressure domestic US inflation. To salvage the Republican Party's chances in the midterm elections, he believes Donald Trump may pivot to a populist, anti-AI stance—advocating for taxes and regulation—which would deflate the AI investment narrative. He sees the AI sector, particularly massive capital expenditure on data centers, as having absorbed nearly all excess market liquidity (around $1.5 trillion in debt issuance since 2025), starving other assets like Bitcoin. He highlights the upcoming SpaceX IPO at a ~$1.8 trillion valuation and 100x price-to-sales ratio as a potential tipping point. If these hyped IPOs underperform, it could shatter market confidence in AI. In such a scenario, all risk assets, including crypto, would fall together as correlations converge to 1 during a broad correction. Hayes has moved his portfolio into Treasuries and energy stocks (like ExxonMobil), predicting Bitcoin will be below $100k by year-end. He sees a potential crypto bull market only after the AI frenzy cools, liquidity stops flowing exclusively into AI, and possibly after a significant market downturn prompts new monetary stimulus.

marsbit20m ago

Conversation with Arthur Hayes: AI Has Drained Market Liquidity, BTC Will Be Below 100k by Year-End

marsbit20m ago

Fed's Internal Doves Flock to Hawkish Stance, Warsh's Debut "Between a Rock and a Hard Place"

U.S. Federal Reserve officials who previously advocated for rate cuts, including Governor Christopher Waller, have recently shifted their stance, with many now not ruling out the possibility of future rate hikes. This sets a challenging stage for new Fed Chair Kevin Warsh's first policy meeting. Appointed by President Trump based on his dovish views, Warsh now faces a committee where the debate has pivoted from "when to cut" to "whether to hike," driven by persistent inflation above 3%, a strong labor market, and supply-side pressures from AI infrastructure demands and geopolitical tensions. Key figures illustrate the shift. Governor Waller, once concerned about employment, now says data has pushed him toward considering rate increases. Even moderate voices like Governor Lisa Cook, while expecting inflation to ease, have indicated readiness to hike if it fails to do so. Long-time hawks such as regional Fed presidents Beth Hammack, Lorie Logan, and Neel Kashkari have grown more vocal, arguing that the real policy rate is effectively falling and that action may soon be needed. The upcoming Fed meeting is expected to keep rates steady but will likely remove the "easing bias" from its statement, signaling a neutral stance between cuts and hikes. The quarterly "dot plot" is anticipated to show most officials projecting no cuts this year, with some potentially indicating hikes. Chair Warsh, a critic of the Fed's reliance on forward guidance like the dot plot, must navigate communicating this pivot using tools he has questioned, all while steering policy in a direction counter to the preferences of the president who appointed him. The consensus suggests the Fed's next move could well be a rate increase.

marsbit1h ago

Fed's Internal Doves Flock to Hawkish Stance, Warsh's Debut "Between a Rock and a Hard Place"

marsbit1h ago

The Trillion-Yuan Market Cap 'Yi Zhong Tian': Who is the True Value King?

The article analyzes the three leading Chinese optical module companies, collectively nicknamed "Yi Zhong Tian": Xinyisheng, Zhongji Innolight, and TFC Optical Communication. It evaluates their "cost-performance" not by current stock price, but through three lenses: PEG ratio (growth vs. valuation), earnings quality, and premium/discount for certainty. Xinyisheng shows the most attractive PEG ratio and high profitability, but its valuation reflects discounts for risks like high customer concentration and reliance on overseas markets. Zhongji Innolight, the most expensive, commands a premium for its market leadership, dominant share in key products like 800G/1.6T modules, and higher earnings certainty, though it faces geopolitical risks. TFC Optical, as an upstream component supplier ("water seller"), has the highest gross margin and bets on the long-term CPO/NPO architecture trend, but trades at a high valuation with more stable, less explosive growth. The core argument is that while these companies dominate module assembly, the true profit pool and technological moat lie upstream in laser and switch chips, currently controlled by U.S. firms like Lumentum and Coherent. The long-term "cost-performance" for these Chinese leaders hinges on whether the domestic industry, exemplified by companies like Yuanjie Technology, can successfully move up the value chain into high-power laser chips. Otherwise, their high growth may remain confined to the lower-margin assembly segment.

marsbit1h ago

The Trillion-Yuan Market Cap 'Yi Zhong Tian': Who is the True Value King?

marsbit1h ago

Trading

Spot
Futures

Hot Articles

How to Buy BCH

Welcome to HTX.com! We've made purchasing Bitcoin Cash (BCH) simple and convenient. Follow our step-by-step guide to embark on your crypto journey.Step 1: Create Your HTX AccountUse your email or phone number to sign up for a free account on HTX. Experience a hassle-free registration journey and unlock all features.Get My AccountStep 2: Go to Buy Crypto and Choose Your Payment MethodCredit/Debit Card: Use your Visa or Mastercard to buy Bitcoin Cash (BCH) instantly.Balance: Use funds from your HTX account balance to trade seamlessly.Third Parties: We've added popular payment methods such as Google Pay and Apple Pay to enhance convenience.P2P: Trade directly with other users on HTX.Over-the-Counter (OTC): We offer tailor-made services and competitive exchange rates for traders.Step 3: Store Your Bitcoin Cash (BCH)After purchasing your Bitcoin Cash (BCH), store it in your HTX account. Alternatively, you can send it elsewhere via blockchain transfer or use it to trade other cryptocurrencies.Step 4: Trade Bitcoin Cash (BCH)Easily trade Bitcoin Cash (BCH) on HTX's spot market. Simply access your account, select your trading pair, execute your trades, and monitor in real-time. We offer a user-friendly experience for both beginners and seasoned traders.

5.8k Total ViewsPublished 2024.03.29Updated 2026.06.02

How to Buy BCH

Discussions

Welcome to the HTX Community. Here, you can stay informed about the latest platform developments and gain access to professional market insights. Users' opinions on the price of BCH (BCH) are presented below.

活动图片