Ethereum Price Remains Constricted, Can It Move Above $1,900?

newsbtcPubblicato 2022-08-05Pubblicato ultima volta 2022-08-05

Introduzione

Ethereum price was trading laterally between the $1,700 and $1,600 price mark. At the moment Ethereum was standing firm on the $1400 support line. Over the last 24 hours, Ethereum...

Ethereum price was trading laterally between the $1,700 and $1,600 price mark. At the moment Ethereum was standing firm on the $1400 support line. Over the last 24 hours, Ethereum price depreciated over 4%.
Bearishness started to prevail on ETH’s chart and technical outlook pointed towards the same direction. For the bulls to resurface Ethereum price needs to climb above the $1,745 price ceiling.
Incase ETH manages to break past the $1,745 price mark and remains above that level, chance of revisiting $2,000 aren’t bleak.

Buyers exited the market as the coin met with a sell-off on its four-hour chart. Ethereum price might trade near the $1,300 price mark in case sellers take over the market.
Over the past week, Ethereum noted positive price action however, the bulls were unable to hold onto the momentum. Ethereum price is also likely to be affected considerably by the Ethereum merge that is due in the month of September.
In this software upgrade, the token will move from a Proof-of-stake (PoS) consensus to Proof-of-work (PoW) consensus. This would render mining useless because validators will be in charge of securing the new network.
Ethereum Price Analysis: Four Hour Chart

Ethereum price

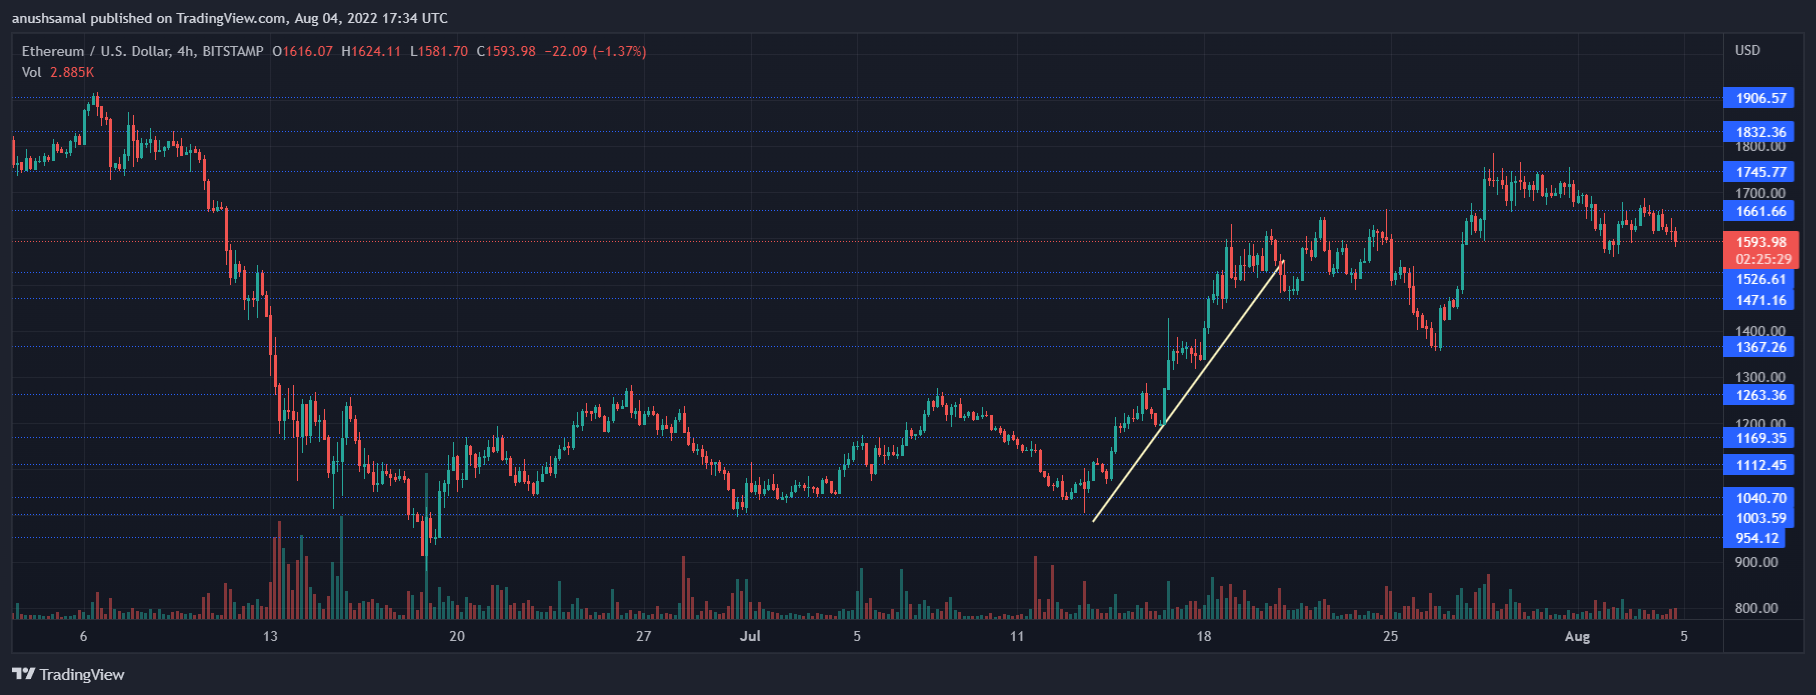
Ethereum was priced at $1,590 on the four hour chart | Source: ETHUSD on TradingView ETH was trading at $1,590 on the four hour chart. Currently the coin has managed to stay afloat over the $1,500 support line. Incase the number of sellers start to overpower the buyers, Ethereum price could soon fall to $1,300 on its chart.
Over the last week the coin has been moving up and down between the $1,700 and $1,600 price levels respectively. Immediate price resistance for the coin was at $1,745 and for bulls to be back, it is vital ETH moves above that level.

Local support for the coin was at $1,471 and a push by bears could make Ethereum price trade as low as $1,300. The amount of Ethereum traded remained low highlighting bearishness as sellers returned on the chart.
Technical Analysis

Ethereum price

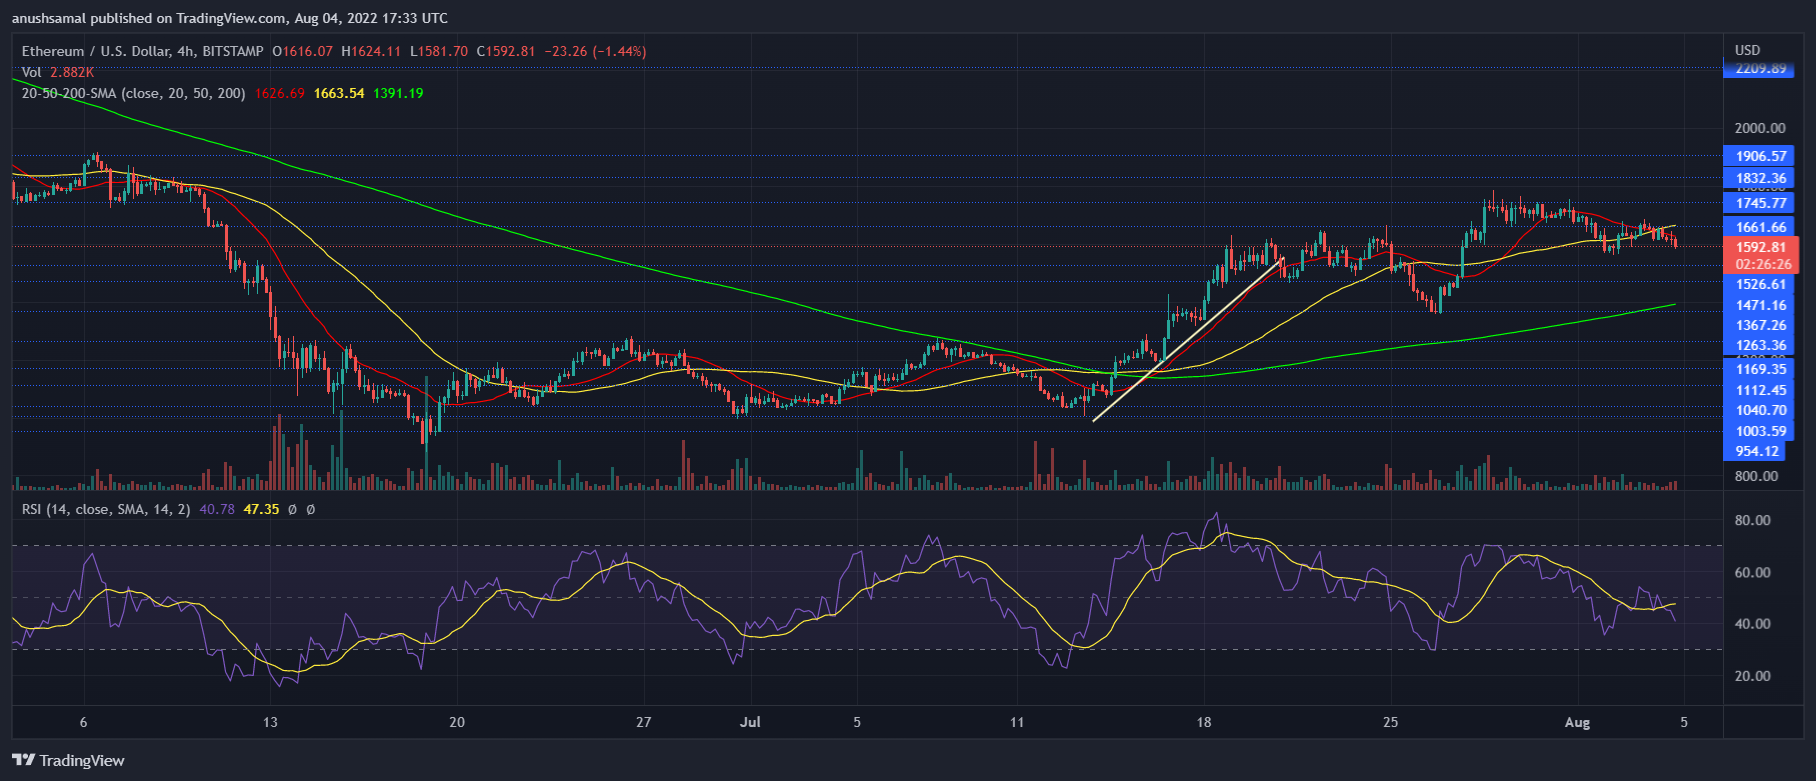
Ethereum displayed fall in buying strength on the four hour chart | Source: ETHUSD on TradingView The altcoin captured the effects of a sell-off as the indicators point towards negative price action. The Relative Strength Index was situated below the half-line as sellers took over the market.
Continued selling pressure will cause Ethereum to further lose considerable value. Ethereum price was below the 20-SMA line, this reading was considered bearish.
It meant that sellers were driving the price momentum in the market.

Ethereum price

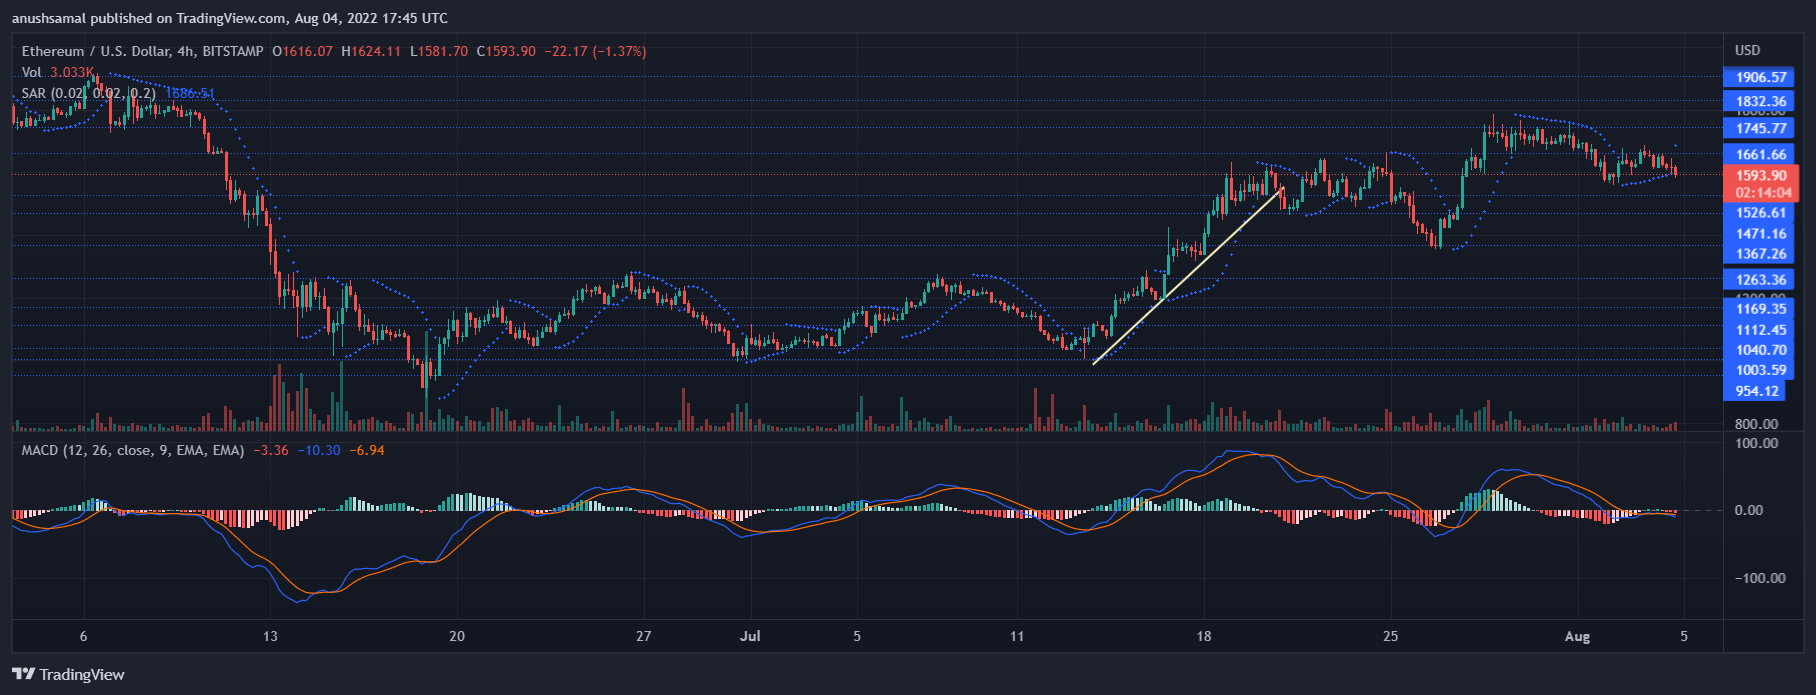
Ethereum flashed sell signal on the four hour chart | Source: ETHUSD on TradingView
ETH’s other indicators were in agreement with the fall in buying pressure. As Ethereum price extended losses, the coin continued to depict sell signal on its chart. Moving Average Convergence Divergence depicts the price direction and change in the same.
MACD underwent bearish crossover and that gave rise to red histograms which are tied to a sell signal for the coin. Parabolic SAR identifies the current trend in the market, the reading suggested that there was a downtrend as the indicator’s dotted lines were above the candlestick.

Letture associate

The Entire Internet Hails Noam's Joining, But OpenAI's Loss Bill Just Got Thicker

While the AI community celebrates Noam Shazeer, co-author of the "Attention Is All You Need" paper, joining OpenAI as Head of Architectural Research, the company's audited financials reveal a starkly different reality. In 2025, OpenAI reported $13.07 billion in revenue but a massive $20.92 billion operating loss. Even excluding a one-time accounting charge, the cash burn is severe, with $3.7 billion consumed in Q1 2026 alone. This high-profile hiring occurs against a backdrop of significant internal research talent drain, with key founders and researchers departing as the company's focus shifts from exploratory research to product iteration. Meanwhile, OpenAI's fundamental business model faces a deep crisis. It paid Microsoft $10.59 billion for compute in 2025, while its vast user base of 9 billion weekly actives includes only 50 million paying customers, making growth a direct driver of escalating costs. The article argues Shazeer's recruitment is less about technical necessity and more about crafting a compelling narrative for OpenAI's upcoming IPO, aiming to justify a rumored $1 trillion valuation to future public market investors. It contrasts OpenAI's strategy with Anthropic's reported path to profitability, which relies on a strong enterprise customer base and cost control, rather than star-powered narratives. Ultimately, the piece concludes that while Shazeer's architectural work may take 1-2 years to materialize, OpenAI's financial clock is ticking much faster, with its massive losses undercutting the celebratory headlines.

marsbit1 h fa

The Entire Internet Hails Noam's Joining, But OpenAI's Loss Bill Just Got Thicker

marsbit1 h fa

Market Trend (June 19): US-Iran Deal Drives Out Geopolitical Premium; Chip Stocks Soar to New Highs; Energy Sector Leads Declines

U.S. Market Trends (June 19): U.S.-Iran Deal Eases Tensions, Chip Stocks Soar, Energy Sector Leads Declines. U.S. stocks rallied on Thursday as the signing of a temporary U.S.-Iran deal in Geneva de-escalated Middle East tensions, with Saudi oil tankers transiting the Strait of Hormuz. This geopolitical relief helped markets recover from recent Fed-driven volatility. The S&P 500 rose over 1%, the Nasdaq gained nearly 2%, and the Dow Jones Industrial Average closed at another record high. The Philadelphia Semiconductor Index surged over 6% to a historic peak. Chip stocks were the standout performers. Reports of an Apple-Intel design and foundry deal for certain products, alongside mentions of potential Nvidia and SpaceX collaborations with Intel, propelled the sector. Intel surged ~10.5%, while memory chip makers like Micron also saw significant gains, highlighting sustained confidence in long-term AI capital expenditure. In contrast, the energy sector was the day's sole loser, with the S&P 500 energy sub-index declining as WTI crude fell ~2% to around $74.29/barrel. The reopening of key shipping routes erased prior geopolitical risk premiums. SpaceX extended losses for a second day on news of a potential large bond offering. Market volatility (VIX) dropped sharply, indicating a swift reversal of post-Fed jitters. Treasury yields dipped slightly but remained elevated. The focus now shifts to upcoming economic data, including next week's PCE inflation report and Micron's earnings, which will serve as a key test for the AI trade's durability.

marsbit2 h fa

Market Trend (June 19): US-Iran Deal Drives Out Geopolitical Premium; Chip Stocks Soar to New Highs; Energy Sector Leads Declines

marsbit2 h fa

Trading

Spot
Futures
活动图片