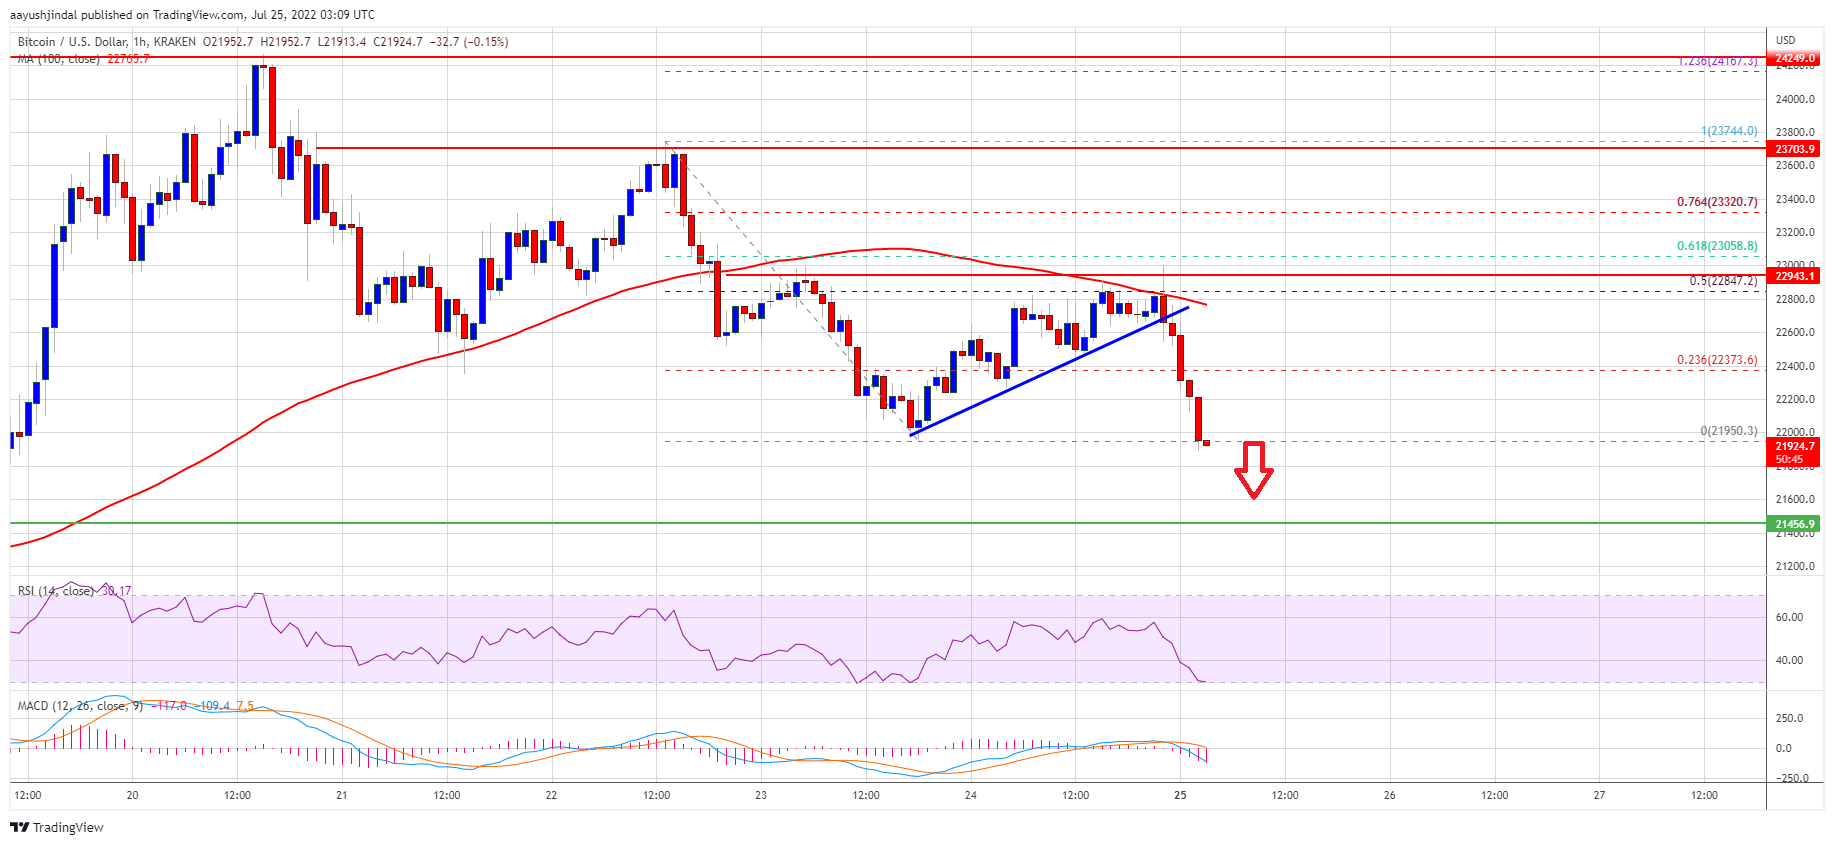
Bitcoin started a fresh decline from the $23,000 resistance against the US Dollar. BTC is declining and remains at a risk of a sharp decline below $21,800.
- Bitcoin started a downside correction and traded below the $22,200 level.
- The price is now trading below the $22,500 level and the 100 hourly simple moving average.
- There was a break below a key bullish trend line with support near $22,700 on the hourly chart of the BTC/USD pair (data feed from Kraken).
- The pair might decline heavily if there is a clear move below the $21,450 level.
Bitcoin Price Starts Fresh Decline
Bitcoin price attempted a clear move above the $24,000 resistance zone. However, the bears appeared near $23,800 zone. The last swing high was formed near $23,744 before there was a fresh decline.
The price declined below the $22,500 support level and the 100 hourly simple moving average. However, the bulls were active near the $21,950 zone. Recently, there was an upside correction above the $22,200 resistance zone. The price climbed above the 23.6% Fib retracement level of the downward move from the $22,744 swing high to $21,950 low.
However, the price faced sellers near the $23,000 zone and the 100 hourly simple moving average. The price failed near the 50% Fib retracement level of the downward move from the $22,744 swing high to $21,950 low.
It is now moving lower below $22,000. There was a break below a key bullish trend line with support near $22,700 on the hourly chart of the BTC/USD pair. It is now approaching a key support near $21,800 level. On the upside, bitcoin price could face resistance near the $22,200 level.
Source: BTCUSD on TradingView.com
The next key resistance is near the $22,500 zone. A close above the $22,500 resistance zone could set the pace for more gains. In the stated case, the price may perhaps rise towards the $23,000 level. The next major resistance sits near the $24,000 level.
Downside Break in BTC?
If bitcoin fails to stay above the $21,800 support, it could continue to move down. An immediate support on the downside is near the $21,600 level.
The next major support now sits near the $21,500 level. A clear break and close below the $21,500 support zone might send the price towards $20,500 in the near term or even $20,000.
Technical indicators:
Hourly MACD – The MACD is now gaining pace in the bearish zone.
Hourly RSI (Relative Strength Index) – The RSI for BTC/USD is well below the 50 level.
Major Support Levels – $21,600, followed by $21,500.
Major Resistance Levels – $22,200, $22,500 and $23,000.


