Les principales cryptos s'effondrent + Danse folle des altcoins, ETH passe sous 3000$, XRP s'écroule à 1.9$, Opportunités doubles : Achat de RATS et Vente à découvert de MERL

金色财经2025-12-16 tarihinde yayınlandı2025-12-16 tarihinde güncellendi

Özet

Le marché des cryptomonnaies vit actuellement une forte divergence : les principales monnaies comme Ethereum et Ripple plongent, tandis que certaines altcoins affichent des performances volatiles. Ethereum (ETH) a chuté de 5%, tombant sous les 3000 dollars, avec un support clé à 2920 dollars. Les résistances à surveiller sont 2980, 3050 et 3080 dollars. Les indicateurs techniques (MACD et RSI) restent baissiers. Ripple (XRP) a également chuté, passant sous 1,95 dollar, avec un support immédiat à 1,855 dollar. Une reprise nécessiterait de franchir 1,92 dollar. En revanche, RATS affiche trois jours consécutifs de hausse, avec une configuration en double creux. Un repli vers 0,000035 dollar pourrait offrir une opportunité d'achat. MERL a connu une hausse de 17%, considérée comme un piège haussier. Il est recommandé de vendre à découvert entre 0,46 et 0,48 dollar, avec un objectif à 0,40 dollar. ASTER a rebondi après avoir touché 0,765 dollar, mais il est préférable d'attendre un repli pour envisager un achat. Enfin, FOLKS, après un pic, est en baisse constante, offrant une opportunité de vente à découvert à faible effet de levier. En résumé : prudence sur ETH et XRP, opportunité d'achat sur RATS, vente à décourt sur MERL et FOLKS, et attentisme sur ASTER.

Le monde crypto revit le "dilemme du feu et de la glace" ! ETH et XRP plongent avec le Bitcoin, tandis que certains altcoins montent en flèche et d'autres creusent leur trou. Explications détaillées pour éviter les pièges et saisir les opportunités~Groupe gratuit +Q:3260353596

? ETH : -5%, passe sous 3000$ ! 2920$ devient la ligne de sauvetage

Ethereum n'a vraiment pas tenu le choc. Après avoir perdu 3150$, il a plongé en chute libre, brisant tous les supports à 3120$, 3050$, 3000$, touchant un plus bas à 2916$ et évoluant maintenant sous 3000$, en dessous de la moyenne mobile sur 100 heures. La dynamique baissière est forte.

Pour un rebond ? Il faut franchir 3 obstacles :

Premier obstacle à 2980$, une légère hausse pourrait rencontrer une résistance ;

Deuxième obstacle à 3050$ (niveau de retracement de 50% de la vague de baisse précédente) ;

Le plus dur est à 3080$, une cassure est nécessaire pour viser 3120$, puis 3175$.
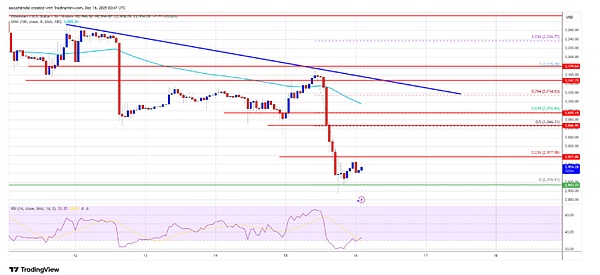
Si le rebond échoue, surveillez les supports : 2950$→2920$→2880$→2800$. Si 2920$ cède, une chute plus profonde est probable. Les indicateurs techniques ne sont pas favorables non plus : le MACD se renforce en territoire baissier, le RSI est sous 50, l'élan de baisse n'est pas terminé.

? XRP : Éclatement sous 1.95$ ! 1.85$ en péril

XRP tentait un rebond à 2.02$ mais a été ramené brutalement à la réalité, chutant sous 2.00$, 1.95$, pour toucher un plus bas à 1.855$. Il ne tient même plus 1.90$ et la moyenne mobile sur 100 heures. Un canal baissier s'est formé sur le graphique horaire, avec une résistance autour de 1.980$.
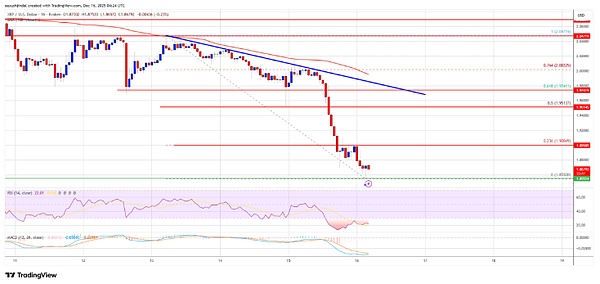
Les clés d'un rebond sont à trois niveaux : 1.90$→1.92$→1.95$. S'il se stabilise au-dessus de 1.92$, il pourrait alors tenter 1.98$, puis 2.05$. S'il ne dépasse pas 1.90$, surveillez le support à 1.855$. Une rupture ouvre la voie vers 1.82$, puis 1.765$. Le MACD accélère en zone baissière, le RSI est sous 50, la tendance à court terme reste baissière.Groupe gratuit +Q:3260353596

? RATS : 3 hausses consécutives ! Achat possible vers 0.000035

À l'inverse des principales cryptos, RATS affiche récemment une forte performance haussière, avec 3 bougies vertes quotidiennes consécutives et une formation en double creux (W). Le MACD est au-dessus de zéro, le momentum s'accélère. Il y a de fortes chances qu'il comble la mèche supérieure et teste la résistance autour de 0.00005$.
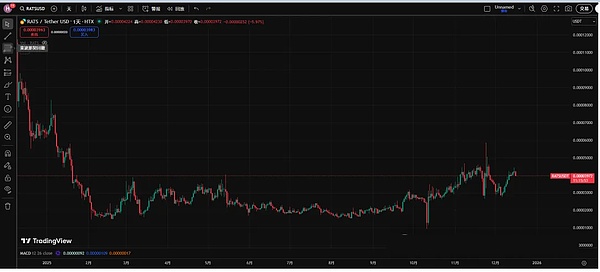
Conseil trading : Sur un repli à court terme vers 0.000035$, les traders swing peuvent acheter une petite position au comptant (spot) et prendre leurs bénéfices vers 0.00005$. Le ratio risque/rendement est intéressant~Groupe gratuit +Q:3260353596

⚠️ MERL : Hausse forcée de 17% pour attirer les acheteurs ! Vente à découvert entre 0.46-0.48

La manœuvre de MERL est flagrante : +17% en 24h pour atteindre 0.48$, stagnation maintenant entre 0.46-0.47$. C'est clairement un pump en fenêtre de faible liquidité pour piéger les acheteurs (bull trap).
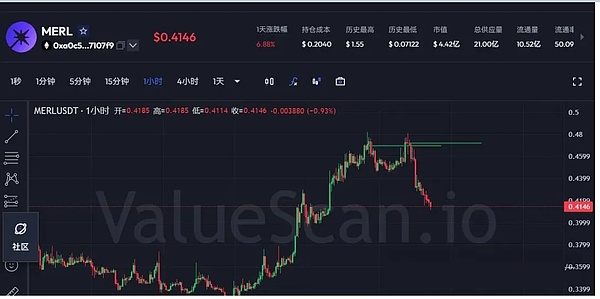
Mon analyse est baissière ! Le scénario probable est : pression de vente anticipée → consolidation lente vers le bas → vente de panique. Je recommande de vendre à découvert (short) directement autour de 0.46-0.48$, sans attendre que le market maker trace une grande bougie verte pour attirer les derniers acheteurs. Objectif à court terme : 0.4$, une descente vers 0.35$ est possible.Groupe gratuit +Q:3260353596

? ASTER : Épicée à 0.765$ puis récupération ! Attendre une opportunité d'achat

ASTER a touché une pointe basse (wick) à 0.765$ avant de remonter immédiatement, touchant précisément le niveau de retracement 0.618 de Fibo (mais les wicks d'ouverture ont une signification limitée). La formation ressemble à un wedge descendant, la solidité du plancher reste à observer.
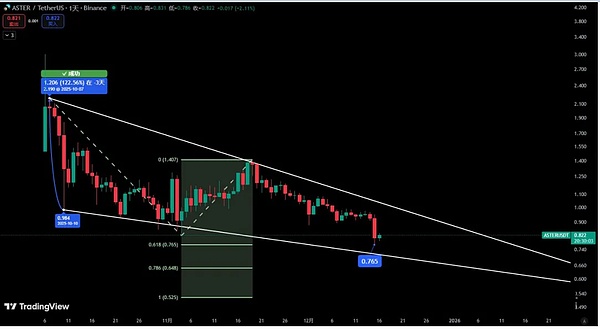
Ceux qui ne sont pas investis ne doivent pas se précipiter, pas besoin de courir après la hausse. Attendez d'acheter près du bas, ajustez votre stratégie ensuite pour éviter d'être piégé par les wick.

? FOLKS : Hausse explosive puis baisse régulière ! Opportunité de short à effet de levier faible long terme

FOLKS est vraiment "le paradis puis l'enfer". Après une hausse explosive, il a entamé une lente et régulière descente, un schéma classique pour许多 nouvelles cryptos à contrats.
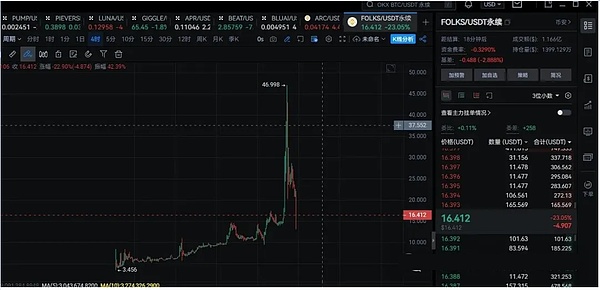
Conseil trading : Après l'apparition d'un sommet, vous pouvez vendre à découvert (short) avec un faible effet de levier pour le long terme. Si vous pouvez le garder, le profit pourrait être élevé ! Une fois cette tendance baissière installée, un renversement est peu probable à court terme, pas besoin de craindre de rater le mouvement.Groupe gratuit +Q:3260353596

Résumé : ETH et XRP sont baissiers à court terme, surveillez les supports clés et n'achetez pas aveuglément. RATS peut être acheté sur repli, MERL est recommandé en short, ASTER est à observer, FOLKS convient pour un short à faible levier long terme. Le marché crypto est très fragmenté en ce moment, ne soyez pas trop gourmand, concentrez-vous sur 1-2 actifs~


Trend Kriptolar

İlgili Sorular

QQuel est le niveau de support critique pour ETH mentionné dans l'article, et que se passe-t-il s'il est rompu ?

ALe niveau de support critique pour ETH est de 2920 dollars. S'il est rompu, l'article indique qu'une baisse plus profonde est probable, avec des niveaux de support suivants à 2880 et 2800 dollars.

QQuelle configuration technique RATS a-t-il formé, et quel est le prix cible suggéré pour prendre des bénéfices ?

ARATS a formé un modèle technique en double creux (W) sur les graphiques quotidiens. Le prix cible suggéré pour prendre les bénéfices est d'environ 0,00005 dollar.

QPourquoi l'article recommande-t-il une position courte sur MERL, et à quel niveau de prix suggère-t-il d'entrer ?

AL'article recommande une position courte sur MERL car il estime que la hausse de 17% est une manœuvre d'incitation (pump) orchestrée par les gros détenteurs (whales) pour attirer les acheteurs avant un effondrement. Il suggère d'entrer en position courte autour de 0,46-0,48 dollar.

QQuel indicateur technique est mentionné comme étant dans le territoire baissier à la fois pour ETH et XRP ?

APour ETH et XRP, l'indicateur technique MACD (Moving Average Convergence Divergence) est mentionné comme étant dans le territoire baissier et montrant une dynamique de vente.

QQuel est le scénario général du marché décrit dans le titre de l'article ?

ALe titre décrit un scénario de marché où les principales cryptomonnaies (mainstream coins) subissent une forte baisse ('跌麻'), tandis que certaines pièces spéculatives moins connues ('妖币') connaissent une volatilité erratique et des mouvements de prix imprévisibles ('乱舞').

İlgili Okumalar

Playing the "Decoupling" Card Again? Domestic Optical Modules Face a Stress Test

The U.S. Federal Communications Commission (FCC) is reportedly drafting a ban on importing new models of Chinese-made optical transceiver modules, with a potential implementation target of 2026. This "decoupling" move comes as Chinese firms, led by industry leaders like Zhongji Innolight and Eoptolink, dominate the global optical module market with over 60% share, and hold an even larger position in the high-speed 800G and 1.6T segments critical for AI data centers. Market reactions were mixed: U.S. optical module stocks initially rose, while Chinese A-shares opened lower but largely recovered by the close. Analysis suggests a complete U.S. decoupling from Chinese modules faces significant hurdles. North American cloud giants (Meta, Google, Microsoft, Amazon) and NVIDIA have massive demand for high-speed modules, estimated at around 40 million units in 2026. U.S. manufacturers' combined monthly production capacity for these modules is less than one-fifth that of a single major Chinese player like Zhongji Innolight, which reported production of 23.76 million units in 2025. Chinese companies are heavily reliant on the U.S. market, with over 90% of revenue for top firms coming from overseas, primarily the U.S. However, they have begun mitigating risks by establishing assembly plants in Southeast Asia and Mexico. Industry observers note the final impact depends on whether any potential U.S. restrictions target specific companies or products based on origin. Past U.S. sanctions on Chinese tech firms have often spurred increased domestic R&D and market diversification. Despite initial stock volatility, shares of major Chinese optical module companies pared losses, indicating market belief in the sector's resilience and the practical difficulties of abruptly replacing Chinese supply.

marsbit8 dk önce

Playing the "Decoupling" Card Again? Domestic Optical Modules Face a Stress Test

marsbit8 dk önce

When the Competition in Chip Manufacturing Equipment Stops Being Just About Who Is More Advanced

The competition in chip manufacturing equipment is no longer solely about who has the most advanced technology. While performance, yield, and cost remain key, U.S. export controls are adding a critical new dimension: long-term supply chain reliability. Major chipmakers like Samsung and SK Hynix, despite having mature supply chains with leading American and European vendors, are reportedly evaluating etching equipment from China's AMEC for their Chinese factories. This move is not primarily about immediate replacement or AMEC's current capabilities. Instead, it's a risk mitigation strategy. Companies are concerned that future U.S. policies could disrupt their access to spare parts, software updates, and maintenance for existing equipment over its decade-long lifespan. For chipmakers investing billions in fabs with long planning cycles, this policy-induced uncertainty is a significant new risk. The U.S., through its controls, is inadvertently eroding the very reliability and certainty that were foundational strengths of its equipment suppliers. This creates a pivotal shift for Chinese semiconductor equipment. Previously seen largely as a "domestic replacement" option when foreign gear was unavailable, they are now being assessed as potential "contingency suppliers" by global players—even before a supply disruption occurs. This provides a crucial entry point for validation in real production lines, which is essential for iterative improvement. Chinese equipment, particularly in areas like etching, has progressed from prototypes to participating in mass production within China, gaining valuable experience. However, this does not signify full global competitiveness. Gaps remain in advanced lithography, metrology, and other key tools. The current evaluations are largely confined to foreign firms' China-based fabs, not their global procurement networks. The core change is in the decision-making framework. Efficiency-driven globalization favored single, optimal suppliers. An era of heightened geopolitical risk is forcing companies to value "replaceability." While technical prowess remains paramount, supply chain certainty is now being factored into a device's competitive equation. Ultimately, U.S. policies have not made Chinese equipment more advanced, but they have given global customers a compelling reason to start testing it. The competition has expanded: it's no longer just about who is more advanced, but also about who can be relied upon to stay.

marsbit9 dk önce

When the Competition in Chip Manufacturing Equipment Stops Being Just About Who Is More Advanced

marsbit9 dk önce

Trading Volume Increased by 2.5x, Why Did Circle's Revenue Only Grow by 7%?

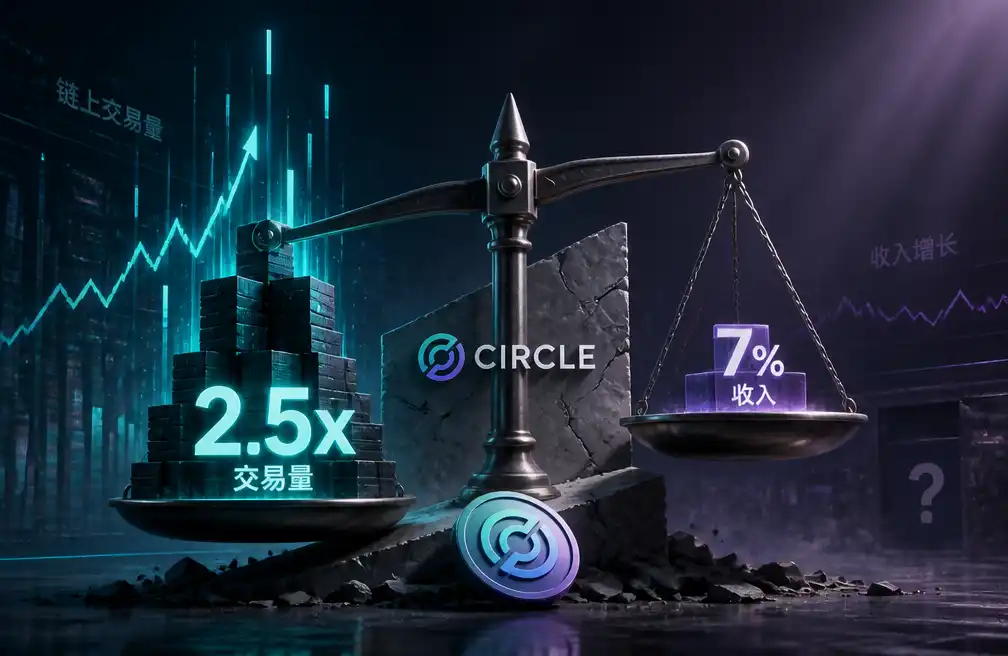
Circle's Q2 performance presents a seemingly contradictory picture: the transaction volume of its stablecoin USDC surged 151% year-over-year to $14.8 trillion, while its "Total Revenue & Reserve Revenue" grew by only 7% to $701 million. This discrepancy highlights the core of Circle's business model. Revenue is primarily driven not by transaction volume, but by the average amount of USDC in circulation and the yield generated from its reserves. Key points: 1. **Revenue Drivers:** Over 90% of revenue comes from "reserve income," which is a function of average USDC circulation (up 25% YoY) and the reserve yield (which fell by 66 basis points). The net effect was a mere ~5% increase in reserve income. 2. **Transaction vs. Revenue:** High transaction volume indicates robust usage of USDC for payments and settlements, but does not translate directly to revenue. It must first convert into a sustained, average circulating balance. 3. **Cost Structure:** After accounting for distribution and other costs, the metric "Revenue Less Direct Costs" (RLDC) grew faster than total revenue, with its margin improving. However, rising operating expenses (up 23% YoY) meant that Adjusted EBITDA growth was limited to 8%. 4. **New Initiatives:** Circle reported progress on new networks like the Circle Payments Network and upcoming products (Arc, Agent Stack), but these are currently measured by adoption metrics (e.g., transaction run-rate, number of services) rather than material revenue contribution this quarter. In summary, the financial results are determined by the interplay of USDC circulation, reserve yields, and cost structures, while high transaction volume signals underlying network strength that has not yet fully flowed through to the income statement.

marsbit26 dk önce

Trading Volume Increased by 2.5x, Why Did Circle's Revenue Only Grow by 7%?

marsbit26 dk önce

Samsung China, Another Step Back

Samsung China Takes Another Step Back Samsung Electronics is further retreating from the Chinese consumer market. Following the exit of its home appliance business in May, its mobile phone division is now reportedly scaling down. Stores with monthly sales below 300,000 RMB are being closed in several cities. Data shows Samsung's smartphone market share in China has plummeted to 0.1% in Q2 2026, a stark contrast to its 22% global leadership. The decline is attributed to intense competition from domestic brands offering better value, higher specs (like faster charging), and superior localization in software and services. Samsung's premium pricing and less adapted One UI system have struggled against rivals like Huawei, Xiaomi, and Honor. This consumer electronics retreat coincides with Samsung's record-breaking semiconductor profits, driven by the AI boom. In Q2 2026, the chip division contributed nearly all operating profit, while the mobile and home appliance unit posted its first-ever operating loss. Internal dynamics, like the chip division charging market prices to the mobile unit, have increased cost pressures. Samsung's strategy now appears to be a focused retreat towards the ultra-premium segment in China, similar to its global push in high-end foldables like the Galaxy Z Fold8. The company is likely to retain only key stores in major cities to serve a niche, high-end clientele. While its deep semiconductor reserves offer a cushion, this shift away from mass-market consumer electronics reduces business diversification. The move is pragmatic but signifies a fundamental transformation; Samsung is ceding mass-market influence and betting heavily on its semiconductor strength and a narrowed premium product focus.

marsbit30 dk önce

Samsung China, Another Step Back

marsbit30 dk önce

Helium, Naphtha, and Photoresist: The Three Critical Vulnerabilities of Semiconductor Fabs

The article "Helium, Naphtha, Photoresist: The Three Achilles' Heels of Semiconductor Fabs" analyzes a hypothetical 2026 supply crisis triggered by geopolitical conflict in the Middle East, focusing on three critical materials for semiconductor manufacturing: helium, naphtha, and photoresist. A key attack on a Qatari LNG facility and the blockade of the Strait of Hormuz threaten the global supply of helium (a byproduct of LNG) and naphtha (a petroleum product). This creates a triple threat of shortages that could halt chip production. Helium is essential, particularly for precise wafer temperature control in dry etching processes; a shortage would cause an immediate "instant failure" in these steps. Naphtha is the foundational raw material for numerous equipment consumables and, crucially, for photoresist chemicals. Japan dominates the photoresist market, relying on a single key supplier for intermediates. The analysis shows the impacts would differ. The tiny fraction of global naphtha used for semiconductors (under 0.1%) makes securing supply for photoresist relatively easier. Helium is the greater vulnerability. Qatar supplies about one-third of the world's helium, exceeding the total annual consumption of the semiconductor industry (21-24% of global supply). While short-term buffers like corporate reserves, recycling, and prioritization (e.g., cutting balloon use first) can delay the crisis, helium cannot be stored long-term due to boil-off. Fabs typically hold only days to weeks of inventory. The consequences would be severe and tiered. Advanced logic nodes (e.g., 2nm, 3nm) using complex processes like GAA would be hit hardest, potentially stopping within three months. Mature nodes for automotive and power semiconductors would also eventually halt (within 6-12 months), which could be catastrophic for the auto industry due to stringent certification requirements. The crisis would unfold not as a sudden global stop, but through a sequence of allocation, severe price spikes, reduced output of low-margin products, and partial fab shutdowns by region and company if the shortage persists beyond a year.

marsbit32 dk önce

Helium, Naphtha, and Photoresist: The Three Critical Vulnerabilities of Semiconductor Fabs

marsbit32 dk önce

İşlemler

Spot

Popüler Makaleler

RATS Nasıl Satın Alınır

HTX.com’a hoş geldiniz! RATS (RATS) (RATS) satın alma işlemlerini basit ve kullanışlı bir hâle getirdik. Adım adım açıkladığımız rehberimizi takip ederek kripto yolculuğunuza başlayın. 1. Adım: HTX Hesabınızı OluşturunHTX'te ücretsiz bir hesap açmak için e-posta adresinizi veya telefon numaranızı kullanın. Sorunsuzca kaydolun ve tüm özelliklerin kilidini açın. Hesabımı Aç2. Adım: Kripto Satın Al Bölümüne Gidin ve Ödeme Yönteminizi SeçinKredi/Banka Kartı: Visa veya Mastercard'ınızı kullanarak anında RATS (RATS) (RATS) satın alın.Bakiye: Sorunsuz bir şekilde işlem yapmak için HTX hesap bakiyenizdeki fonları kullanın.Üçüncü Taraflar: Kullanımı kolaylaştırmak için Google Pay ve Apple Pay gibi popüler ödeme yöntemlerini ekledik.P2P: HTX'teki diğer kullanıcılarla doğrudan işlem yapın.Borsa Dışı (OTC): Yatırımcılar için kişiye özel hizmetler ve rekabetçi döviz kurları sunuyoruz.3. Adım: RATS (RATS) (RATS) Varlıklarınızı SaklayınRATS (RATS) (RATS) satın aldıktan sonra HTX hesabınızda saklayın. Alternatif olarak, blok zinciri transferi yoluyla başka bir yere gönderebilir veya diğer kripto para birimlerini takas etmek için kullanabilirsiniz.4. Adım: RATS (RATS) (RATS) Varlıklarınızla İşlem YapınHTX'in spot piyasasında RATS (RATS) (RATS) ile kolayca işlemler yapın.Hesabınıza erişin, işlem çiftinizi seçin, işlemlerinizi gerçekleştirin ve gerçek zamanlı olarak izleyin. Hem yeni başlayanlar hem de deneyimli yatırımcılar için kullanıcı dostu bir deneyim sunuyoruz.

353 Toplam GörüntülenmeYayınlanma 2024.12.12Güncellenme 2026.06.02

RATS Nasıl Satın Alınır

Tartışmalar

HTX Topluluğuna hoş geldiniz. Burada, en son platform gelişmeleri hakkında bilgi sahibi olabilir ve profesyonel piyasa görüşlerine erişebilirsiniz. Kullanıcıların RATS (RATS) fiyatı hakkındaki görüşleri aşağıda sunulmaktadır.

活动图片