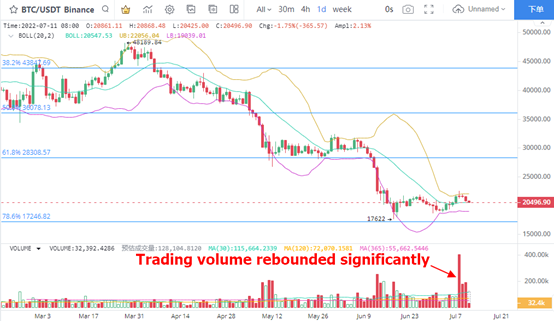
1、 BTC volume fallback
In the daily K-line chart of BTC, the rising and falling signal reappears, and the trading volume is significantly enlarged during this price fall.
On July 8, the trading volume reached 1.58 times of the recent peak, indicating that the high turnover performance of BTC has not ended. The record high peak trading volume means that the turnover rate has reached a higher level, making investors' holding costs more consistent. As a result, BTC will confirm important bottom signals in the performance of more trading volume.
However, the short-term trading volume of BTC is excessively enlarged, and the long and short competition of positive BTC is still quite fierce. The intensification of long and short competition in low-cost areas means that the signs of bottoming are not clear, and there is still a greater opportunity for the market to fluctuate repeatedly. In the short term, we cannot rule out the emergence of a relatively volatile market. In the near future, it is more likely that BTC will withdraw to the corresponding $19033 of brin line off track.
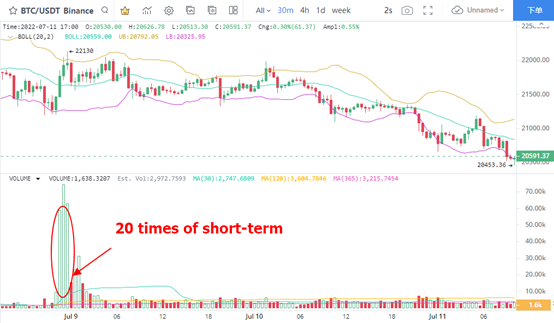
The basis for the daily K-line volume is the 20 times of the volume of BTC on July 8. The main force quickly increased in large quantities in the 30 minute K-line chart, and BTC rose. Although the BTC price finally rose and fell, the main trading intention is clear, and the further operation of bulls is worthy of attention.
2. Investors' cost of holding money has changed significantly
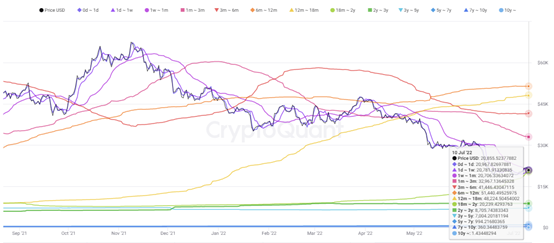
With the intensification of the volatility of BTC in a small price range, the cost price of currency held by different investors changes greatly.
From the change of short-term and long-term investors' holding money, the cost price of investors who hold money for a period of 1 week to 1 month fell to $20706. The cost price of investors with a holding period of 18 to 24 months rebounded to $20239. As the cost prices of short-term and long-term investors meet in the price range of $20000 to $21000, the market is on the verge of change. After 18 to 24 months of significant recovery in the cost price of investors, their holding cost is very close to the current price. Therefore, from the perspective of selling intention, the number of short-term BTC sales may decrease, which is beneficial to the stabilization of BTC price. The disadvantage is that BTC changes hands quickly, and the stability of investors' holdings in the short term is questionable.
3. The number of BTC giant whale addresses decreased
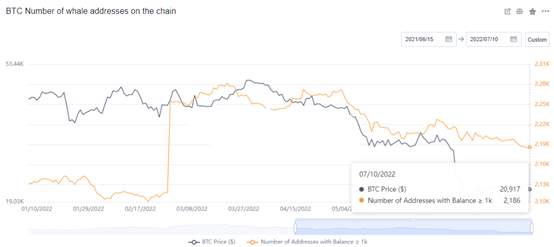
The number of BTC giant whale addresses showed signs of continuous decline. Although the decline trend was slow, it showed that the enthusiasm of the main force for holding coins continued to weaken. The number of giant whale addresses peaked at 2282 on March 21, and fell to 2186 on July 10, a decrease of 96. According to the calculation of more than 1000 BTCs held at each Jujing address, as many as 96000 BTCs have been transferred from Jujing. Generally speaking, the decline in the number of megawhale addresses indicates that BTC chips are loose, and more small and medium-sized investors hold BTC, so the price is unlikely to rise significantly in the short term.
4. Eth shrinkage fallback
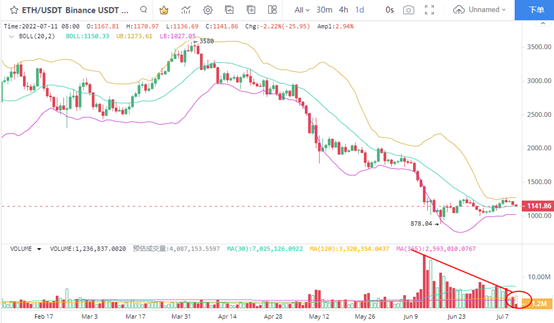
In the daily K-line chart of eth, with the short-term decline of eth, the adjustment performance reappears. The difference is that there was no volume signal during the price retreat of eth, indicating that after the trading heat cooled, the selling pressure decreased accordingly. This eth drawdown stage is the most important trading volume contraction performance. When the trading volume is close to falling below the equivalent line, the price may still rebound around $1000.
Therefore, while paying attention to the volatility intensity of eth, if the market heat remains the status quo, you can pay attention to the low buying point of $1000.
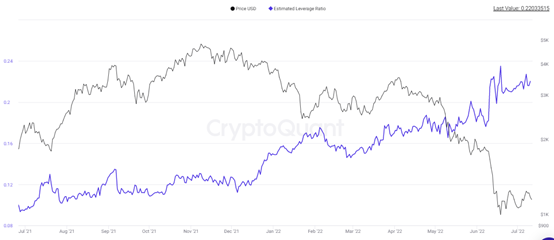
5. Eth estimated high leverage operation
Recently, the estimated leverage ratio of eth has obviously been at a high level. This shows that when the price of eth is below $1300, investors make full use of leveraged trading eth. In terms of market conditions, ETH has little room for fluctuation under the premise of high leverage, and the intraday amplitude remains at a low level. The fluctuation intensity on most trading days is less than 10%. In terms of leverage ratio, the leverage ratio reached 0.22 on July 10, which was a high level in one month.
Compared with investors' eth reserves, investors' contract leverage ratio is high, which proves that investors' leverage energy is enhanced. When eth is around $1100, high leverage means that volatility is also high. Although the support of $1000 is still valid, it should be noted that after the fluctuation of eth price increases, the area that can be reached is the source of risk for leveraged traders.