The Uptober Breakout

insights.glassnode2025-10-07 tarihinde yayınlandı2025-10-09 tarihinde güncellendi

Excerpt

Bitcoin broke through the $114k–$117k supply zone to reach a new all-time high near $126k, backed by strong ETF inflows and renewed mid-tier accumulation. While on-chain and spot signals remain constructive, rising leverage and crowded call positioning suggest growing short-term fragility.

Executive Summary

  • On-chain profitability has surged, with 97% of supply now in profit. While elevated profit levels often precede consolidation, realized profits remain contained, suggesting an orderly rotation rather than distribution pressure.
  • The $117K supply cluster has been flipped into support, marking a structural pivot where small and mid-sized holders continue to accumulate, offsetting moderate profit-taking from larger entities.
  • Bitcoin has broken to new all-time highs near $126K, driven by renewed spot demand and record ETF inflows exceeding $2.2B. The surge in institutional participation has lifted both price and market activity, with spot volumes reaching multi-month highs as Q4 begins.
  • Derivatives markets expanded sharply during the rally, with futures open interest and funding rates rising as late longs entered. The current pullback is now testing this leverage, helping to reset positioning and restore balance.
  • In the options market, implied volatility has lifted, skew turned neutral, and call-heavy flows dominate. Momentum remains strong, but bullish positioning is becoming increasingly crowded.
💡
View all charts in this edition in The Week On-chain Dashboard.

Bitcoin has broken through the dense supply cluster held by top buyers between $114k and $117k, establishing a new all-time high at $126k. This breakout signals renewed market strength but also raises questions about sustainability at elevated levels. In this edition, we analyze on-chain accumulation and distribution patterns alongside spot and options market dynamics to assess short-term risk, market resilience, and the potential for continuation or near-term fragility.

On-Chain Outlook

Accumulation Resurgence

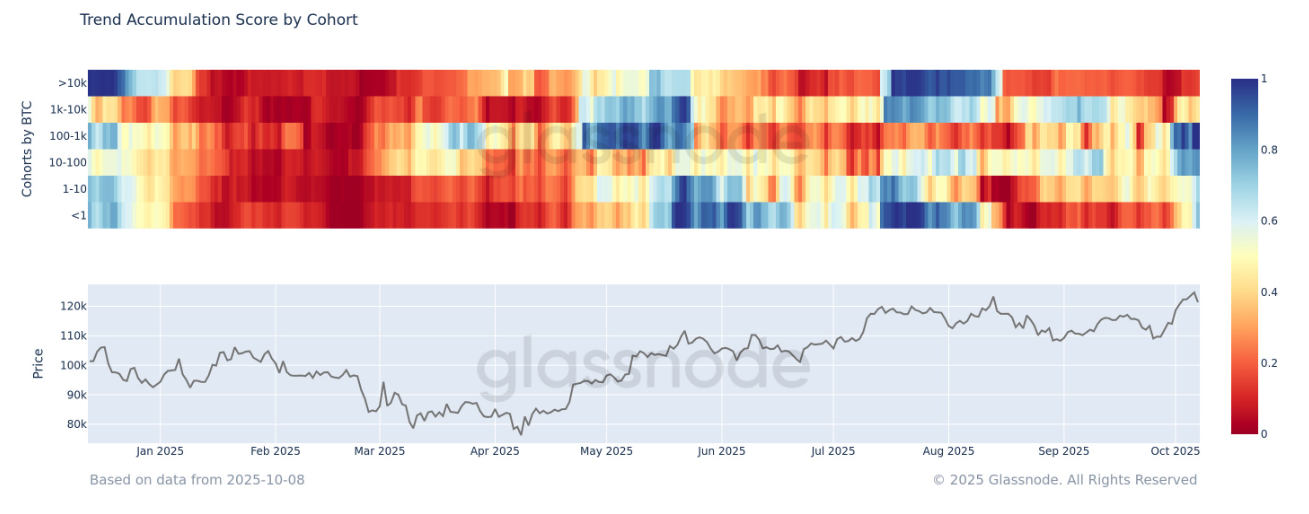
Following Bitcoin’s breakout to new highs, we turn to the Trend Accumulation Score to evaluate underlying demand strength. This metric measures the balance between accumulation and distribution across wallet cohorts.

Recent readings indicate a clear resurgence in buying, driven by small to mid-sized entities (10–1k BTC), which have accumulated consistently over the past few weeks. Meanwhile, whale distribution has eased from earlier in the year. The alignment among mid-tier holders points to a more organic accumulation phase, adding structural depth and resilience to the ongoing rally.

Resistance Flipped into Support

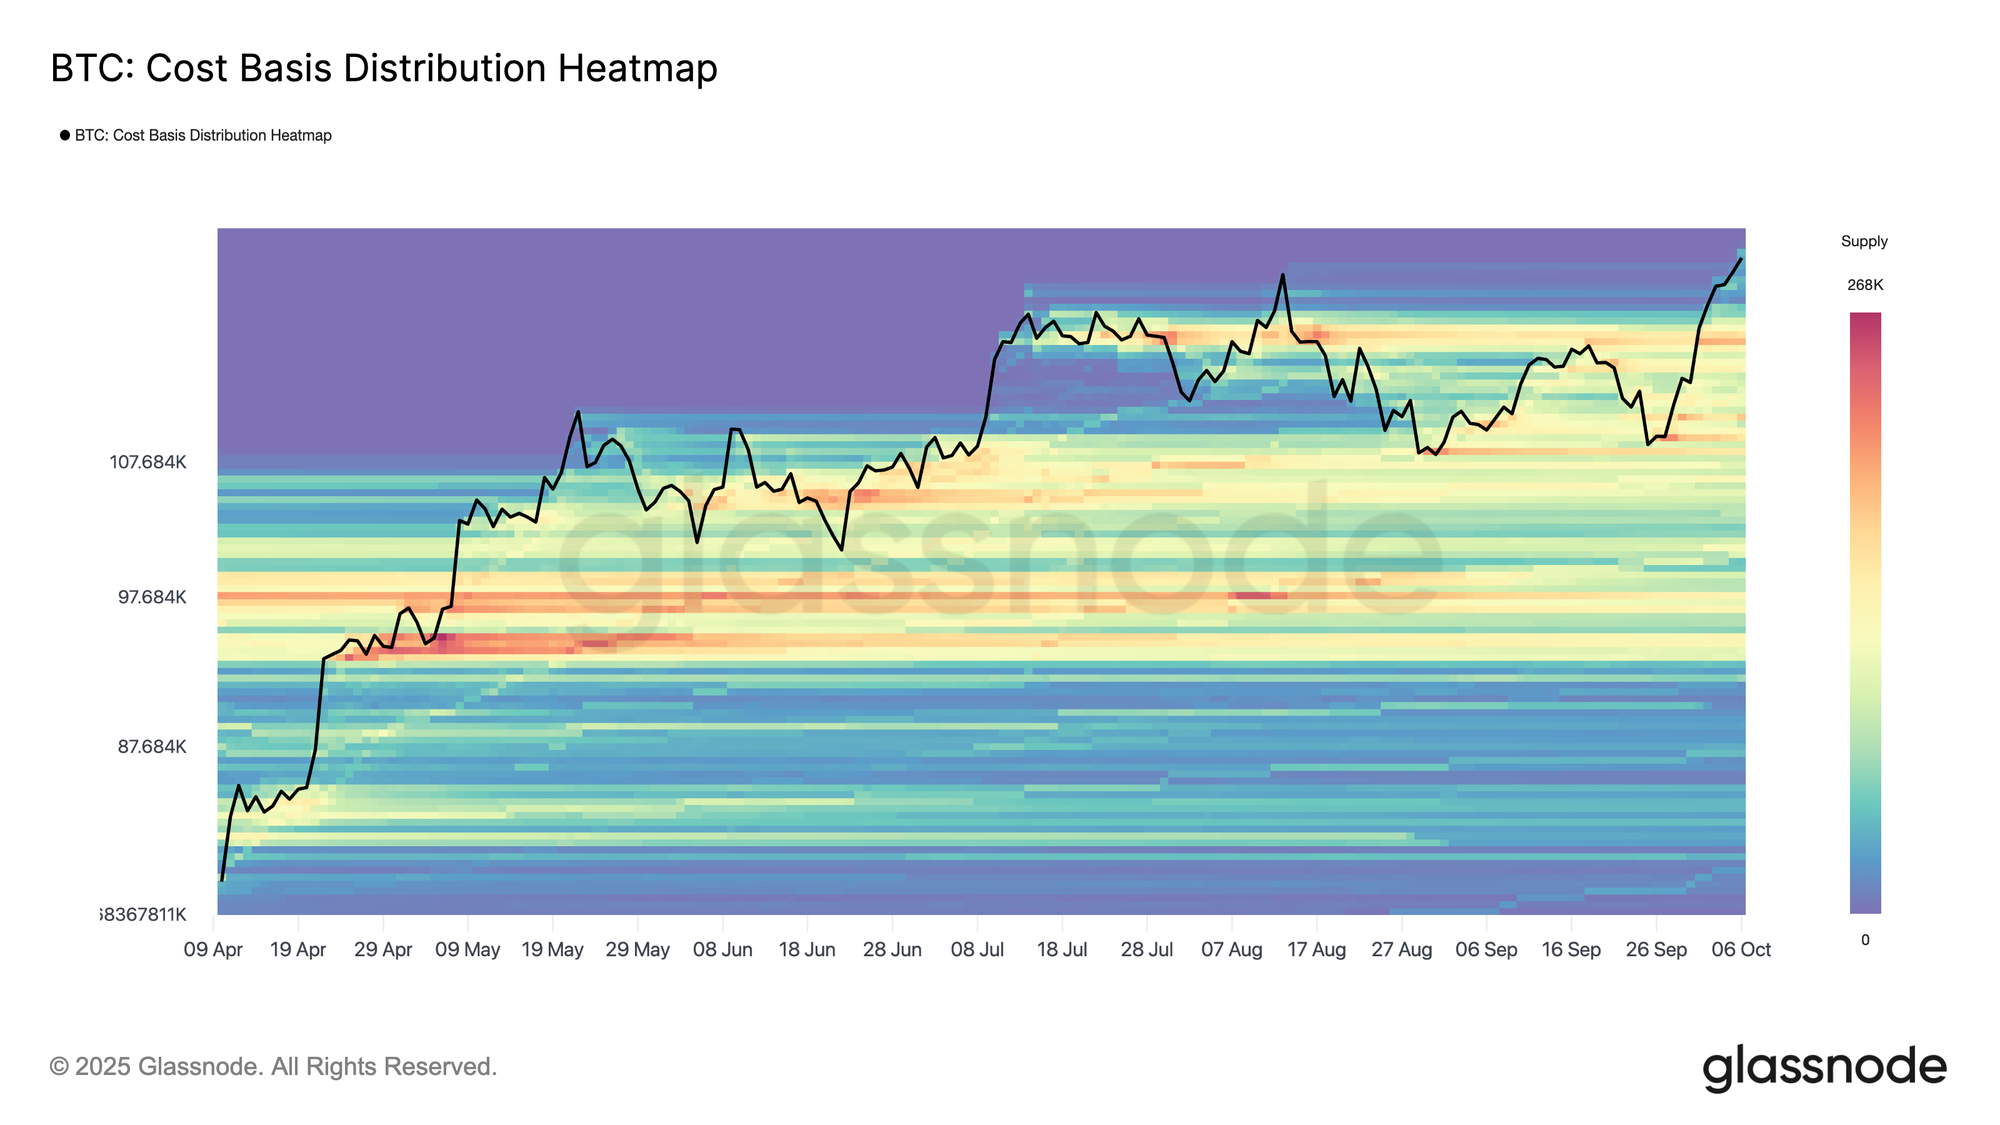
Building on the accumulation trend, Bitcoin’s rally to a new all-time high has lifted nearly all circulating supply back into profit. The Cost Basis Distribution Heatmap shows limited structural support between $121k and $120k, with a stronger cluster near $117k, where roughly 190k BTC were last acquired.

While price discovery phases inherently carry the risk of exhaustion, a potential pullback into this region could invite renewed demand as recent buyers defend profitable entry zones, marking a key area to watch for stabilization and a resurgence of momentum.

Live Chart

Mild Profit-Taking

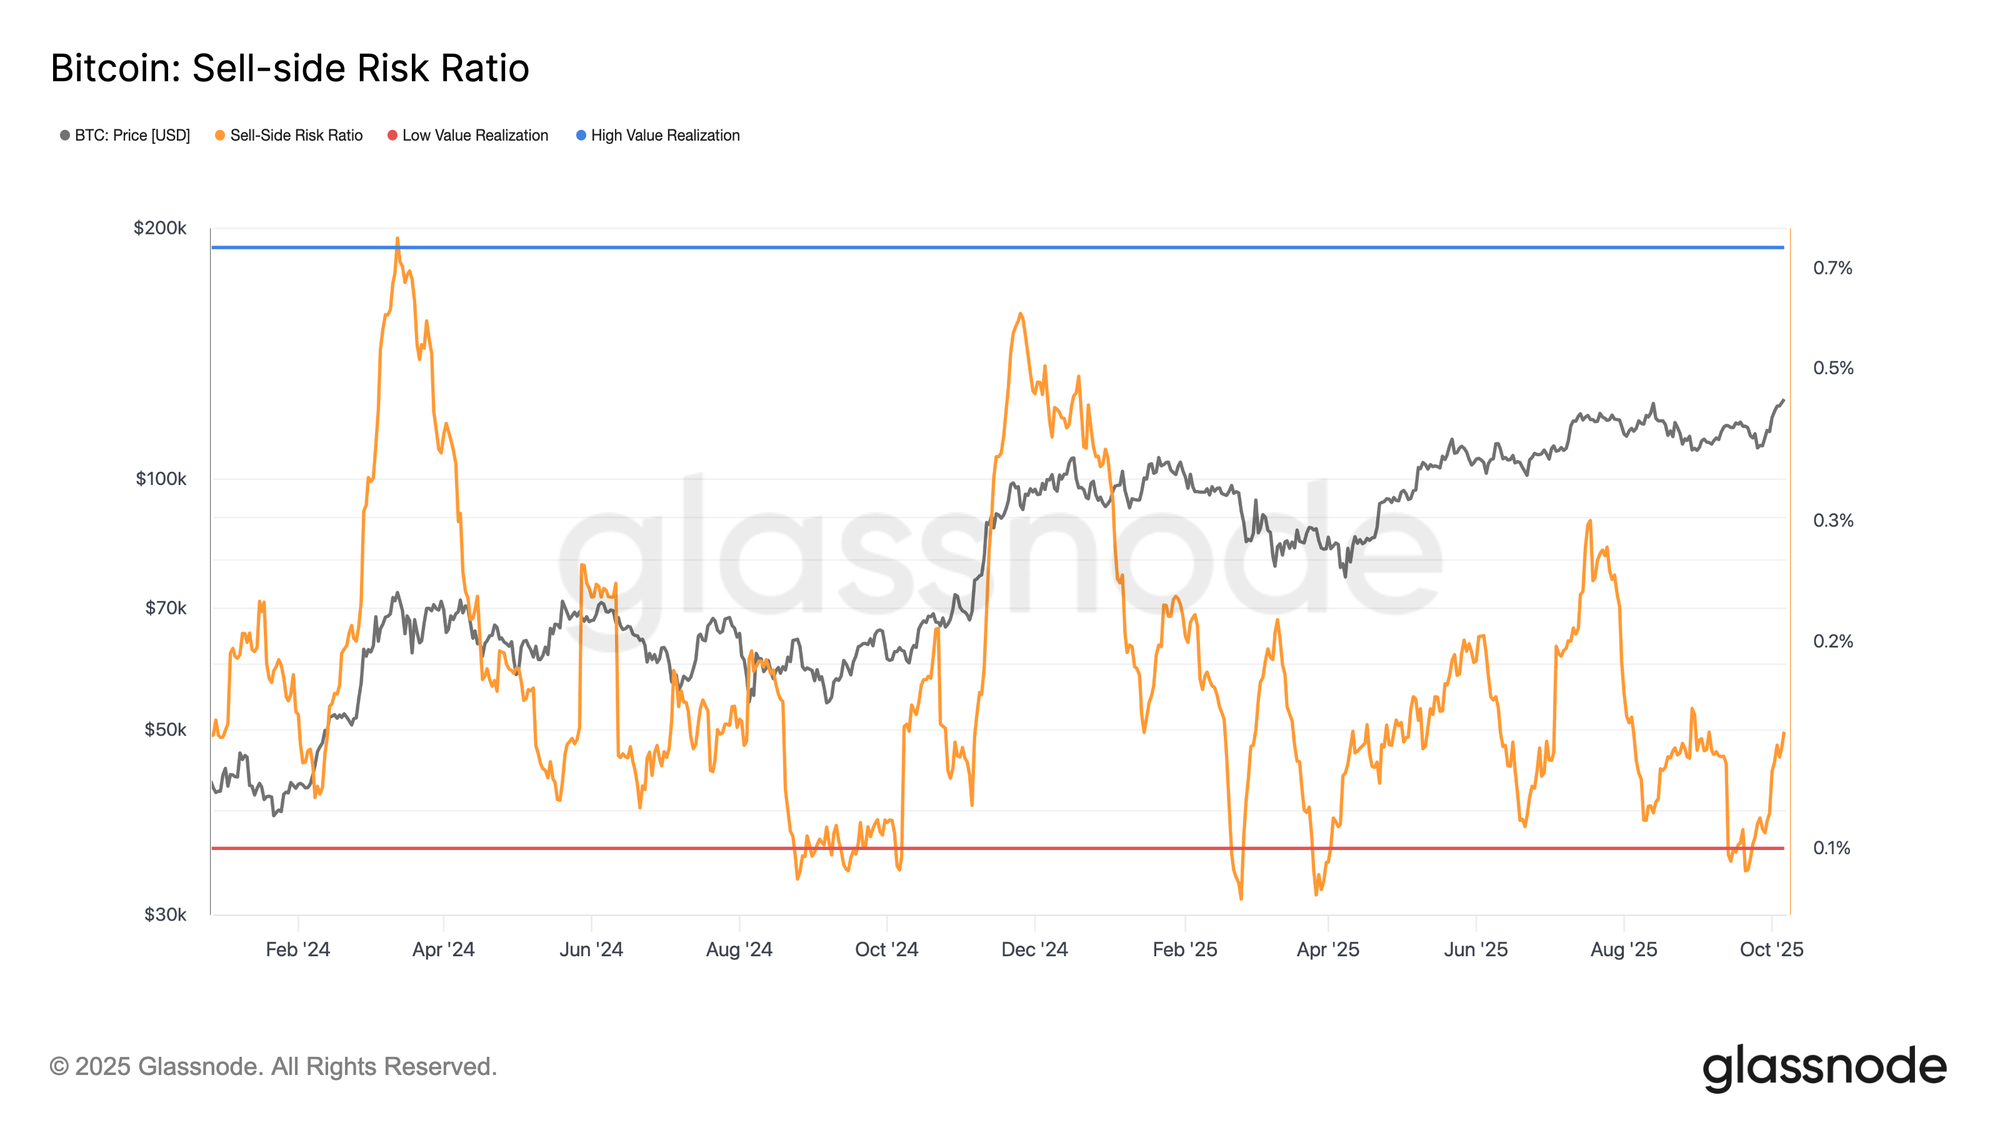
As Bitcoin enters a price discovery phase, assessing the degree of profit realization helps gauge whether the rally remains sustainable. The Sell-Side Risk Ratio, which measures the value of realized profits and losses relative to total realized value, serves as a proxy for investors’ willingness to spend their coins.

Recently, this ratio has rebounded from its lower bound, signalling a rise in profit-taking after a quiet period. Although still well below historical extremes tied to cycle tops, this uptick indicates that investors are locking in gains in a measured fashion. Overall, selling remains controlled and consistent with a healthy bullish phase, though continued monitoring is warranted as prices advance.

Live Chart

Spot and Futures Analysis

ETF Flows Drive Bitcoin to New Highs

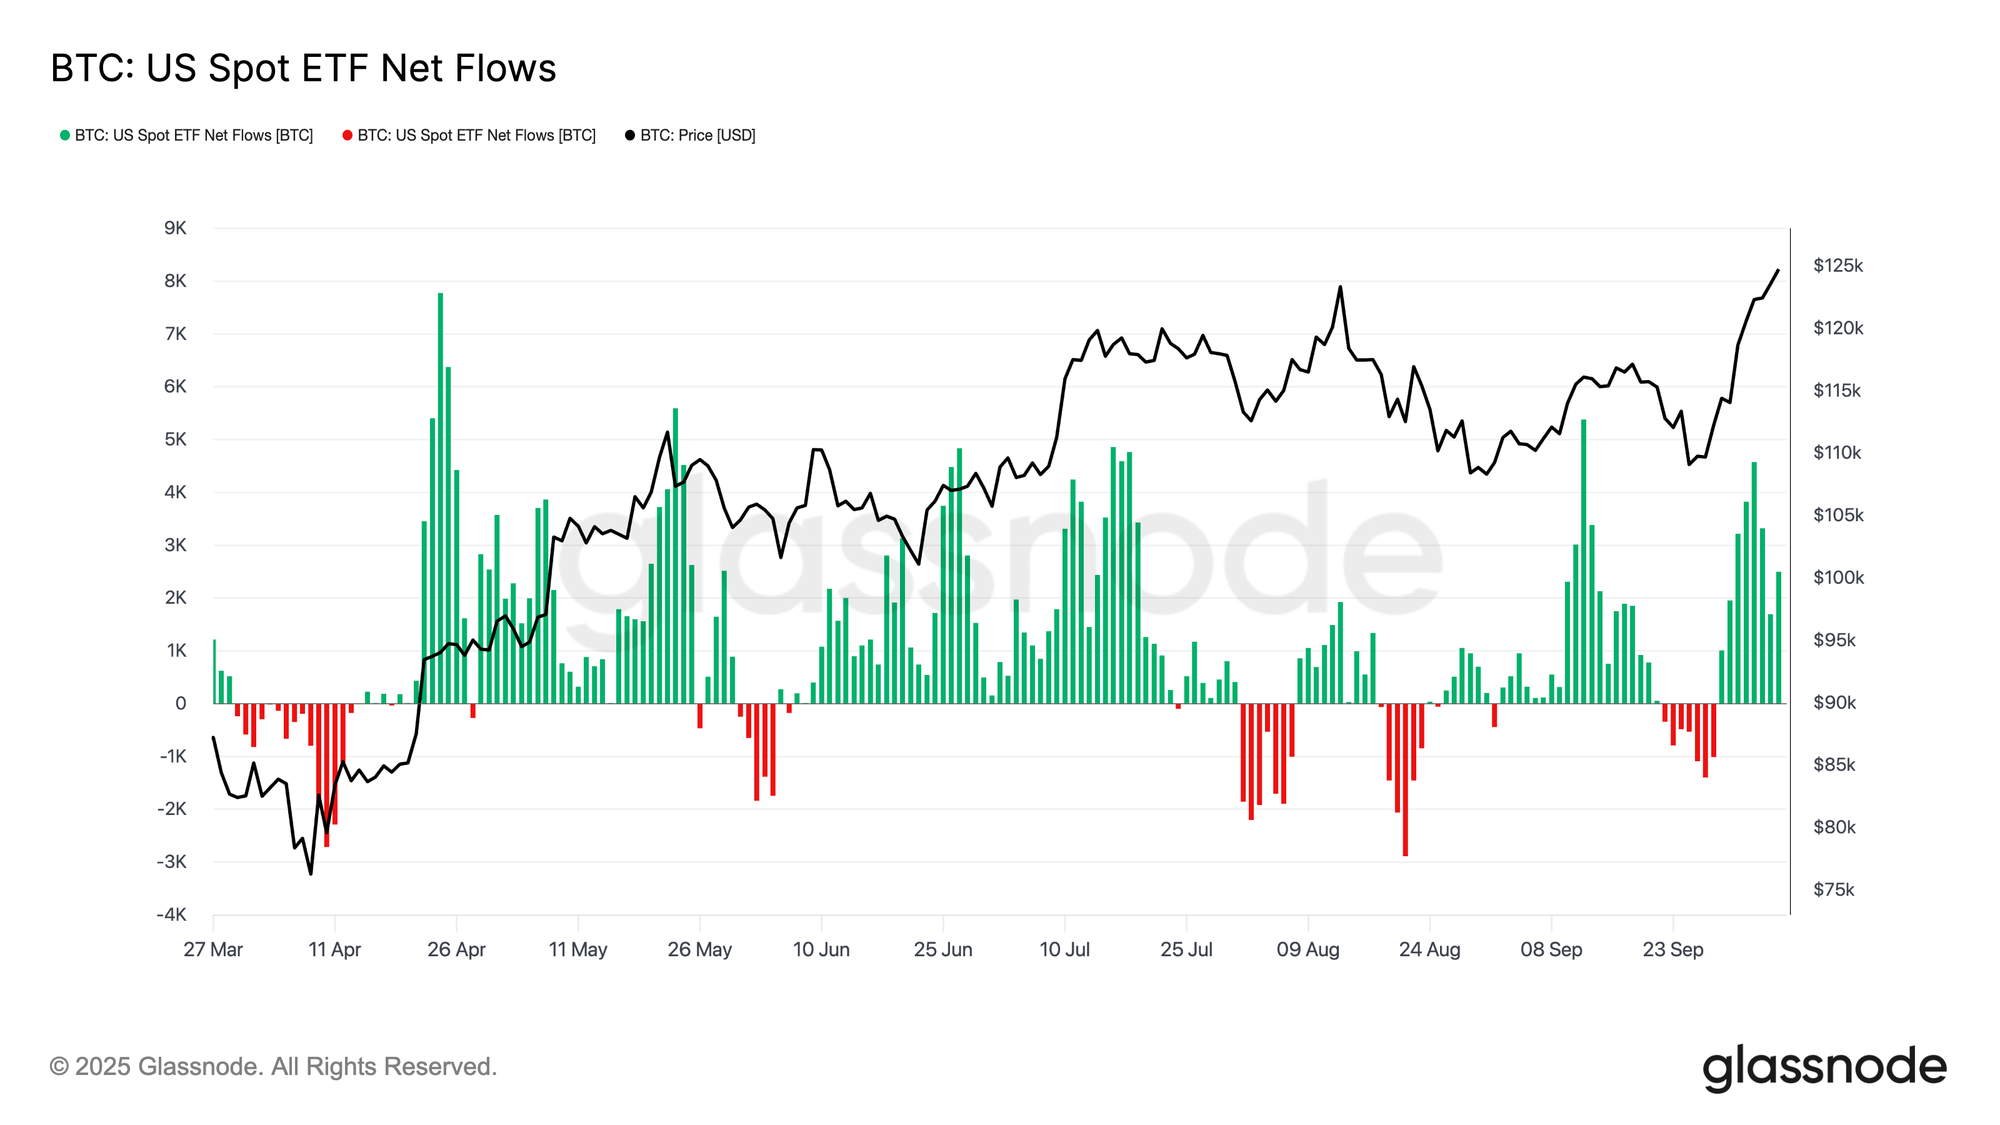
Shifting focus from on-chain dynamics to market demand, Bitcoin’s breakout to new all-time highs near $126k has been underpinned by a sharp resurgence in U.S. spot ETF Inflows.

Following September’s redemptions, more than $2.2B has poured back into ETFs within a single week, marking one of the strongest buying waves since April. This renewed institutional participation has absorbed available spot supply and strengthened overall market liquidity. Seasonally, Q4 has historically been Bitcoin’s strongest quarter, often coinciding with renewed risk appetite and portfolio rebalancing.

As broader markets tilt toward higher-beta assets such as crypto and small caps, sustained ETF inflows through October and November could provide a durable tailwind, anchoring confidence and supporting prices into year-end.

Live Chart

Spot Volume is Back

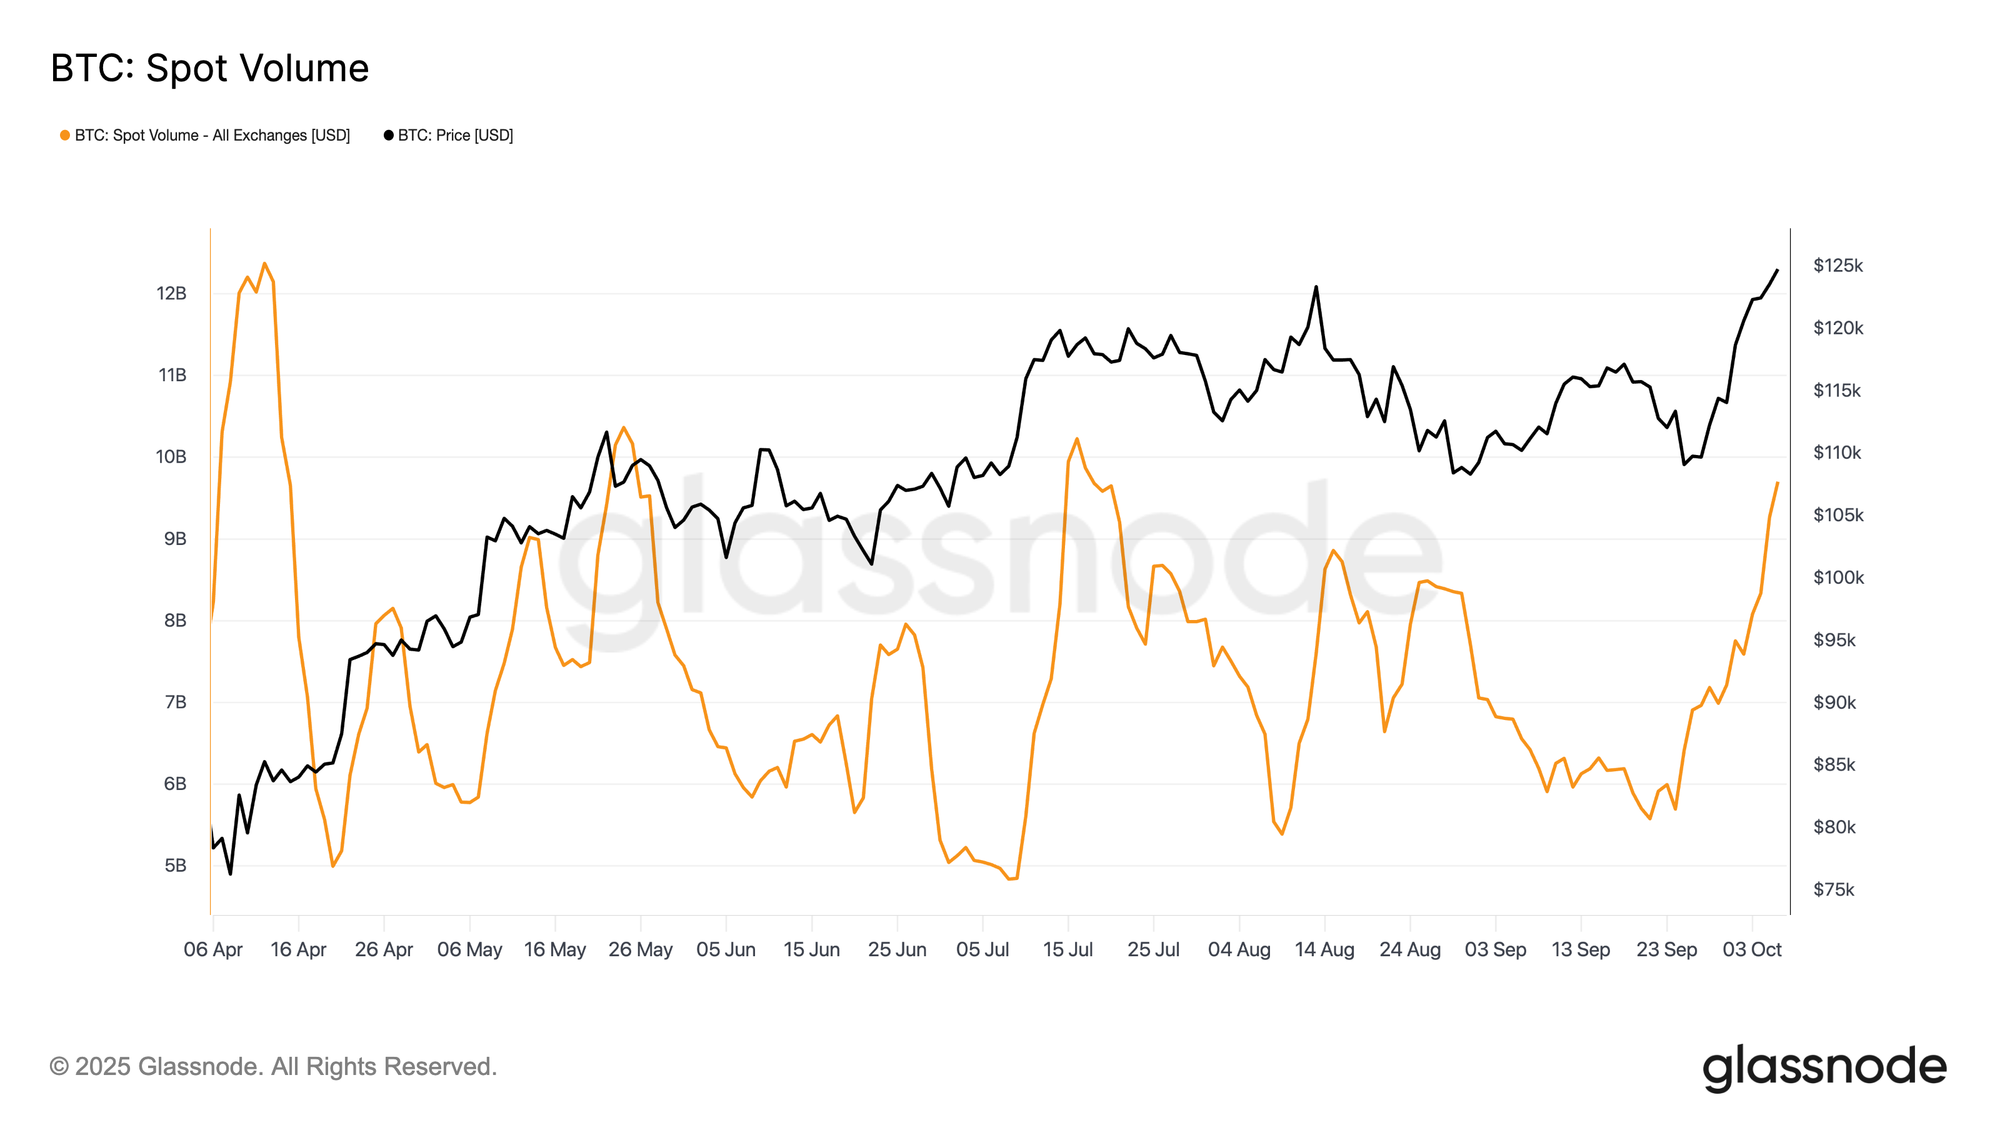
With ETF inflows reigniting demand, trading activity in the spot market has surged in tandem. Daily Spot Volume has climbed to its highest levels since April, confirming renewed market participation and deeper liquidity.

This uptick reflects growing confidence behind Bitcoin’s breakout to new highs. Sustained volume will be essential for validating the rally’s strength, as fading turnover after major advances has historically preceded short-term exhaustion and corrective phases.

Live Chart

Leverage Build Up

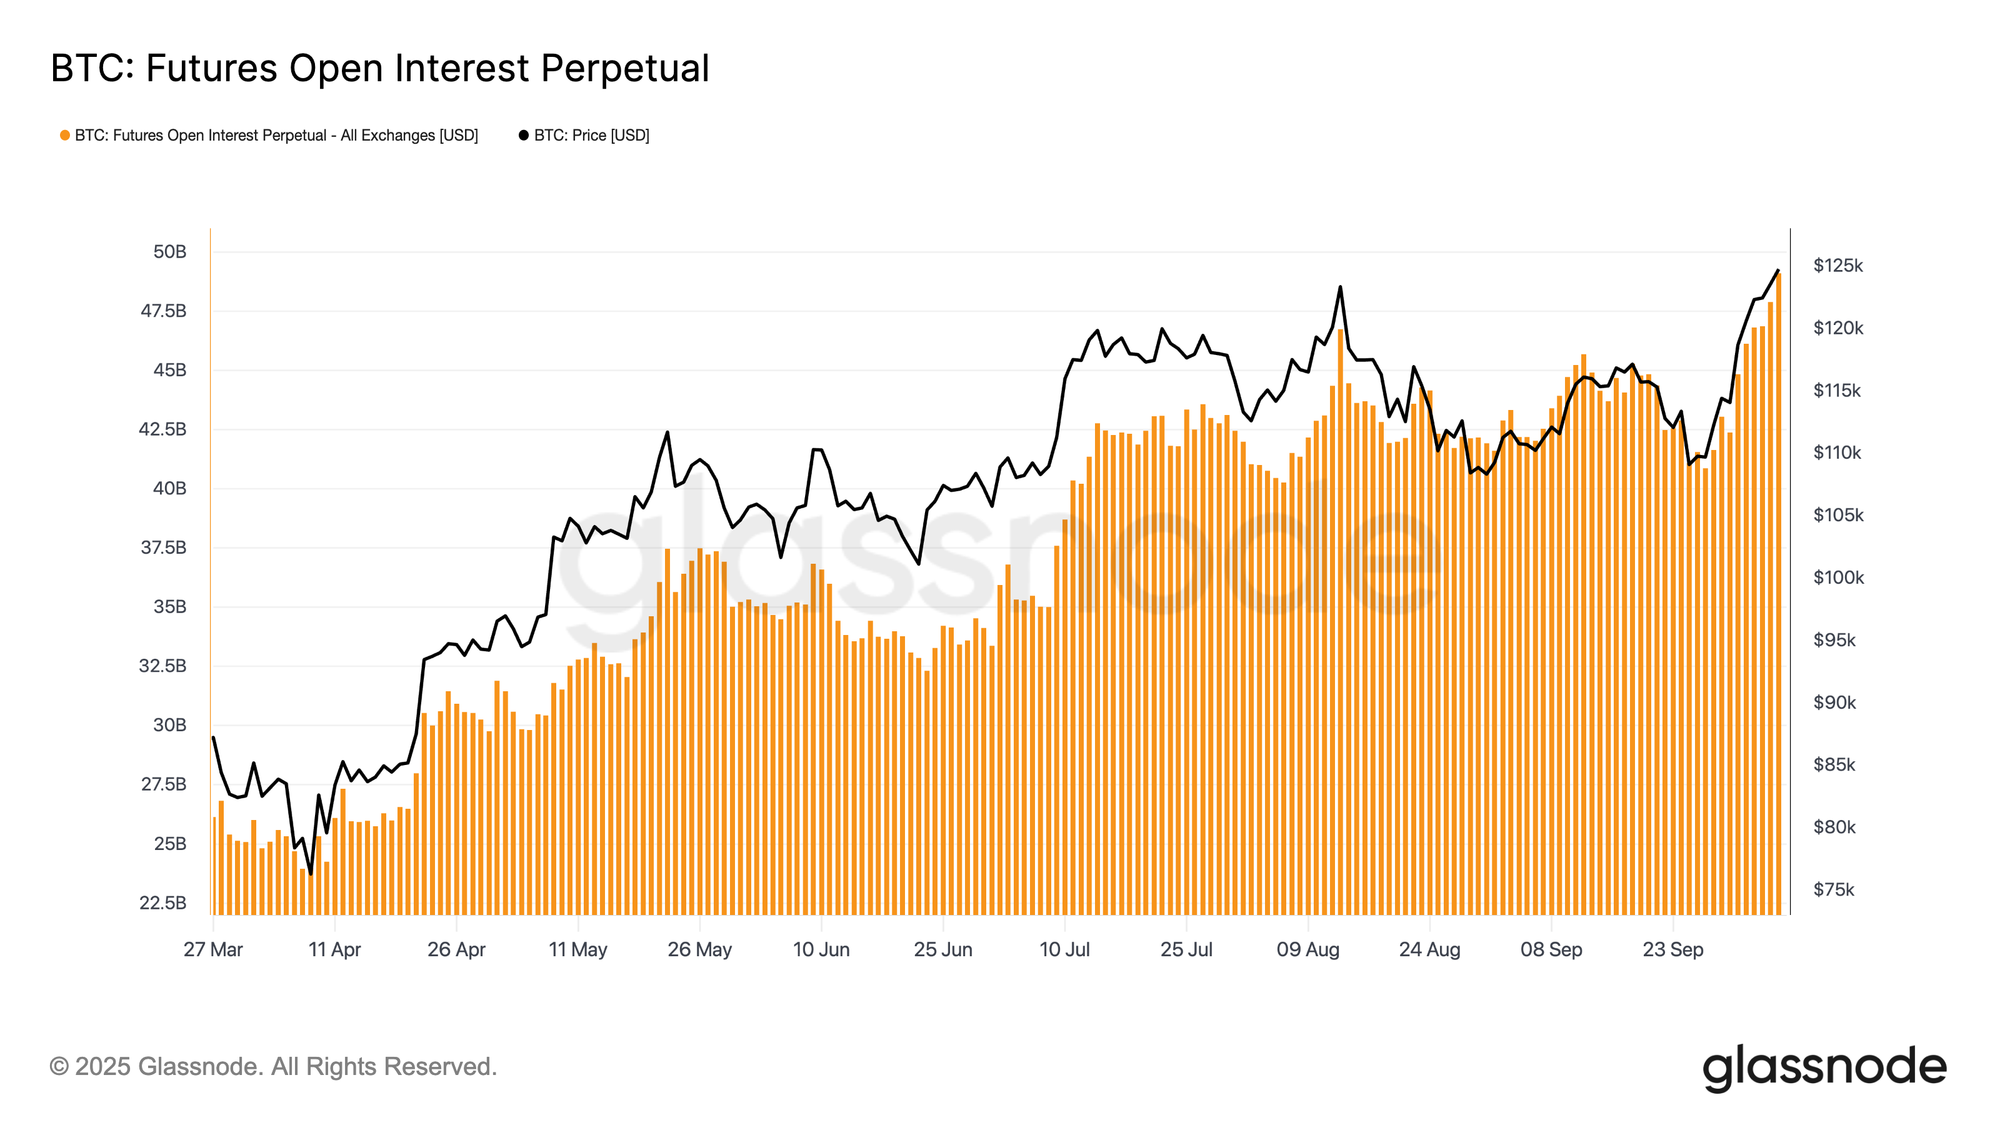
Following the surge in spot activity, the futures market has also heated up. Future Open Interest has risen sharply, setting new highs as Bitcoin broke above $120k. This expansion indicates a wave of leveraged long positions entering the market, a setup that often fuels short-term volatility. Periods of rapid OI growth typically resolve through liquidations or brief cooling phases, allowing excess leverage to unwind and positioning to reset before the next sustainable trend can form.

Live Chart

Funding Rates Heat Up

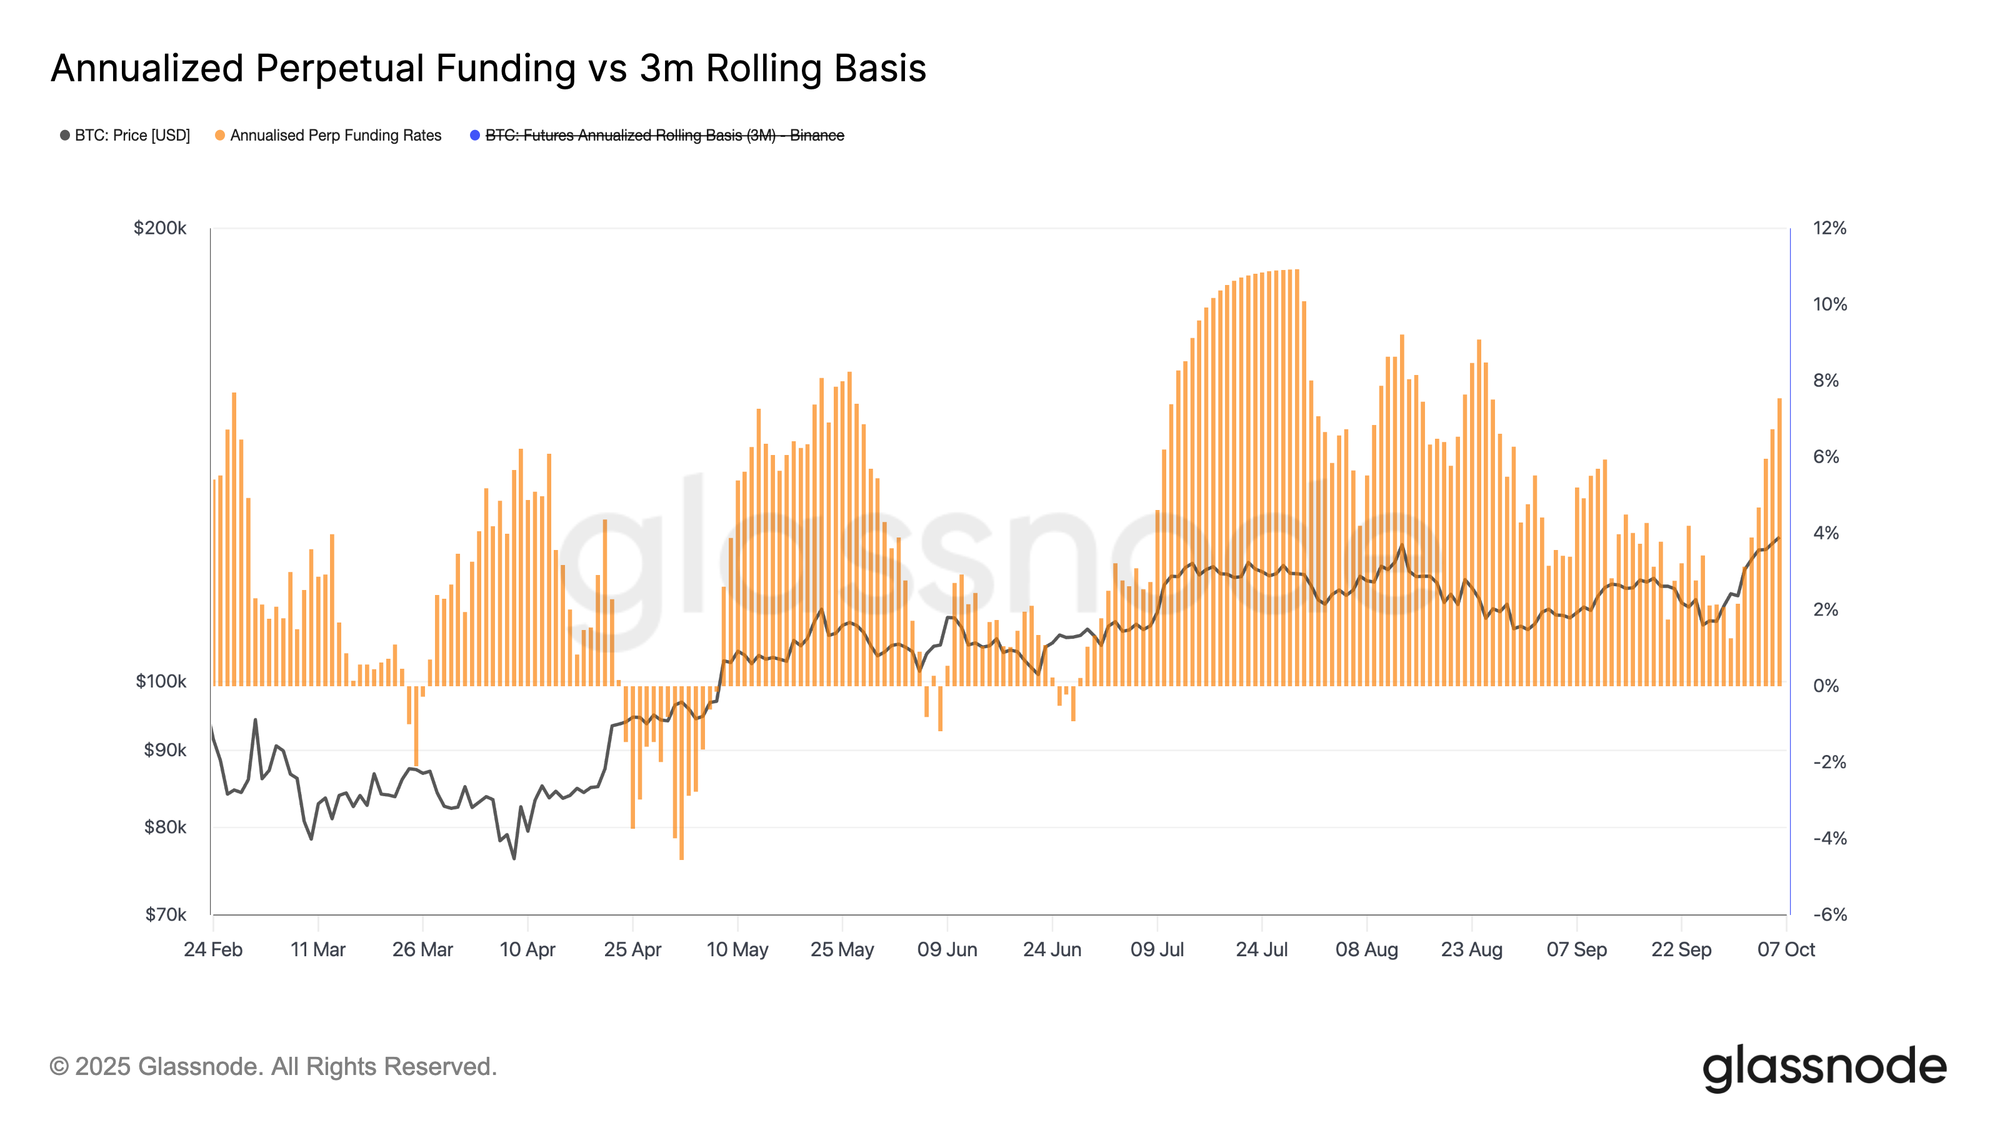
As futures open interest expands, Funding Rates have climbed in parallel with Bitcoin’s advance to new highs. Annualized funding now exceeds 8%, signalling elevated demand for leveraged long exposure and a rise in speculative activity.

Although not yet at overheated levels, sharp increases in funding often precede short-term cooling as leverage is flushed out. Historically, such phases result in brief pullbacks or profit-taking before the market can re-establish a more balanced structure.

Live Chart

Options Market Outlook

Uptober Bid Lifts the Curve

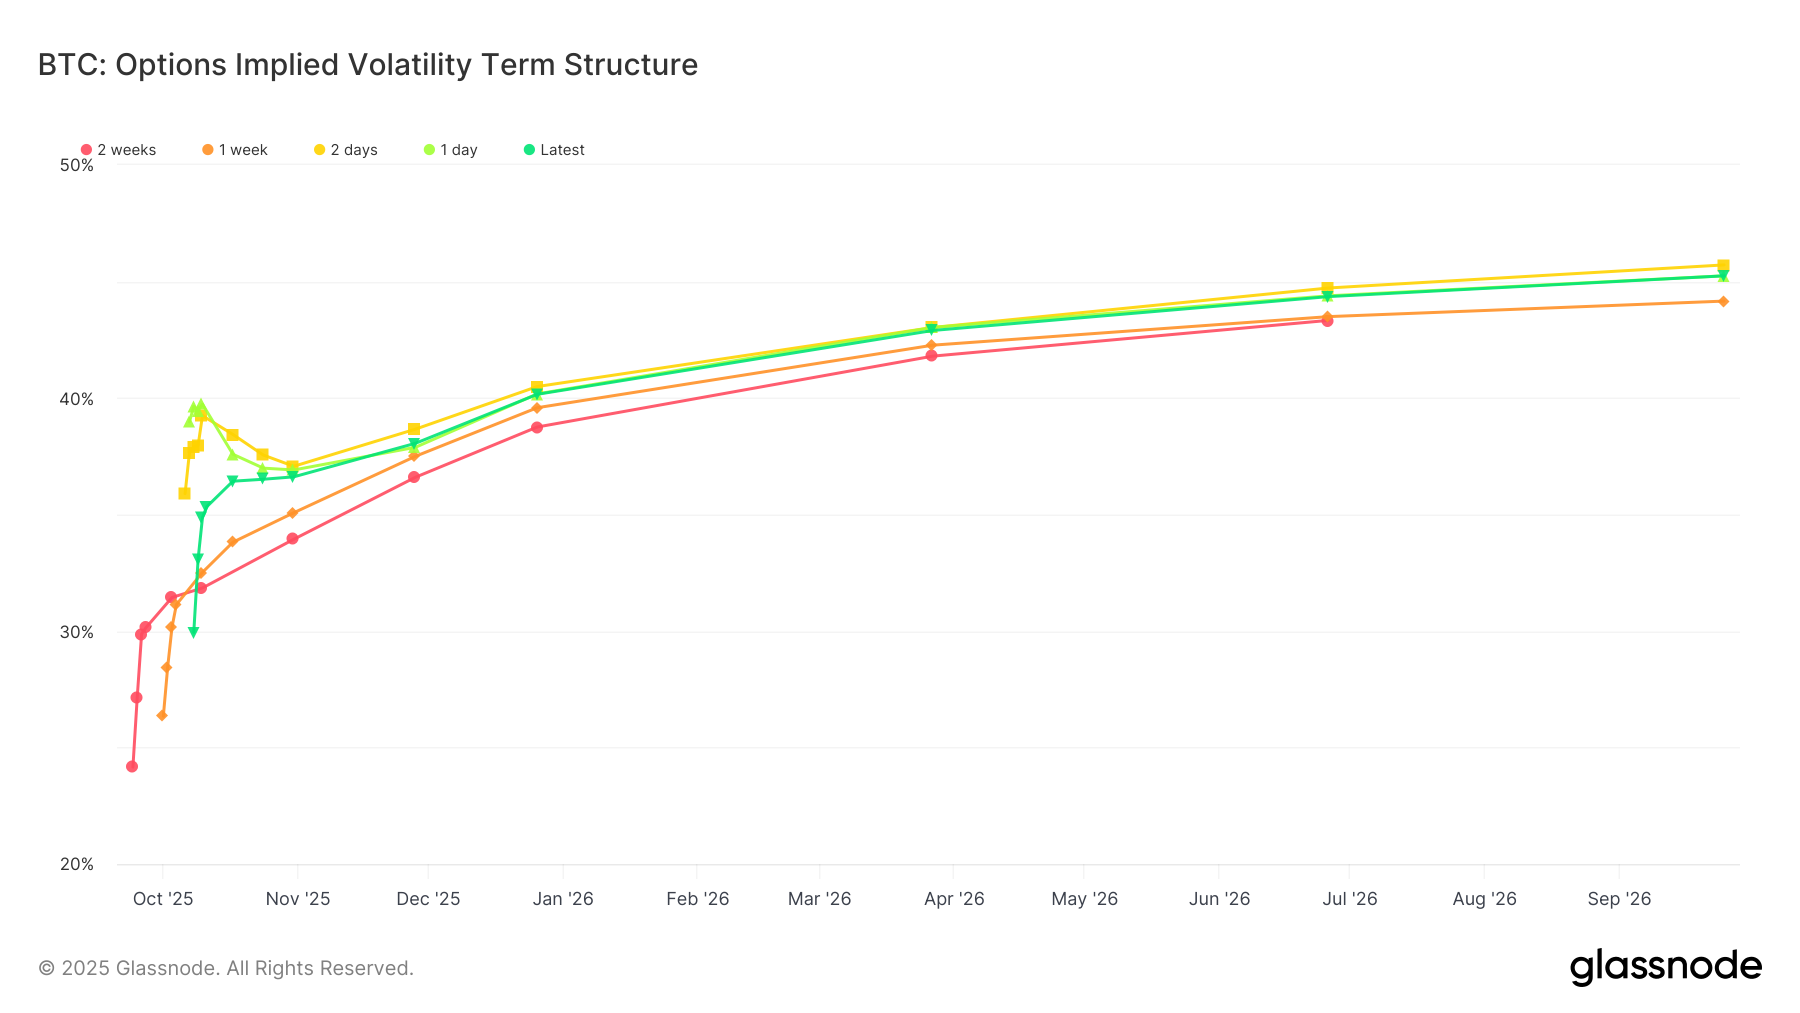
Turning to the options market, implied volatility has firmed as traders reposition into Q4. The entire Implied Volatility Term Structure has shifted higher over the past two weeks, reflecting growing optimism and renewed demand for optionality.

The October 31 expiry — a key date aligned with the “Uptober” narrative — has risen from 34 to 36 vols, while the back end has gained about one vol point. This upward shift signals not only short-term bullish sentiment but also confidence extending into 2026, suggesting longer-dated options are attracting renewed interest.

Live Chart

Short-Term Vol Squeeze

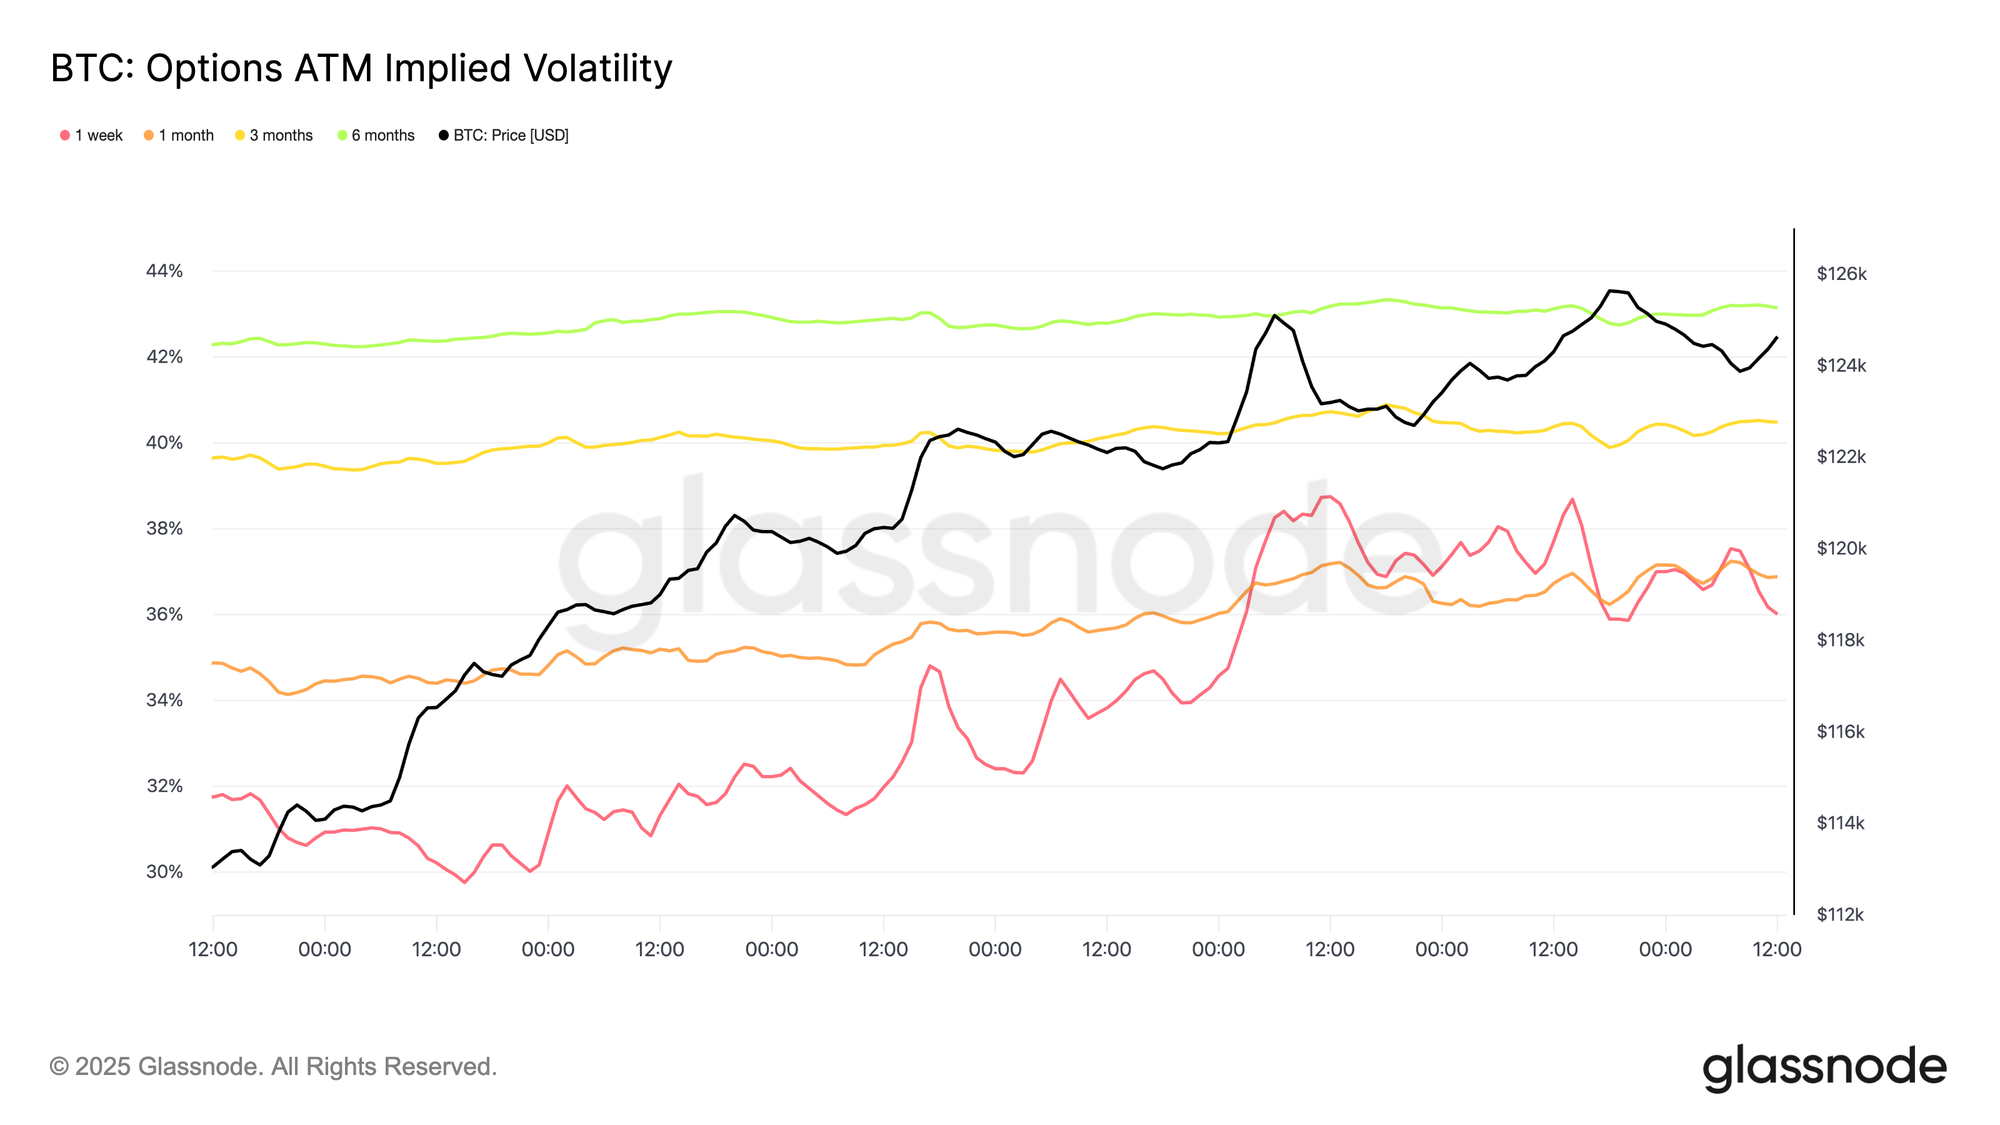
Alongside the broader lift in the term structure, At-The-Money Implied Volatility has risen across all maturities by about one volatility point. The exception is the one-week tenor, which spiked from 31.75% to 36.01%, marking a notable short-term surge.

This sharp move reflects traders adding gamma exposure while short-vol sellers were forced to cover and roll positions to higher strikes and longer expiries. The result was a classic volatility squeeze concentrated in near-term contracts, highlighting renewed sensitivity to short-dated price movements and elevated demand for tactical hedging.

Live Chart

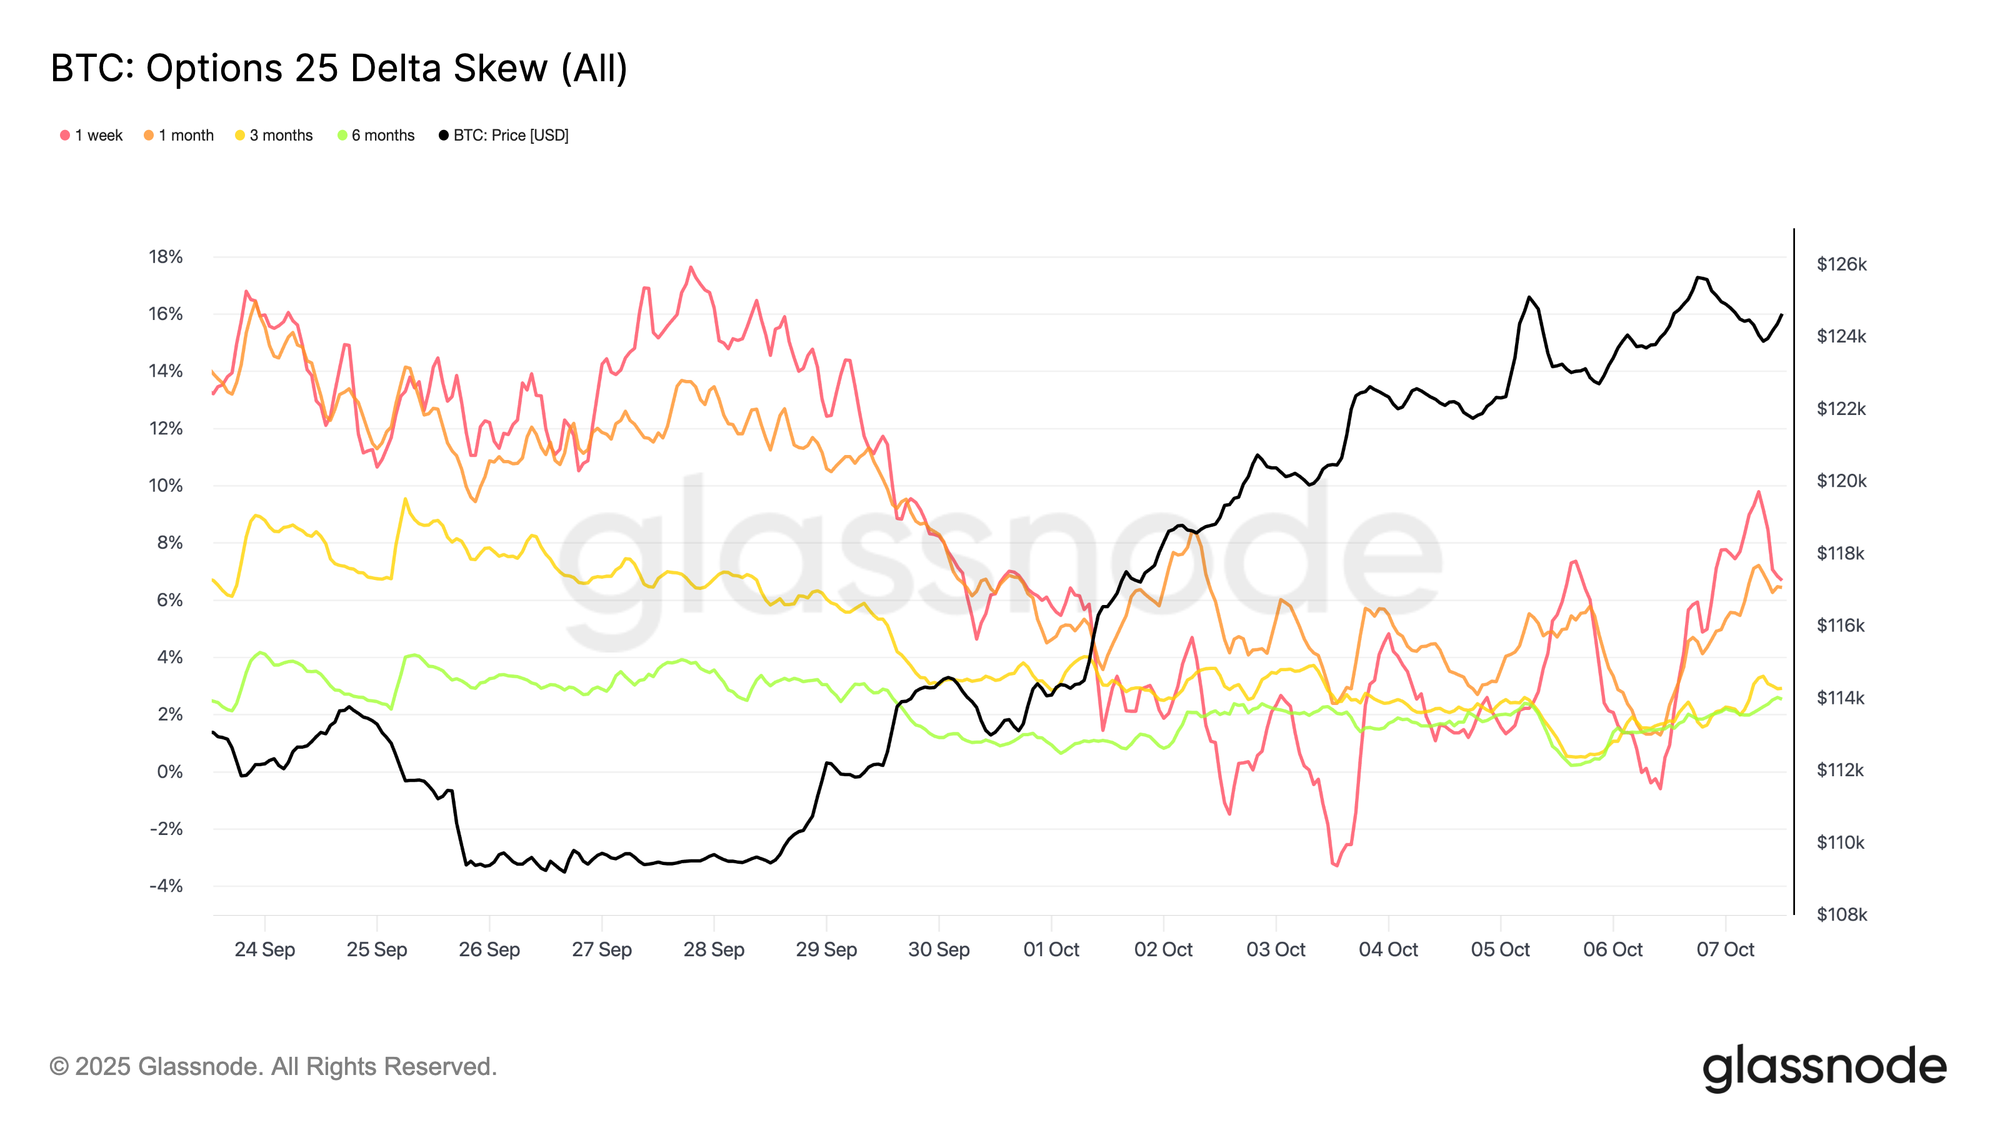
A Sharp Sentiment Reversal

The past two weeks have brought a pronounced shift in options sentiment, as evident in the rapid adjustment in skew. What began as a deeply bearish structure turned nearly neutral by Monday, before renewed hedge demand modestly tilted the balance back toward puts.

The near-term 25-Delta Skew narrowed from roughly 18 vol points put-rich to just 3 vol points by Friday, a remarkable 21-point swing in under a week. As noted previously, such extreme skews often precede reversals, and this time was no exception. Traders responded by bidding calls relative to puts, seeking upside exposure as Bitcoin’s breakout gained momentum, marking a clear rotation from defensive hedging to opportunistic positioning.

Live Chart

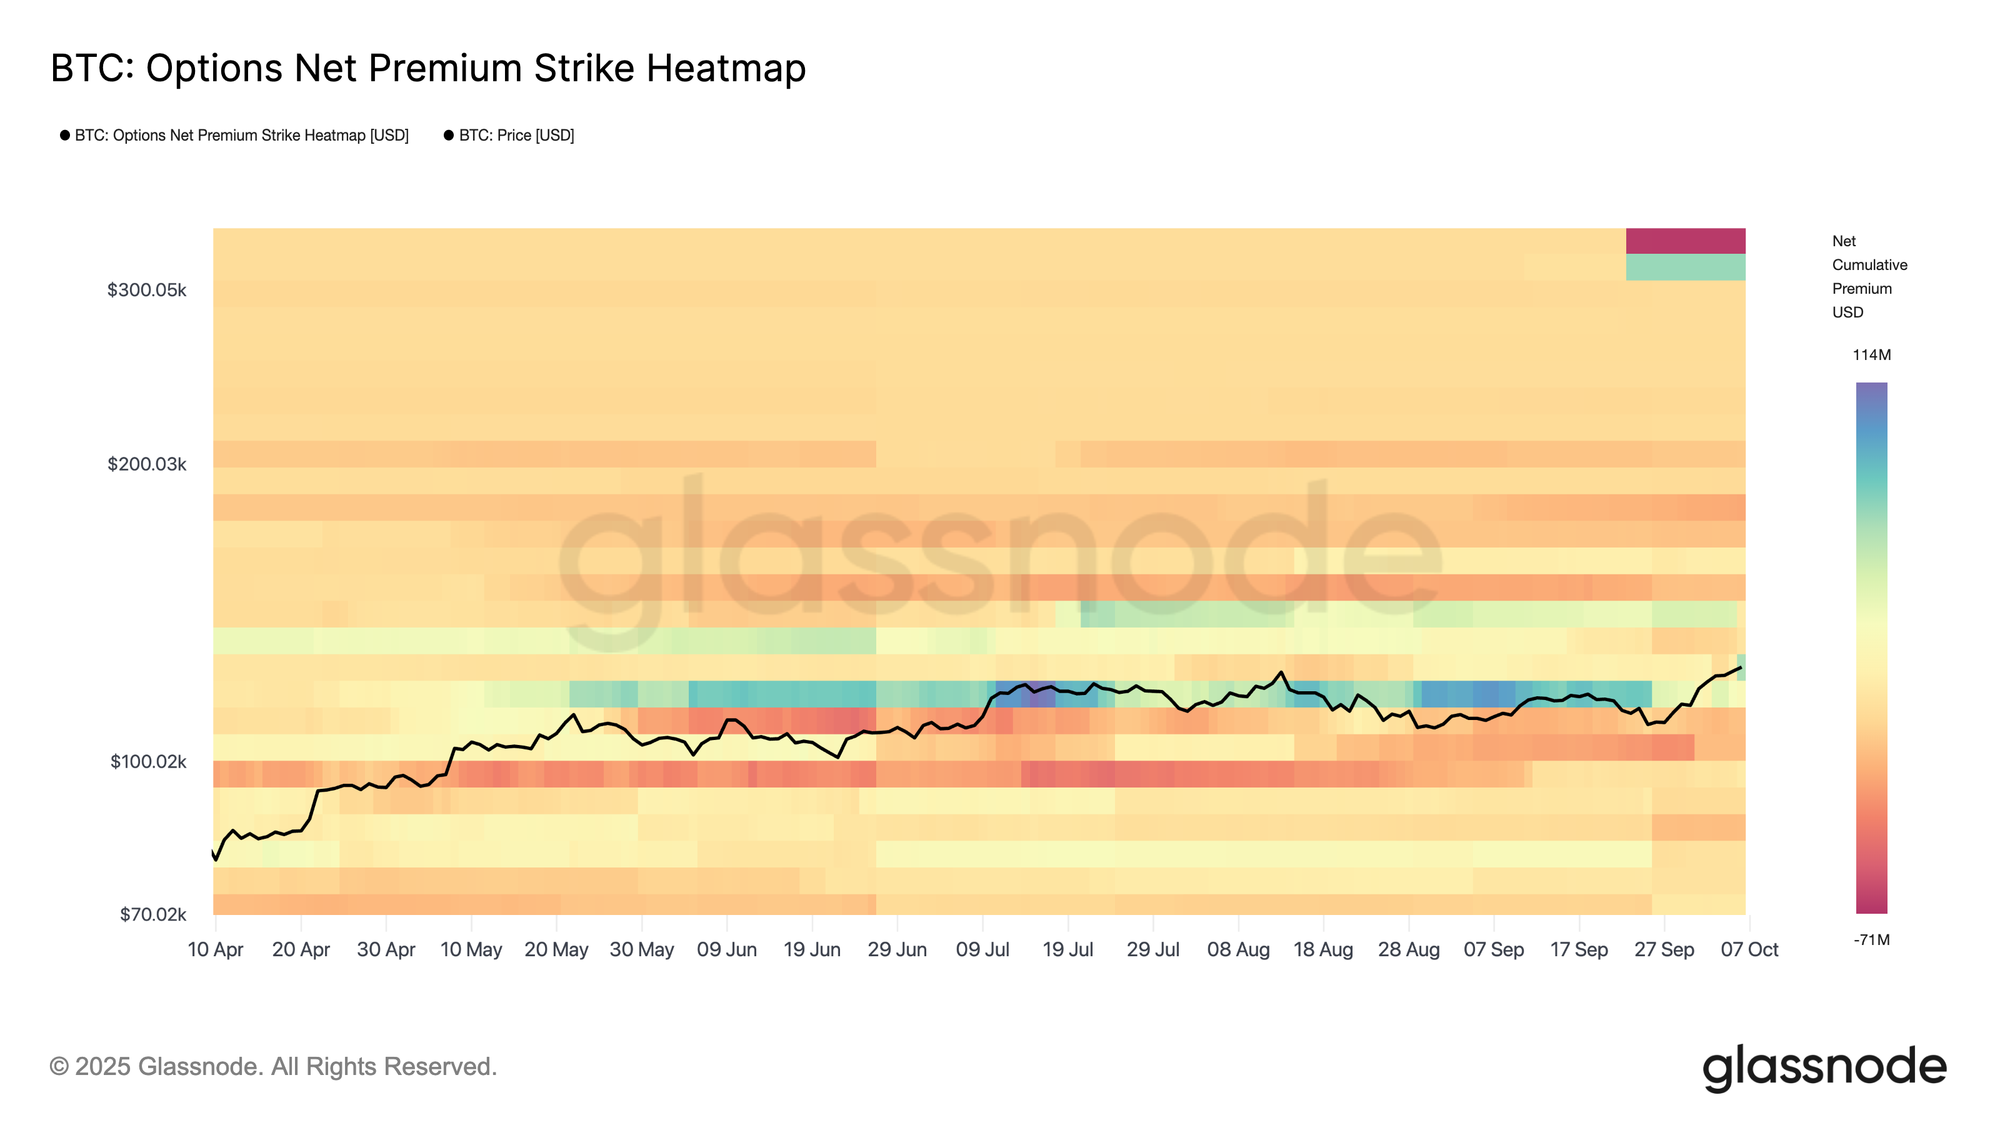
Flows Set the Stage for Volatility

Recent options flow data reveal an active tug-of-war near current price levels. Call activity dominates, yet both buyers and sellers are engaging at scale, reflecting a mix of strategies. Some participants are pursuing upside convexity through call spreads and ratios to manage costs, while others are writing covered calls to monetize volatility and cap gains on spot exposure.

Dealers remain largely long gamma around these strikes, particularly into the month-end expiry, positioning for elevated volatility. This structure suggests potential two-way pressure: long gamma traders may fade rallies to secure profits, while short gamma players could be forced to chase and hedge as prices extend. The result is a setup ripe for amplified swings as the market navigates uncharted territory

Live Chart

All in all, the options landscape reflects a more balanced yet increasingly active market. With skew now near neutral and implied volatility elevated, positioning for upside is no longer as inexpensive as it was a week ago. Many traders have already secured bullish exposure, driving call premiums higher and compressing risk-reward on fresh long-vol trades. While momentum remains strong and sentiment remains constructive, positioning has become more crowded, suggesting that near-term volatility could remain elevated as markets digest this renewed optimism.

Conclusion

Bitcoin’s breakout above the $114k–$117k supply cluster and new all-time high near $126k highlights renewed market strength supported by mid-tier accumulation and easing whale distribution. On-chain data point to key support between $117k and $120k, where nearly 190k BTC last changed hands, a zone likely to attract dip buyers if momentum cools.

In the spot and futures markets, ETF inflows exceeding $2.2B and surging volumes confirm strong institutional demand, although rising leverage and funding rates above 8% introduce short-term fragility.

Meanwhile, options markets show higher implied volatility, neutral skew, and call-heavy positioning, signalling constructive sentiment but a more crowded landscape.

Together, these signals outline a robust yet maturing uptrend, one that remains supported but increasingly sensitive to profit-taking and leverage resets as Bitcoin navigates price discovery.

İlgili Okumalar

Bitcoin's Weak Rebound Fails to Conceal Adjustment Trend; HYPE's Top Signals Warn of Short-Term Risks | Guest Analysis

Bitcoin's Weak Bounce Fails to Mask Correction Trend; HYPE Top Signals Warn of Short-Term Risks | Invited Analysis Core Weekly View: Bitcoin's daily chart structure has weakened. The key question is whether its short-term rebound can effectively break above the upper boundary of the descending channel. Has HYPE's seven-wave advance reached its conclusion? This analysis systematically examines the current market structure across multiple timeframes and outlines operational strategies for the week. **Bitcoin (BTC) Analysis:** The daily chart shows BTC trading within a long-term rising channel (yellow) since February but has recently broken below its midline, indicating structural weakness. It is currently confined within a short-term descending channel (blue) originating from the May 6 high. The ongoing bounce appears to be a weak technical correction targeting the blue channel's upper rail (approx. $75,000-$76,000). The 4-hour chart reveals a complex 10-segment corrective structure from the May high, containing two downward pivot zones (Central D and E). The current rebound (segment 36-37) is expected to face resistance in the $75,000-$76,000 area. A failure to break above could lead to a resumption of the downtrend, testing support at $69,500-$70,500 and potentially $65,000. **BTC Weekly Strategy:** The price is currently below the "Bull-Bear Channel," placing it in a technically weak zone. The core focus is on the test of the $75,000-$76,000 resistance and $69,500-$70,500 support. * *Medium-term*: Consider initiating short positions (up to 30% allocation) if the price rejects the $75,000-$76,000 area. Increase exposure to 60% if the long-term rising channel's lower support fails. * *Short-term (30% allocation)*: Two scenarios are outlined: * *Plan A (Sell on Rally)*: Short on rejection at $75,000-$76,000, with a stop-loss above $77,000. * *Plan B (Breakdown Sell)*: Short on a confirmed breakdown below $69,500-$70,500, with a stop-loss above $72,000. **HYPE Analysis:** The 4-hour chart shows HYPE has completed a seven-wave advance from its May 14 low, including a central consolidation zone. A bearish divergence was noted at the prior high (point 45), leading to a 13% correction. The current rally leg (46-47) shows weakening momentum compared to the initial leg (42-43), suggesting a potential momentum divergence. Furthermore, the proprietary "Spread Trading Model" has triggered a strong top warning signal at point 47. A confirmed top here, combined with the momentum divergence, could signal the end of the current uptrend. **HYPE Weekly Strategy:** The core is observing whether a confirmed top at point 47 coincides with the momentum divergence. * Monitor the key support zone of $62.5-$64.75. A hold and bounce from this area, supported by model buy signals, could allow for a light long position (<30% allocation). * A decisive break below this support would indicate a shift to a larger-degree correction, targeting the $54-$56.3 area. **Trade Review:** A previous short trade on BTC was executed at $77,449 based on model top signals (bearish candlestick pattern, spread model warning, momentum divergence) and closed at $73,519 for a 5.07% profit. **Risk Management Reminder:** Always set an initial stop-loss immediately upon entry. Move the stop-loss to breakeven once a 1% profit is achieved, and trail it upwards to lock in profits as the trade progresses. *Disclaimer: Market conditions change rapidly. All views, models, and strategies are for educational purposes and personal trading logs only, not investment advice. Trading carries significant risk.*

Odaily星球日报Şimdi

Bitcoin's Weak Rebound Fails to Conceal Adjustment Trend; HYPE's Top Signals Warn of Short-Term Risks | Guest Analysis

Odaily星球日报Şimdi

How to Define "Real U.S. Stocks": Differences Between On-Chain Tokens, Price Contracts, and Direct Broker Connections

**Title:** Defining "Real US Stocks": Differences Among On-Chain Tokens, Price Contracts, and Broker-Direct Access **Summary:** In 2026, using stablecoins to purchase US stocks is mainstream, but products marketed as "buying US stocks with USDT" offer fundamentally different assets. This article analyzes three primary models. **1. Tokenized Stocks:** These are on-chain tokens representing economic exposure to underlying stocks, held by an issuer or custodian. They offer benefits like 24/7 trading and DeFi composability (e.g., use as loan collateral). However, users lack direct legal shareholder status; dividends may not be paid in cash, and voting rights are typically non-binding advisory expressions. Examples include platforms like Ondo Finance. **2. Stock Futures / Equity Perpetuals:** These are derivative contracts tracking a stock's price, allowing leveraged long/short positions 24/7, similar to crypto perpetuals. They offer high efficiency and flexibility but involve funding fees, which can be a significant long-term cost, especially during strong trends. Crucially, they confer no ownership rights (dividends, voting) to the holder. **3. Broker-Direct Model:** This model provides access to real securities via licensed broker-dealers. Stocks/ETFs are bought and held within the US clearing and custodial system (e.g., DTCC), making it the only path to genuine stock ownership. Users receive cash dividends and formal proxy voting rights (where applicable). It supports thousands of stocks and ETFs, far exceeding the coverage of the other two models. Key advantages include no funding fees, a clean cost structure for long-term holds, and the potential to transfer holdings to other brokers. Some platforms facilitate stablecoin (USDT/USDC) deposits, reducing reliance on traditional banking. A critical distinction exists *within* the broker-direct model: the underlying brokerage architecture (e.g., Fully Disclosed IB, Omnibus IB, Self-Clearing) determines how client assets are held, protected, and how safeguards like SIPC insurance are conveyed. Users should verify the specific clearing structure and regulatory compliance of any platform. In conclusion, "buying US stocks with USDT" can mean holding an on-chain economic proxy (Tokenized Stocks), trading a price derivative (Stock Futures), or owning the actual security (Broker-Direct). For users seeking full ownership rights and long-term investment, the broker-direct model is the definitive choice, though its implementation details require careful scrutiny.

marsbit1 saat önce

How to Define "Real U.S. Stocks": Differences Between On-Chain Tokens, Price Contracts, and Direct Broker Connections

marsbit1 saat önce

NVIDIA Launches DSX Platform, Expanding into AI Factory Infrastructure

NVIDIA has unveiled the DSX platform at its GTC Taipei event, marking a strategic expansion from GPU sales into comprehensive AI factory infrastructure solutions. The platform addresses challenges like power supply, cooling, and resource orchestration as AI models scale, shifting the industry focus from single-chip performance to overall infrastructure efficiency. DSX integrates NVIDIA's chips, systems, software, and partner technologies to cover the entire AI factory lifecycle—from design and simulation to deployment and operations. It aims to accelerate deployment, improve reliability and operational efficiency, and reduce the cost per generated token in AI inference. The software suite includes DSX MaxLPS, which uses 45°C liquid cooling and rack-level optimization to allow up to 40% more GPUs per megawatt, and DSX OS, an open-source platform for AI factory operations. The platform also encompasses reference designs, digital twin simulation (DSX Sim), dynamic workload adjustment based on grid conditions (DSX Flex), and data exchange between systems. Early adopters include cloud providers like CoreWeave and Lambda. Major hardware partners, including Dell, HPE, Lenovo, and Supermicro, are developing DSX-ready systems. Pilot projects for DSX Flex are underway with energy providers. Strategically, DSX represents NVIDIA's ongoing transition from an AI chip supplier to a full-stack AI infrastructure platform provider, aiming to set industry standards and solidify its market leadership.

marsbit1 saat önce

NVIDIA Launches DSX Platform, Expanding into AI Factory Infrastructure

marsbit1 saat önce

After Burning Tens of Billions of Dollars in Tokens, Silicon Valley Giants Start Limiting Employee Token Usage

After burning tens of billions of dollars on AI tokens, major Silicon Valley firms are now restricting employee usage. Companies like Microsoft, Uber, and Salesforce, which heavily promoted AI for "efficiency," are facing a cost crisis. The practice of "tokenmaxxing"—pushing employees to maximize AI tool usage—led to wasteful spending on trivial tasks like checking the weather or writing birthday messages, with studies showing significant hidden costs for bug fixes and code rewrites. The core issue is a misalignment between individual productivity gains and actual business value. While employees use AI to automate tasks they dislike, such as writing reports, this often doesn't translate to increased company revenue or improved core business outcomes. For instance, AI-generated code speeds up development but also sees an 800% increase in "code churn" (code being discarded or rewritten). As a result, only 14% of CFOs report seeing a clear, measurable return on AI investments. Firms are now shifting strategies. Microsoft has revoked most internal licenses for Claude Code, while others are implementing monitoring and cost controls. New tools from companies like Harness and CloudZero aim to track AI spending and tie costs to business results. Some AI vendors, like HubSpot, are moving from token-based pricing to charging based on outcomes, such as "resolved conversations" or "leads generated." This represents a necessary correction in the AI adoption cycle. The challenge now is for companies to move beyond using AI merely to speed up old tasks and instead rethink their workflows and business models fundamentally. The future of enterprise AI depends on proving its value, not just its usage.

marsbit1 saat önce

After Burning Tens of Billions of Dollars in Tokens, Silicon Valley Giants Start Limiting Employee Token Usage

marsbit1 saat önce

İşlemler

Spot
Futures
活动图片