Ethereum went through weeks of bearishness after which the king of altcoins pushed above the $1000 mark. Over the last 24 hours, it soared close to 9% but in the past week, the coin registered a double-digit loss of 22%.
The coin even moved below the $900 mark but as buying strength slowly recovered, ETH moved upwards on the chart. It cannot be said for certain if Ethereum will continue to move northwards because technical outlook still remains quite dicey.
Bears are still in control of the market and if the coin fall from the $100 mark, the next trading zone lies between $700-$900. Buyers could then enter the market again and reclaim the price of the asset. Buyers can again enter the market if ETH plunges to the aforementioned trading zone. ETH has been completely bearish for over ten weeks now.
Ethereum Price Analysis: Four Hour Chart
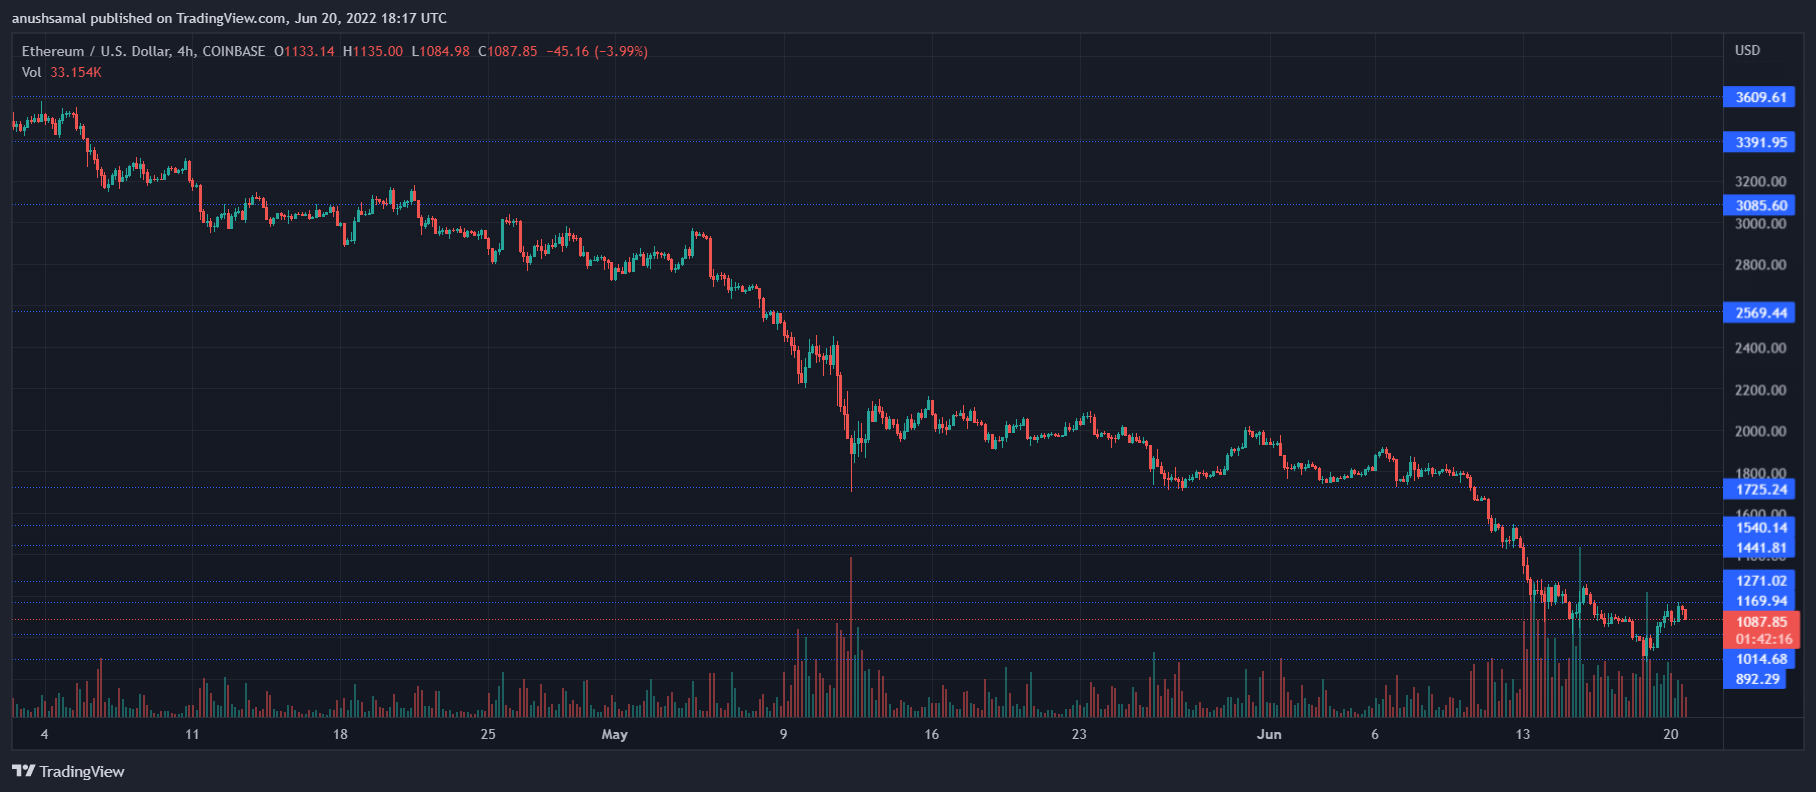
Ethereum was trading at $1090 on the one day chart | Source: ETHUSD on TradingView
ETH rose on its chart after touching the lows of $900 at the time of writing. The asset was priced at $1090 on the four hour chart. Overhead resistance for the coin stood at $1200. Another blow from the sellers will cause the price to fall close to the $800-$900 mark.
On the four-hour chart, Ethereum again dipped slightly suggesting bearish influence in the market. Volume of the asset had fallen which meant that less of buying. The red volume bar again pointed towards bearish price action.
Technical Analysis
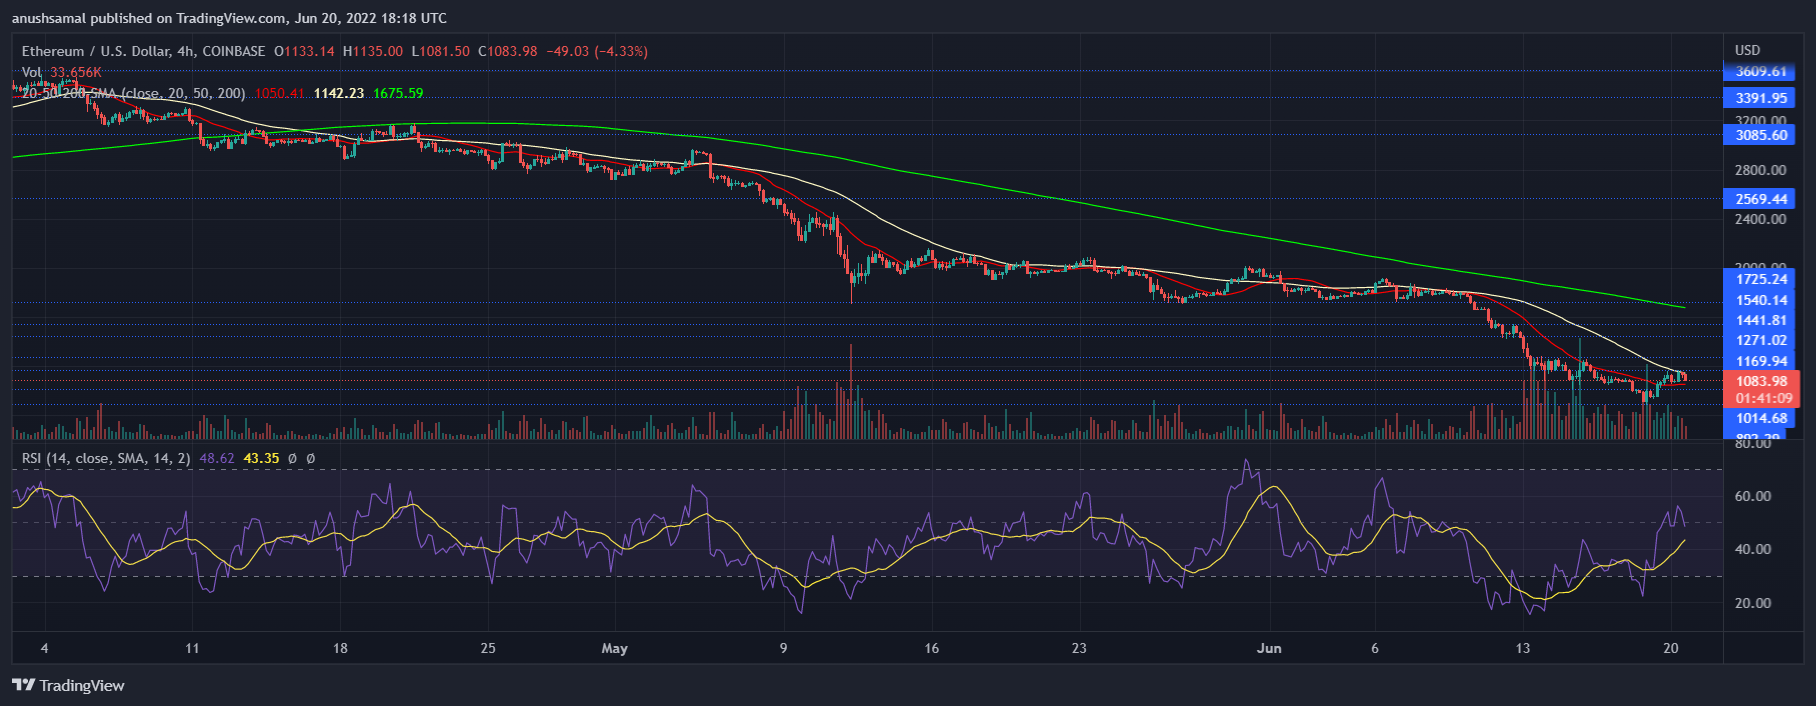
Ethereum displayed relief in buying strength on the four hour chart | Source: ETHUSD on TradingView
With ETH spiking on the chart, the buying strength also increased in the market. On the four-hour chart, the coin displayed a downtick in buying strength noting that further fall in price could occur. The Relative Strength Index was near the 50-mark, after noting a downtick.
RSI was still positive which meant buying strength overthrew selling strength. As buying strength showed up, corresponding to the same, ETH’s price climbed above the 20-SMA line. Price above 20-SMA meant that buyers were in charge of driving the price momentum.
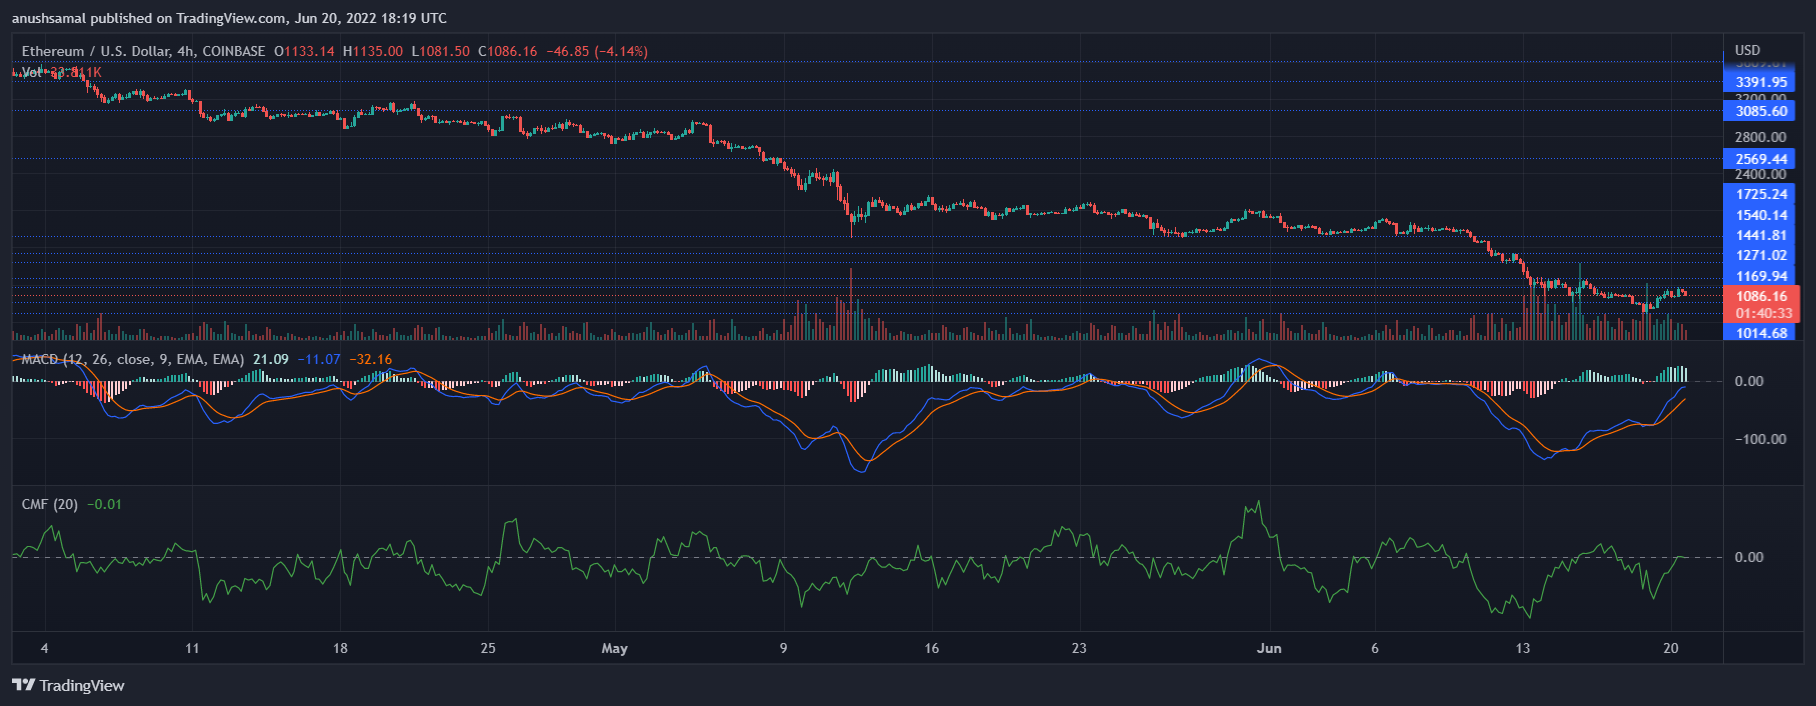
Ethereum displayed buy signal on the four hour chart | Source: ETHUSD on TradingView
A brief relief rally caused buyers to start coming back into the market. The Moving Average Convergence Divergence which depicts the price direction and change in the same painted signs of bullishness. MACD experienced a bullish crossover and flashed green signal bars which are construed as buy signal for the coin.
If buyers continue to dominate ETH could soon target its immediate price resistance mark. Chaikin Money Flow also depicted recovery on the chart. The indicator portrays the status of capital outflows and inflows. At press time, CMF was parked on the half-line representing equal amount of capital inflows and outflows for ETH.