27-Year Reign Ends: SK Hynix Market Cap Surpasses Samsung for First Time, an AI-Driven Reshuffle of Korean Chip Power

marsbitPublished on 2026-06-22Last updated on 2026-06-22

Abstract

On June 22, 2026, SK Hynix made history by surpassing Samsung Electronics in market capitalization, ending Samsung's 27-year reign as South Korea's most valuable company. This dramatic reversal is powered by the AI boom and SK Hynix's dominant position in High Bandwidth Memory (HBM), a critical component for AI model training. Once a heavily indebted firm on the brink of bankruptcy, SK Hynix bet early on HBM, which has evolved from a niche product to essential AI infrastructure. It now commands a 59% share of the global HBM market. Its financial performance is staggering, with Q1 2026 net profit soaring nearly fourfold year-over-year to KRW 40.35 trillion, translating to over 2 billion RMB in daily net profit. HBM now drives roughly 40% of its revenue with exceptionally high margins. In contrast, Samsung, with its broad portfolio spanning memory chips, smartphones, and foundry services, has lagged in the HBM race while facing headwinds in other divisions. This shift signifies a deeper restructuring of South Korea's economy, moving from consumer electronics to AI-driven growth. However, the future remains competitive. With major capacity expansions planned industry-wide by 2028 and Samsung aiming to catch up in HBM technology, the new market leader cannot afford complacency. This event marks a pivotal moment in the global semiconductor industry's ongoing power realignment.

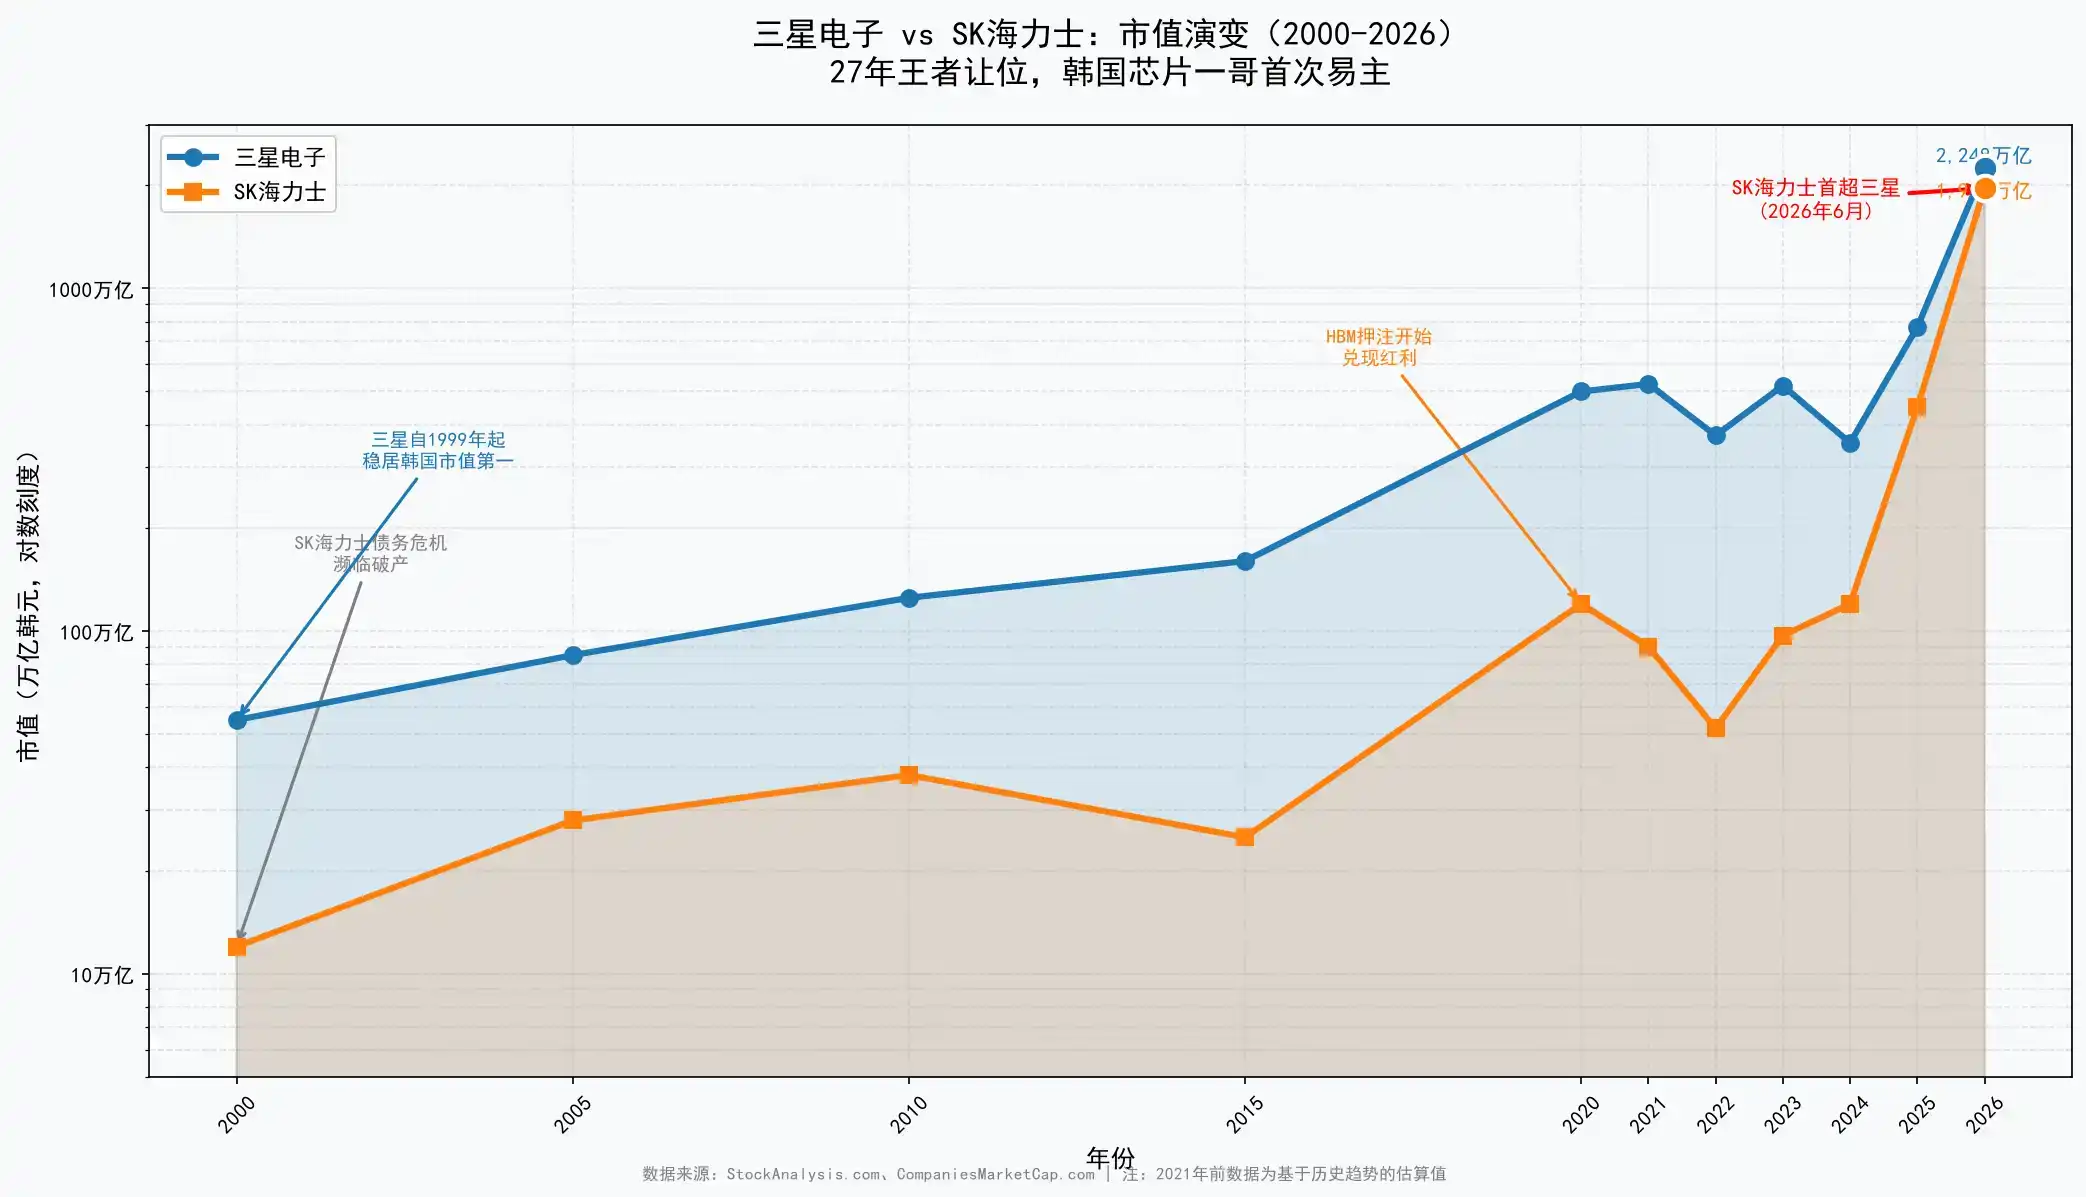
On June 22, 2026, SK Hynix, once burdened with $14 billion in debt and teetering on the brink of bankruptcy, saw its market capitalization surpass that of Samsung Electronics, which had dominated the Korean capital market for 27 years, to become South Korea's most valuable listed company. Behind this lies a precise, historic gamble—as the AI wave propelled High Bandwidth Memory (HBM) from a niche product to the core of computing power, SK Hynix, with a 59% market share and staggering daily net profits exceeding 2 billion yuan, completed the most dramatic comeback in business history.

The moment that rewrote the history of South Korea's capital market occurred during the trading session on June 22, 2026.

SK Hynix's total market capitalization exceeded that of Samsung Electronics for the first time, making it South Korea's highest-valued listed company. This marked the first time since 1999 that Samsung Electronics relinquished its title as South Korea's "market cap leader." At the intraday peak, SK Hynix's market cap reached 2,080 trillion won (approximately $1.35 trillion), while Samsung Electronics reported a market cap of 2,066 trillion won.

From a debt-ridden enterprise on the verge of collapse to a trillion-dollar empire surpassing the national symbol Samsung Electronics, SK Hynix accomplished one of the most astonishing comebacks in business history over two decades. This is not merely an exchange of rankings between two companies but also a microcosm of how the AI wave is reshaping the global semiconductor industry's power structure.

HBM: From Niche Product to Core Infrastructure of the AI Era

SK Hynix's comeback is essentially a history of "betting right on HBM."

High Bandwidth Memory (HBM) was once a niche category within memory chips. However, in the training of large AI models, GPUs require extremely high-speed data throughput with memory—an NVIDIA H100 requires 80GB of HBM, the H200 requires 141GB, and the latest B200 requires 192GB. Globally, only three companies can produce HBM: SK Hynix, Samsung, and Micron.

SK Hynix has established a near-monopoly advantage in this segment. According to TrendForce data, SK Hynix held a 59% share of the global HBM market in 2025. More critically, in the most lucrative HBM4 segment, Counterpoint Research predicts SK Hynix's market share will reach 54% in 2026 and has already secured over two-thirds of the HBM4 orders for NVIDIA's next-generation Vera Rubin platform, with some institutions predicting the share could exceed 70%.

This advantage is directly reflected in financial data. In the first quarter of 2026, SK Hynix's consolidated revenue reached 52.58 trillion won, a year-on-year increase of 198.1%, breaking the 50 trillion won mark for the first time; net profit reached 40.35 trillion won, nearly quadrupling year-on-year. A simple calculation shows that SK Hynix earned an average net profit of over 2 billion yuan per day in the first three months of this year.

An operating profit margin of 72% not only exceeded NVIDIA's but also far surpassed that of traditional DRAM business. According to Counterpoint Research estimates, the operating profit margin of SK Hynix's HBM business ranges between 75% and 83%, about 10 percentage points higher than its ordinary DRAM business. The HBM business now accounts for approximately 40% of the company's revenue, becoming a veritable profit engine.

Samsung's Dilemma: The Cost of Being Broad

Compared to SK Hynix's sharp focus, Samsung Electronics' problem lies in its "breadth" becoming a burden.

Samsung's business spans memory chips, smartphones, semiconductor foundry, home appliances, and more. Its 2025 revenue scale of 333.6 trillion won far exceeds that of SK Hynix, but the drag from non-memory businesses disperses resources and strategic focus.

In the memory chip sector, Samsung's layout in HBM is noticeably lagging. Although Samsung is also advancing the development of HBM3E and HBM4, it trails behind SK Hynix in customer certification and mass production progress. This has resulted in Samsung watching its competitor exclusively enjoy the premium during the period of most explosive AI computing demand.

What troubles Samsung even more is the simultaneous slowdown of its other businesses. The smartphone business's market share has declined from 54% to 45%; the semiconductor foundry business, due to technological gaps, has failed to secure orders from high-end customers, facing underutilization issues. The profits that the memory business should provide are continuously diluted by losses from other segments.

Furthermore, ongoing labor-management disputes between management and employees are intensifying. Following SK Hynix's milestone bonus agreement last year, Samsung's labor conflicts pose additional challenges to its profit recovery. While SK Hynix employees reap rich rewards from the AI红利, Samsung's organizational cohesion is being tested.

From $14 Billion in Debt to a Trillion-Dollar Empire

The story of SK Hynix's rise is almost a microcosm of the South Korean semiconductor industry.

Its origins can be traced back to Hyundai Electronics, founded in 1983. Relying on government support and chaebol capital injections, Hyundai Electronics rapidly caught up, focusing on DRAM chips, and grew into South Korea's second-largest semiconductor company by the 1990s. In 1999, Hyundai Electronics merged with LG Semiconductor to form Hynix, under the Hyundai Group.

However, the semiconductor downturn in the early 2000s almost pushed the company into bankruptcy. At that time, SK Hynix was saddled with $14 billion in debt and teetered on the brink of collapse. The South Korean government promoted industry consolidation, leading to a duopoly in the DRAM sector with Samsung and Hynix. Subsequently, through several key restructurings and counter-cyclical technological investments, Hynix gradually recovered.

The real turning point was the early bet on HBM. When the market still viewed HBM as a niche product, SK Hynix had already identified it as the future direction for high-performance computing. This strategic vision yielded超额回报 in the AI wave—today, HBM has transformed from a common commodity into a key infrastructure component supporting ChatGPT and advanced AI models.

SK Hynix's comeback has also altered the ecology of South Korea's capital market. The head of South Korea's Financial Supervisory Service recently expressed "regret over not preventing the launch of single-stock leveraged ETFs" and stated that the negative impact of high-risk products related to Samsung and SK Hynix has significantly increased. Retail investor demand for leveraged ETFs of these two stocks remains high, and regulators are considering separate stabilization measures.

Beyond Market Cap: Deep Restructuring of South Korea's Economic Landscape

The significance of SK Hynix's market cap surpassing Samsung extends far beyond a capital market ranking.

Bank of Korea Governor Shin Hyun-song recently stated explicitly that the benefits brought by the expansion of the semiconductor industry are increasingly being transmitted to the overall economy through corporate profits, consumption, and investment improvements. As companies like SK Hynix become new engines for the national economy, South Korea's growth model is shifting from being traditionally driven by consumer electronics to being driven by AI infrastructure.

From a global perspective, this event marks the transformation of the memory chip industry from "commoditization" to "high-value specialization." Traditional DRAM and NAND are highly cyclical commodities with volatile prices. However, HBM, deeply tied to AI computing power, is shedding its commodity attributes and becoming a high-end product with long-term pricing power.

Under the Cycle, No King Reigns Forever

However, SK Hynix's ascension does not mean it can rest easy.

Around 2028, new capacities from Micron's New York fab, SK Hynix's Yongin complex, and Samsung's Pyeongtaek expansion are expected to be released concurrently. TrendForce predicts that memory chip price increases will last at least until the end of 2027, but the landing of new capacity could alter the supply-demand balance. At that point, whether the scarcity premium of HBM will shrink will test the depth of SK Hynix's moat.

Furthermore, Samsung is unlikely to surrender its throne willingly. Samsung still possesses deep accumulation in 3D NAND and advanced process technologies. Once it achieves a breakthrough in HBM4, market competition will intensify rapidly. Today, the market cap difference is only about 14 trillion won, and the suspense over the change of the crown is far from over.

But on this day, June 22, 2026, SK Hynix indeed rewrote history. A company reborn from a debt crisis, through a precise bet on the core infrastructure of the AI era, surpassed the behemoth that had ruled South Korea's capital market for 27 years. This is not the终点, but the latest footnote in the ongoing reshuffle of power within the global semiconductor industry.

Trending Cryptos

Related Questions

QWhat significant milestone did SK Hynix achieve on June 22, 2026?

AOn June 22, 2026, SK Hynix's market capitalization surpassed that of Samsung Electronics for the first time, making it the most valuable listed company in South Korea, ending Samsung's 27-year reign as the market leader.

QWhat key technology product is central to SK Hynix's rise and its advantage over competitors?

AHigh Bandwidth Memory (HBM) is the key technology product. SK Hynix holds a dominant 59% market share in HBM, which has become a core infrastructure component for AI computing, driving the company's massive financial growth and market value surge.

QWhat were the main financial results for SK Hynix in Q1 2026 that highlight its success?

AIn Q1 2026, SK Hynix reported consolidated revenue of 52.58 trillion won (a 198.1% year-on-year increase) and a net profit of 40.35 trillion won (a nearly fourfold increase). The company's operating profit margin reached 72%, and it was averaging a net profit exceeding 2 billion RMB per day.

QHow is Samsung Electronics' business strategy described as a contrast to SK Hynix's current success?

ASamsung Electronics' strategy is described as broad but burdensome. Its diverse portfolio, including non-memory businesses like smartphones and foundry services, has diluted focus and resources. This has led to slower progress and missed opportunities in the high-margin HBM market compared to the more focused SK Hynix.

QWhat future challenges are mentioned for SK Hynix despite its current market leadership?

AFuture challenges include the potential for increased HBM production capacity from competitors like Micron and Samsung by around 2028, which could reduce the current scarcity premium. Furthermore, Samsung is actively working to catch up in HBM technology, meaning intense competition is expected to continue.

Related Reads

Research Report Interpretation: Citi Attends AWS Summit, Bullish on Cloud Business Acceleration but Data Governance Remains Key Variable

Citi analyst Tyler Radke's team attended the AWS New York Summit (June 17-18), engaging with over 10 clients and partners. In a June 19 report, they highlighted the summit's focus on scaling agent AI for enterprise deployment. Citi maintains a "Buy" rating on Amazon, forecasting AWS revenue growth to accelerate to 37% in FY27 from 30% in FY26, noting this estimate may be conservative. Key takeaways: 1. **AWS Strategy Shift:** AWS is moving from proof-of-concepts to scalable deployment. New offerings like AWS Context (building enterprise knowledge graphs), Amazon Quick (cross-application AI assistant), and security tool Continuum address core enterprise pain points for AI adoption. 2. **Data Infrastructure Beneficiaries:** Data infrastructure companies like Snowflake, Elastic, Oracle, and ClickHouse are seen as direct beneficiaries of scaling AI workloads, as evidenced by strong growth and use cases presented. 3. **Critical Role of Data Governance:** As AI agents scale from hundreds to thousands, effective data governance becomes the key variable for deploying AI in core business processes. AWS Context represents AWS's strategic extension from providing compute/models to offering a data governance infrastructure layer. The report emphasizes that without solving data governance, AI will remain confined to pilot projects. The investment thesis focuses on AWS revenue acceleration and data infrastructure vendors' growth, while monitoring signals like AWS's quarterly revenue growth, Bedrock AgentCore task volume, and pricing impacts on companies like Elastic.

marsbit5m ago

Research Report Interpretation: Citi Attends AWS Summit, Bullish on Cloud Business Acceleration but Data Governance Remains Key Variable

marsbit5m ago

Crucial Week of Contention: BTC Tests Support and HYPE's Key Level Battle | Special Analysis

**Market Enters Critical Week: Bitcoin Pullback Test and HYPE Support Battle** The market enters a crucial phase of contention this week. The marginal shifts in Federal Reserve policy expectations continue to dictate the pricing rhythm for risk assets. Meanwhile, in the crypto market, following a period of sideways consolidation, the divergence between bulls and bears is becoming concentrated at key price levels. **Bitcoin (BTC) Analysis & Strategy** * **Technical View:** The 4-hour chart suggests BTC is in a five-wave structure since the June 5th low near $59,100. Price action shows a short-term rising channel. The recent drop below this channel's lower boundary is now being followed by a pullback attempt (wave 40-41). The outcome of this retest is critical. * **This Week's Outlook:** The core focus is whether BTC can reclaim and hold above the channel's lower boundary. * **Bullish Scenario:** A successful hold could lead to a continued rebound, potentially challenging the $69,500 - $70,500 resistance zone. * **Bearish Scenario:** Failure to hold may trigger a renewed test of the $59,000 - $60,000 core support area, with $55,000 as a deeper support level. * **Operational Strategy:** The author maintains a 20% mid-term short position initiated last week near $64,500, based on a model signaling a shift to a bearish structure. Short-term tactics involve using 30% capital for potential "spread" trades, with three contingency plans (A, B, C) outlined for reacting to resistance tests, breakouts, or support breakdowns. **HYPE Analysis & Strategy** * **Technical View:** On the 4-hour chart, HYPE shows strong momentum, having recently broken to a new high since January. The current pullback presents a clear three-wave correction structure, bringing the price back to the critical $64 - $66 support zone. * **This Week's Outlook:** The focus is on the battle for the $64 - $66 support area. * **Bullish Scenario:** Holding this support could signal a continuation of the uptrend from the June 10th low, leading to new highs. * **Bearish Scenario:** A breakdown could extend the correction, potentially testing the deeper $52 - $54 support band. * **Operational Strategy:** The recommended short-term approach is "buy on dips, avoid chasing rallies." A light long position (under 30% capital) could be considered if HYPE shows stabilization signals at the $64-$66 or $52-$54 support zones, confirmed by model signals. Strict stop-loss discipline is emphasized. **General Risk Management:** A strict trailing stop-loss protocol is advised: set an initial stop; move to breakeven at +1% profit; lock in profits progressively thereafter. *Disclaimer: All analysis is presented as the author's personal technical perspective and trading log, not as investment advice. Markets are complex and dynamic; risk control is paramount.*

Odaily星球日报6m ago

Crucial Week of Contention: BTC Tests Support and HYPE's Key Level Battle | Special Analysis

Odaily星球日报6m ago

AI Agents Also Need 'Credit Checks': ERC-8126 is Filling the Gap in On-chain Trust

The article discusses ERC-8126, a proposed standard designed to address the lack of trust and verification for AI Agents operating on-chain. While ERC-8004 provides AI Agents with a basic on-chain identity (answering "Who are you?"), it does not guarantee trustworthiness. ERC-8126 aims to fill this gap by establishing a verification layer (answering "Are you reliable?"). It standardizes how independent verification providers can assess an agent's associated risks across five key areas: Token/Contract Verification (ETV), Media Content Verification (MCV), Solidity Code Verification (SCV), Web Application Verification (WAV), and Wallet Verification (WV). These providers generate a standardized risk score (0-100) and proofs based on their checks, without acting as a single authoritative certifier. This allows wallets, marketplaces, dApps, and other agents to consume these risk signals—for example, to display warnings, filter listings, or make interaction decisions. The standard also incorporates concepts like Private Data Verification (PDV) and Zero-Knowledge Proofs (ZKP) to allow verification without exposing sensitive underlying data. Positioned alongside ERC-8004 (Identity) and ERC-8183 (Commerce for agents), ERC-8126 represents a step toward building a verifiable and accountable infrastructure for the emerging on-chain AI Agent economy, shifting trust assessment from purely user-based judgment to standardized, consumable signals.

marsbit24m ago

AI Agents Also Need 'Credit Checks': ERC-8126 is Filling the Gap in On-chain Trust

marsbit24m ago

Rented Conviction: How Much Real Money Is Behind the Bitcoin ETF Flows

Borrowed Belief: How much of Bitcoin ETF flows are real money? Weekly Bitcoin ETF flows, often interpreted as a measure of institutional conviction, are heavily influenced by a hidden arbitrage trade rather than genuine directional buying. A cash-and-carry arbitrage, where traders buy the ETF while simultaneously shorting Bitcoin futures on the CME to lock in a basis spread (the price difference between futures and spot), drives roughly half of the week-to-week flow volatility. This delta-neutral activity appears as ETF inflows but is unrelated to price views. Data shows a strong correlation (0.70) between weekly ETF inflows and increases in hedge fund short positions on CME futures, while Bitcoin’s weekly price returns have almost no explanatory power. However, this arbitrage activity dominates short-term *fluctuations*, not the cumulative *stock* of investments. Of the total ~$55 billion in net ETF inflows since launch, only about $1 billion currently represents net arbitrage exposure. The vast majority consists of steady, directional buying averaging around $400 million per week. The arbitrage trade has been unwinding for two years, with hedge fund short positions peaking near $14 billion in late 2024 and declining to ~$4.5 billion. Recent ETF outflows partly reflect this ongoing unwind as the basis compresses, not a loss of faith in Bitcoin. Thus, ETF flows overstate the *volatility* of belief, not its *level*. The headline number is more a gauge of arbitrage desk activity than conviction. For accurate interpretation, monitor the CME basis relative to Treasury yields and hedge fund net shorts—these reveal how much of the reported “demand” is truly directional.

marsbit26m ago

Rented Conviction: How Much Real Money Is Behind the Bitcoin ETF Flows

marsbit26m ago

Borrowed Faith: How Much of the Bitcoin ETF Flows Are Real Money

"Rented Faith: How Much of Bitcoin ETF Flows Are Real Money?" Bitcoin ETF inflows are often seen as a barometer of institutional conviction. However, week-to-week analysis reveals they are primarily driven by a hidden arbitrage trade rather than directional bullishness. This is the cash-and-carry trade: buying the ETF while simultaneously shorting Bitcoin futures on the CME to lock in the price difference (basis). This delta-neutral activity registers as ETF inflows but reflects a rate-seeking, not price-betting, strategy. Data shows weekly ETF flow volatility is closely tied to hedge fund ("leveraged funds") short positions on CME futures, with a correlation of 0.70. About half of weekly flow variation can be explained by this single factor. In contrast, Bitcoin's weekly price changes have no statistically significant power to predict flows. Crucially, while this arbitrage trade dominates weekly *fluctuations*, it is not the main component of the cumulative *stock*. Of the ~$55 billion total net inflow, the estimated net arbitrage position is only about $1 billion. The vast majority is steady, directional buying averaging ~$400 million per week. Thus, ETF flows overstate the *volatility* of belief, not its *level*. The "rented" arbitrage capital churns, while "owned" directional capital forms the bedrock. This arbitrage trade has been unwinding for two years, with hedge fund shorts peaking at ~$14 billion in late 2024 and falling to ~$4.5 billion. Recent outflows align with basis compression, signaling the trade's exit, not a loss of faith. For Ethereum ETFs, the same dynamic is weaker due to negative carry from forgone staking yield. The key takeaway: To interpret ETF flows, watch the basis vs. Treasury yields and CME hedge fund net shorts. They reveal how much of the weekly "demand" headline is driven by rented, rate-seeking capital versus real conviction.

链捕手40m ago

Borrowed Faith: How Much of the Bitcoin ETF Flows Are Real Money

链捕手40m ago

Trading

Spot
Futures

Hot Articles

How to Buy CHIP

Welcome to HTX.com! We've made purchasing USD.AI (CHIP) simple and convenient. Follow our step-by-step guide to embark on your crypto journey.Step 1: Create Your HTX AccountUse your email or phone number to sign up for a free account on HTX. Experience a hassle-free registration journey and unlock all features.Get My AccountStep 2: Go to Buy Crypto and Choose Your Payment MethodCredit/Debit Card: Use your Visa or Mastercard to buy USD.AI (CHIP) instantly.Balance: Use funds from your HTX account balance to trade seamlessly.Third Parties: We've added popular payment methods such as Google Pay and Apple Pay to enhance convenience.P2P: Trade directly with other users on HTX.Over-the-Counter (OTC): We offer tailor-made services and competitive exchange rates for traders.Step 3: Store Your USD.AI (CHIP)After purchasing your USD.AI (CHIP), store it in your HTX account. Alternatively, you can send it elsewhere via blockchain transfer or use it to trade other cryptocurrencies.Step 4: Trade USD.AI (CHIP)Easily trade USD.AI (CHIP) on HTX's spot market. Simply access your account, select your trading pair, execute your trades, and monitor in real-time. We offer a user-friendly experience for both beginners and seasoned traders.

1.8k Total ViewsPublished 2026.04.21Updated 2026.06.02

How to Buy CHIP

Discussions

Welcome to the HTX Community. Here, you can stay informed about the latest platform developments and gain access to professional market insights. Users' opinions on the price of CHIP (CHIP) are presented below.

活动图片