Связанный с Трампом мемкоин DJT обвалился на 99%

cryptonews.ruPubblicato 2022-05-06Pubblicato ultima volta 2024-08-06

  • Мемкоин DJT, который связывают с Дональдом Трампом, упал на 99%.
  • Кошелек, владевший 20% от общего объема токенов, продал свои активы.

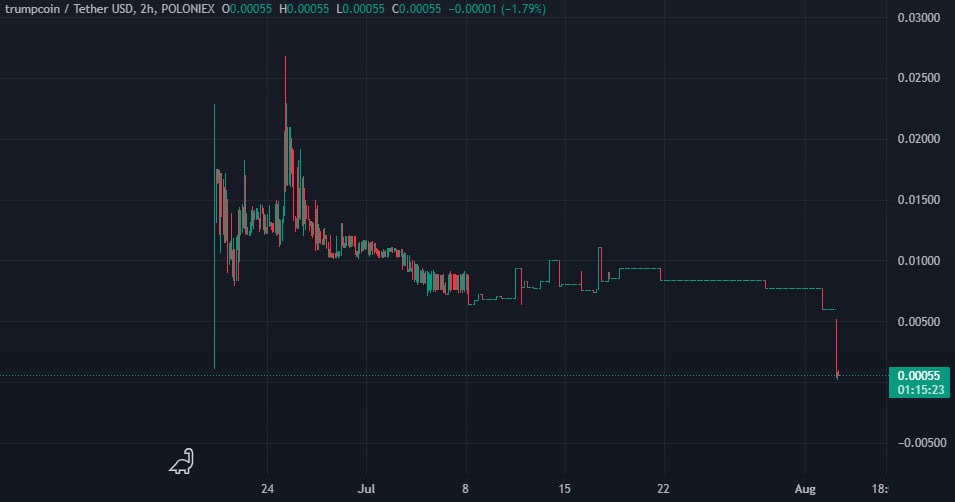
6 августа 2024 года мемкоин TrumpCoin (DJT), к созданию которого, по слухам, причастен кандидат в президенты США Дональд Трамп, упал на около 95% за 24 часа. От своего исторического максимума токен обвалился на более чем 99%.

График DJT/USDT на бирже Poloniex. Данные: TradingView.

Отметим, на фоне резкого обвала цены мемкоина, количество трейдеров, которые им торгуют, увеличилось на почти 1000% за последние 24 часа, по данным Birdeye.

Участник X (ранее Twitter) под псевдонимом SlorgoftheSlugs заявил, что падение DJT произошло из-за того, что один трейдер продал 20% от общего объема токенов. Он подчеркнул, что на этот кошелек отправили активы два месяца назад.

Someone who was holding 20% of the $DJT supply just nuked the entire project in 1 clip.

The token is down 94% in a single day and has tanked 99% from its All Time High. pic.twitter.com/bWWqh6amRb

— Slorg (@SlorgoftheSlugs) August 6, 2024

Напомним, ранее сообщалось, что за разработкой токена может стоять соучредитель хедж-фонда MSMB Capital Management Мартин Шкрели. Сначала он отрицал свою причастность к созданию DJT, заявив, что актив является «настоящим токеном Трампа».

Впоследствии в Arkham предложили награду в $150 000 за информацию об авторе DJT. После того Шкрели лично связался с ончейн-детективом ZachXBT и сказал, что именно он запустил монету DJT совместно с сыном Трампа — Бэрроном Трампом.

Подчеркнем, за последние 24 часа другие PoliFi-токены, включая те, что связаны с Трампом, продемонстрировали рост.

Курс PoliFi-токенов. Данные: CoinGecko.

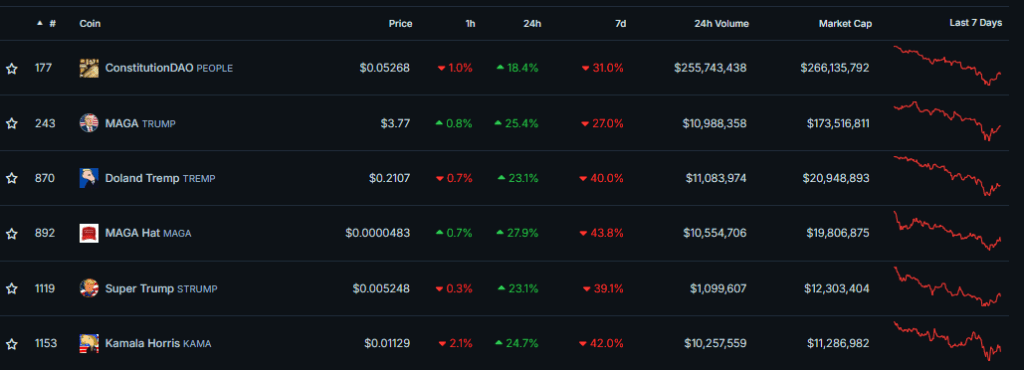
Ранее PoliFi-токены подскочили в цене после покушения на Дональда Трампа.

Letture associate

After Missing the 20x, I've Found a 'Dumb' Method for AI Investing

**Missing the 20x Opportunity: A Simple 'Dumb' Approach to AI Investing** The AI boom, driving NVIDIA's revenue from $60B to $216B in two years, creates immense investment pressure. However, like the internet bubble of 2000, the largest AI opportunities likely lie ahead, perhaps after a correction. Instead of rushing in now or waiting paralyzed for a crash, the author proposes a third way: building a "knowledge warehouse" by systematically mapping the AI industry to be ready when opportunities arise. The core of the strategy is understanding AI's four-layer value chain: 1. **Compute Infrastructure (The "Engine"):** This foundational layer, where all money eventually flows, includes: a) **Chip Design:** NVIDIA's dominance via its CUDA ecosystem, b) **Chip Manufacturing/Packaging/Memory:** TSMC's near-monopoly in advanced manufacturing and SK Hynix's lead in High Bandwidth Memory (HBM), c) **Optical Interconnects:** Essential for large-scale AI clusters (e.g., Lumentum, Coherent), d) **Cooling & Power:** Critical for high-density AI data centers (e.g., Vertiv), e) **Servers/Data Centers & Cloud Platforms:** The physical and virtual wholesale providers. 2. **Models & Tools (The "OS"):** The competitive layer of foundation models (OpenAI, Anthropic, Google, Meta, xAI), now generating real revenue. A key shift is the center of gravity moving from **Training** models to **Inference** (running models), which demands different chip characteristics and could challenge NVIDIA's monopoly. 3. **Middleware & Platform ("The Glue"):** Connects models and applications (e.g., Scale AI, Hugging Face). This layer could explode if applications take off. 4. **Vertical Applications ("The Cash Register"):** Where AI meets end-users (e.g., enterprise AI, coding tools, medical AI, robotics). A critical cross-cutting constraint is **Energy**, as AI's massive power consumption drives investment in nuclear and other energy infrastructure. The author identifies four key questions for further research: 1) How will the shift from Training to Inference reshape the competitive landscape? 2) With tech giants spending over $600B on capex, where is the ROI from AI applications? 3) What are the under-the-radar opportunities in the "second" and "third" circles of the value chain (e.g., cooling, specialty foundries)? 4) How will geopolitics (e.g., U.S.-China chip restrictions) bifurcate the supply chain? The conclusion is that missed opportunities stem from insufficient research, not slow timing. By methodically studying each layer—its business models, competition, and valuations—investors can build the "killer intuition" needed to act decisively when the market presents its chance.

marsbit17 min fa

After Missing the 20x, I've Found a 'Dumb' Method for AI Investing

marsbit17 min fa

Rented Faith: How Much of the Bitcoin ETF Inflows Is Real Money?

"Rented Conviction: How Much of Bitcoin ETF Flows Is Real Money" The weekly inflows into Bitcoin ETFs are often interpreted as a gauge of institutional belief. However, a significant portion of this activity is driven by a hidden arbitrage trade, not directional conviction. The core mechanism is a cash-and-carry arbitrage: traders buy spot Bitcoin (often via ETFs) while simultaneously shorting CME futures to lock in the price difference, or "basis." This delta-neutral trade is essentially an interest rate play. In weekly data, about half the fluctuation in ETF flows can be explained by new short positions added by leveraged funds (hedge funds), with a correlation of 0.70. Bitcoin's price movement in a given week shows no statistical power in predicting these flows. While this arbitrage trade drives weekly *volatility*, it is not the main component of the cumulative *stock*. Of the total ~$55 billion in net ETF inflows, the current net arbitrage position is only about $1 billion. The remainder is steady, directional buying averaging ~$400 million per week, which constitutes the vast majority of the accumulated "mountain" over two years. Thus, ETF flow data overstates the *volatility* of conviction, not its *level*. This arbitrage trade has been unwinding for nearly two years. Leveraged fund short positions peaked at ~$14 billion in late 2024 and have since declined to ~$4.5 billion. When the basis compresses to unprofitable levels, ETF inflows and short positions retreat together. Recent outflows should not be mistaken for a loss of faith but rather the routine unwinding of this rate trade. For Ethereum ETFs, the pattern is weaker. Accounting for staking yield makes the basis often negative, so neither strong conviction buying nor robust arbitrage supports its flows. To interpret ETF flows correctly, monitor the CME basis versus T-bill rates and leveraged fund net shorts. They reveal how much of the next "demand" headline is real. The real, patient buy-and-hold demand is what constitutes the enduring bulk of ETF assets.

marsbit1 h fa

Rented Faith: How Much of the Bitcoin ETF Inflows Is Real Money?

marsbit1 h fa

Trading

Spot
Futures
活动图片