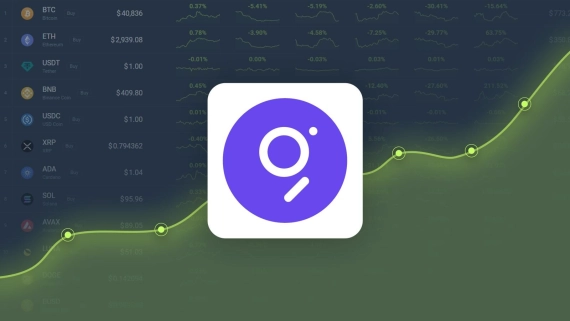
The Graph Price Prediction – GRT Price Estimated to Reach $0.346440 By May 02, 2024 | CoinCodex

cryptodailyPublished on 2024-04-23Last updated on 2024-04-27

Table of Contents

Disclaimer: This is not investment advice. The information provided is for general purposes only. No information, materials, services and other content provided on this page constitute a solicitation, recommendation, endorsement, or any financial, investment, or other advice. Seek independent professional consultation in the form of legal, financial, and fiscal advice before making any investment decision.

  • The Graph is up 4.33% today against the US Dollar
  • GRT/BTC increased by 5.16% today
  • The Graph is currently trading 21.81% below our prediction on May 02, 2024
  • The Graph dropped -35.30% in the last month and is up 99.81% since 1 year ago
The Graph price$ 0.270868
The Graph prediction $ 0.346440 (30.61%)
Sentiment Neutral
Fear & Greed index 67 (Greed)
Key support levels$ 0.253624, $ 0.247864, $ 0.239353
Key resistance levels$ 0.267895, $ 0.276406, $ 0.282166

GRT price is expected to rise by 30.61% in the next 5 days according to our The Graph price prediction

The Graph price today is trading at $ 0.270868 after gaining 4.33% in the last 24 hours. The coin outperformed the cryptocurrency market, as the total crypto market cap increased by 3.38% in the same time period. GRT performed well against BTC today and recorded a 5.16% gain against the world’s largest cryptocurrency.

According to our The Graph price prediction, GRT is expected to reach a price of $ 0.346440 by May 02, 2024. This would represent a 30.61% price increase for GRT in the next 5 days.

GRT Price Prediction Chart

Buy/Sell The Graph

What has been going on with The Graph in the last 30 days

The Graph has been displaying a negative trend recently, as the coin lost -35.30% in the last 30-days. The medium-term trend for The Graph has been bullish, with GRT increasing by 69.68% in the last 3 months. The long-term picture for The Graph has been positive, as GRT is currently displaying a 99.81% 1-year price change. On this day last year, GRT was trading at $ 0.135562.

The Graph reached its all-time high price on Feb 12, 2021, when the price of GRT peaked at $ 2.87. The current GRT cycle high is $ 0.491682, while the cycle low is at $ 0.051894. GRT has been displaying high volatility recently – the 1-month volatility of the coin is at 16.29. The Graph recorded 13 green days in the last 30 days.

The Graph technical analysis for today - Apr 27, 2024

The sentiment in the The Graph markets is currently Neutral, and the Fear & Greed index is reading Greed. The most important support levels to watch are $ 0.253624, $ 0.247864 and $ 0.239353, while $ 0.267895, $ 0.276406 and $ 0.282166 are the key resistance levels.

Neutral sentiment for The Graph

14 indicators are currently signaling a bullish prediction for The Graph, while 14 indicators are showing a bearish forecast. With 50% of indicators favoring a positive prediction. This results in an overall Neutral sentiment for The Graph.

Crypto market is currently experiencing Greed

Currently, the Fear & Greed index is at 67 (Greed), which signals that investors have a positive outlook on the market. The Fear & Greed index is a measure of sentiment among cryptocurrency investors. A “Greed” reading suggests that investors are currently optimistic about the cryptocurrency market, but can also be an indication that the market is overvalued. A “Fear” reading, on the other hand, signals that investors are currently hesitant about the cryptocurrency market, which potentially represents a buying opportunity.

The Graph moving averages & oscillators

Let’s take a look at what some of the most important technical indicators are signaling. We’ll be going through key moving averages and oscillators that will allow us to get a better idea of how The Graph is positioned in the market right now.

PeriodDaily SimpleDaily ExponentialWeekly SimpleWeekly Exponential
MA3$ 0.266763 (BUY)$ 0.264091 (BUY)--
MA5$ 0.273162 (SELL)$ 0.266071 (BUY)--
MA10$ 0.291685 (SELL)$ 0.281533 (SELL)--
MA21$ 0.298799 (SELL)$ 0.309584 (SELL)-$ 0.97 (BUY)$ 0.254462 (BUY)
MA50$ 0.347334 (SELL)$ 0.318395 (SELL)-$ 0.82 (BUY)$ 0.194570 (BUY)
MA100$ 0.277423 (SELL)$ 0.284205 (SELL)-$ 0.50 (BUY)$ 0.131534 (BUY)
MA200$ 0.206847 (BUY)$ 0.231708 (BUY)--

PeriodValueAction
RSI (14)40.43NEUTRAL
Stoch RSI (14)97.10SELL
Stochastic Fast (14)56.10NEUTRAL
Commodity Channel Index (20)-66.67NEUTRAL
Average Directional Index (14)25.99SELL
Awesome Oscillator (5, 34)-0.04NEUTRAL
Momentum (10)0.01NEUTRAL
MACD (12, 26)0.00NEUTRAL
Williams Percent Range (14)-43.90NEUTRAL
Ultimate Oscillator (7, 14, 28)52.02NEUTRAL
VWMA (10)0.27SELL
Hull Moving Average (9)0.30SELL
Ichimoku Cloud B/L (9, 26, 52, 26)0.30NEUTRAL

The Relative Strength Index (RSI 14) is a widely used indicator that helps inform investors whether an asset is currently overbought or oversold. The RSI 14 for The Graph is at 40.43, suggesting that GRT is currently neutral.

The 50-day Simple Moving Average (SMA 50) takes into account the closing price of The Graph over the last 50 days. Currently, The Graph is trading above the SMA 50 trendline, which is a bullish signal.

Meanwhile, the 200-day Simple Moving Average (SMA 200) is a long-term trendline that’s calculated by taking an average of the GRT closing price for the last 200 days. GRT is now trading below the SMA 200, signaling that the market is currently bearish.

The bottom line about this The Graph prediction

After considering the above factors, we can conclude that the current forecast for The Graph price prediction is Neutral. GRT would have to increase by 30.61% to hit our $ 0.346440 target within the next five days. Moving forward, it will be important to monitor the GRT market sentiment, the key support and resistance levels, and other metrics. However, we have to keep in mind that the cryptocurrency markets are unpredictable, and even the largest crypto assets display a lot of price volatility. For long-term The Graph price predictions click here.

Disclaimer: This is not investment advice. The information provided is for general purposes only. No information, materials, services and other content provided on this page constitute a solicitation, recommendation, endorsement, or any financial, investment, or other advice. Seek independent professional consultation in the form of legal, financial, and fiscal advice before making any investment decision.

Disclaimer: This article is provided for informational purposes only. It is not offered or intended to be used as legal, tax, investment, financial, or other advice.

Read on CoinCodex Investment Disclaimer

Related Reads

Raised $1.3 Billion in Seven Weeks, Yet SpaceX's Weighting Halved: The Dilution Trap of the NASA ETF

A new ETF named NASA, launched just seven weeks ago, has rapidly become the world's largest space-themed fund, amassing $1.3 billion in assets. Its primary draw is its unique position as a "pure" space ETF holding SpaceX stock through a special purpose vehicle (SPV). However, its exposure to SpaceX has been drastically diluted from 10.3% to 4.6% due to a massive, rapid inflow of investor cash. New money is forced into buying other public space stocks like Rocket Lab, meaning investors seeking SpaceX exposure end up with a portfolio of other companies. Further complications arise from the SPV's valuation mechanism, which only updates during specific manager trades, potentially lagging behind SpaceX's market price. This SPV will also face a six-month lock-up post-IPO, preventing investors from selling that portion if SpaceX shares drop after listing. The article highlights a valuation bubble in the broader space sector, with stocks like Planet Labs surging nearly 1000% in a year, driven more by the "SpaceX IPO narrative" than underlying fundamentals. Meanwhile, SpaceX's own financials show significant losses in 2024, and its record-breaking IPO valuation bundles its space business with other Musk assets like xAI, creating a complex investment proposition. The core warning is that the NASA ETF essentially uses SpaceX as bait but delivers a different product. The real beneficiaries may be the ETF issuers collecting high fees, while investors face dilution and hidden risks ahead of SpaceX's historic IPO on June 12th.

marsbit9m ago

Raised $1.3 Billion in Seven Weeks, Yet SpaceX's Weighting Halved: The Dilution Trap of the NASA ETF

marsbit9m ago

NEAR Doubles: 3 Major Trends Become the 'Engine' for Token Price Surge

NEAR token price surged from around $1.24 in early May to over $2.5, with its market cap returning above $3 billion. This significant growth, occurring amidst broader market volatility, is attributed to three key factors. First, the AI narrative has been a major driver. NEAR co-founder Illia Polosukhin is a co-author of the seminal Transformer paper, the foundation of modern AI models like ChatGPT. NEAR has integrated AI capabilities into its ecosystem, notably through the Near.com super-app, positioning itself as a key decentralized AI infrastructure project. Endorsements from figures like Arthur Hayes further boosted market sentiment. Second, NEAR is enhancing its utility as a privacy-focused blockchain. With the launch of NEAR Intents for cross-chain transactions, privacy features like Confidential Payments and Confidential Intents have become critical to protect users from MEV attacks. These functionalities allow private transfers of assets like ETH and BTC across more than 35 chains, balancing privacy with usability and appealing to institutional and enterprise users. Third, a new tokenomics mechanism is providing buy-side pressure. Following the full unlocking of its initial supply in late 2025, NEAR now employs a fee-burn model. All protocol fees generated by the NEAR Intents layer are used to buy back and effectively remove NEAR tokens from circulation. With NEAR Intents TVL exceeding $80 million, this creates consistent monthly buybacks estimated around $3 million, reducing sell pressure. Additional technical upgrades planned for mid-2026, including dynamic re-sharding and post-quantum security, aim to further strengthen the network's scalability and robustness.

marsbit11m ago

NEAR Doubles: 3 Major Trends Become the 'Engine' for Token Price Surge

marsbit11m ago

After $HYPE Hits a New High, Is It Worth Considering the Stock of "HYPE Version MicroStrategy" $PURR?

**HYPE Hits New Highs: Is $PURR, the "HYPE Version of MicroStrategy," Worth Considering?** The stock of Hyperliquid Strategies (NASDAQ: $PURR), a publicly-traded company that exclusively buys and holds the cryptocurrency HYPE, has gained over 100% year-to-date, mirroring HYPE's own 150% surge to new all-time highs. This has sparked discussions about PURR being a more "capital-efficient" play than MicroStrategy's bitcoin strategy, given its reported ~$1 billion unrealized gain on a ~$220 million investment. The article clarifies that PURR is essentially a pure-play wrapper for HYPE, with no other business. It resulted from a 2025 SPAC merger led by firms like Paradigm and Atlas Merchant Capital, bringing traditional finance veterans to its board. Its value is entirely derived from the price of HYPE. While PURR offers a crucial compliance bridge for US-based institutional and retirement accounts unable to access HYPE directly, the analysis questions the "capital efficiency" narrative. The outsized gains are attributed to HYPE's exceptional performance, not superior corporate strategy. For investors who can buy HYPE directly, holding PURR introduces unnecessary risks: potential shareholder dilution from future stock offerings, incomplete passthrough of staking rewards, market hour mismatches, and counterparty risk via its single custodian. A key metric is its mNAV (modified net asset value). Current calculations show PURR trades at a discount to its HYPE holdings, but this could flip to a premium depending on the execution of registered share issuances. The article concludes that PURR is primarily a "conduit product." The investment thesis hinges entirely on one's bullishness on HYPE itself, not on the PURR wrapper, which adds friction and risk for those with direct crypto access.

marsbit40m ago

After $HYPE Hits a New High, Is It Worth Considering the Stock of "HYPE Version MicroStrategy" $PURR?

marsbit40m ago

The Real Progress and Investment Opportunities of Decentralized AI Computing Power Networks in 2026

In 2026, the AI compute market is marked by centralized GPU consolidation and a significant GPU shortage for smaller players. In this context, Decentralized Physical Infrastructure Networks (DePIN), valued at $9.4B+, have emerged as a viable, revenue-generating alternative. Leading protocols like Aethir ($150M ARR), io.net (130k+ GPUs), Akash, Bittensor, and Render are carving out distinct niches, moving beyond hype to deliver verifiable income primarily from non-crypto-native clients. The key advantage of decentralized GPU networks lies in serving latency-tolerant, cost-sensitive workloads like AI inference, fine-tuning, data preprocessing, and agent operations, offering substantial cost savings (45-80%) compared to major cloud providers. However, reliability variance, lack of robust SLAs, and fragmented tech stacks remain significant adoption hurdles. The sector is maturing with critical 2026 shifts: 1) Evolution of tokenomics towards demand-driven, revenue-linked models (e.g., Render's BME, io.net's IDE), and 2) Clearer enterprise adoption pathways, with traditional firms integrating decentralized compute. For new entrants, opportunities are now concentrated in specialized tooling layers (orchestration, verification, SLA management), vertical applications (e.g., bio-med, content generation), and innovative token designs tied to real usage, rather than generic GPU aggregation. The convergence with the emerging AI Agent economy presents a significant future growth vector.

marsbit41m ago

The Real Progress and Investment Opportunities of Decentralized AI Computing Power Networks in 2026

marsbit41m ago

Trading

Spot
Futures

Hot Articles

How to Buy GRT

Welcome to HTX.com! We've made purchasing The Graph (GRT) simple and convenient. Follow our step-by-step guide to embark on your crypto journey.Step 1: Create Your HTX AccountUse your email or phone number to sign up for a free account on HTX. Experience a hassle-free registration journey and unlock all features.Get My AccountStep 2: Go to Buy Crypto and Choose Your Payment MethodCredit/Debit Card: Use your Visa or Mastercard to buy The Graph (GRT) instantly.Balance: Use funds from your HTX account balance to trade seamlessly.Third Parties: We've added popular payment methods such as Google Pay and Apple Pay to enhance convenience.P2P: Trade directly with other users on HTX.Over-the-Counter (OTC): We offer tailor-made services and competitive exchange rates for traders.Step 3: Store Your The Graph (GRT)After purchasing your The Graph (GRT), store it in your HTX account. Alternatively, you can send it elsewhere via blockchain transfer or use it to trade other cryptocurrencies.Step 4: Trade The Graph (GRT)Easily trade The Graph (GRT) on HTX's spot market. Simply access your account, select your trading pair, execute your trades, and monitor in real-time. We offer a user-friendly experience for both beginners and seasoned traders.

3.6k Total ViewsPublished 2024.03.29Updated 2025.05.06

How to Buy GRT

Discussions

Welcome to the HTX Community. Here, you can stay informed about the latest platform developments and gain access to professional market insights. Users' opinions on the price of GRT (GRT) are presented below.

活动图片