Decred breaks multi-month downtrend – Can DCR hit $16.68 next?

ambcryptoPublié le 2026-07-13Dernière mise à jour le 2026-07-13

Résumé

Decred (DCR) surged 24% in 24 hours, breaking a multi-month downtrend and drawing renewed market attention with trading volume spiking over 400%. Despite the sharp price rise, data showed sellers remained active, though buyers absorbed the pressure. The rally featured increased whale-sized orders, indicating stronger institutional participation. Technically, DCR broke above a key descending channel and rebounded from support near $10.67, now targeting the next major resistance at $16.68. The Relative Strength Index entered overbought territory, signaling strong buying but potential short-term exhaustion. For the recovery to continue toward $16.68, buyers must sustain momentum and defend the breakout level against persistent selling pressure.

Decred [DCR] surged 24.03% over the past 24 hours at press time and attracted renewed market attention after buyers returned aggressively. Daily trading volume jumped 400.65% to roughly $8.3 million, while market capitalization climbed 24.07% to $242.93 million.

Those gains reflected stronger participation rather than isolated buying activity. Investors also returned after DCR spent months trading inside a persistent downtrend. As a result, the rally shifted market sentiment and placed the token among the strongest performers during the session.

Even so, higher trading activity alone did not confirm that buyers had gained complete control. Instead, the rapid expansion in volume suggested the market had entered a decisive phase where both buyers and sellers actively competed for direction.

Selling pressure lingered beneath the rally

Despite the impressive price recovery, spot market positioning painted a more balanced picture.

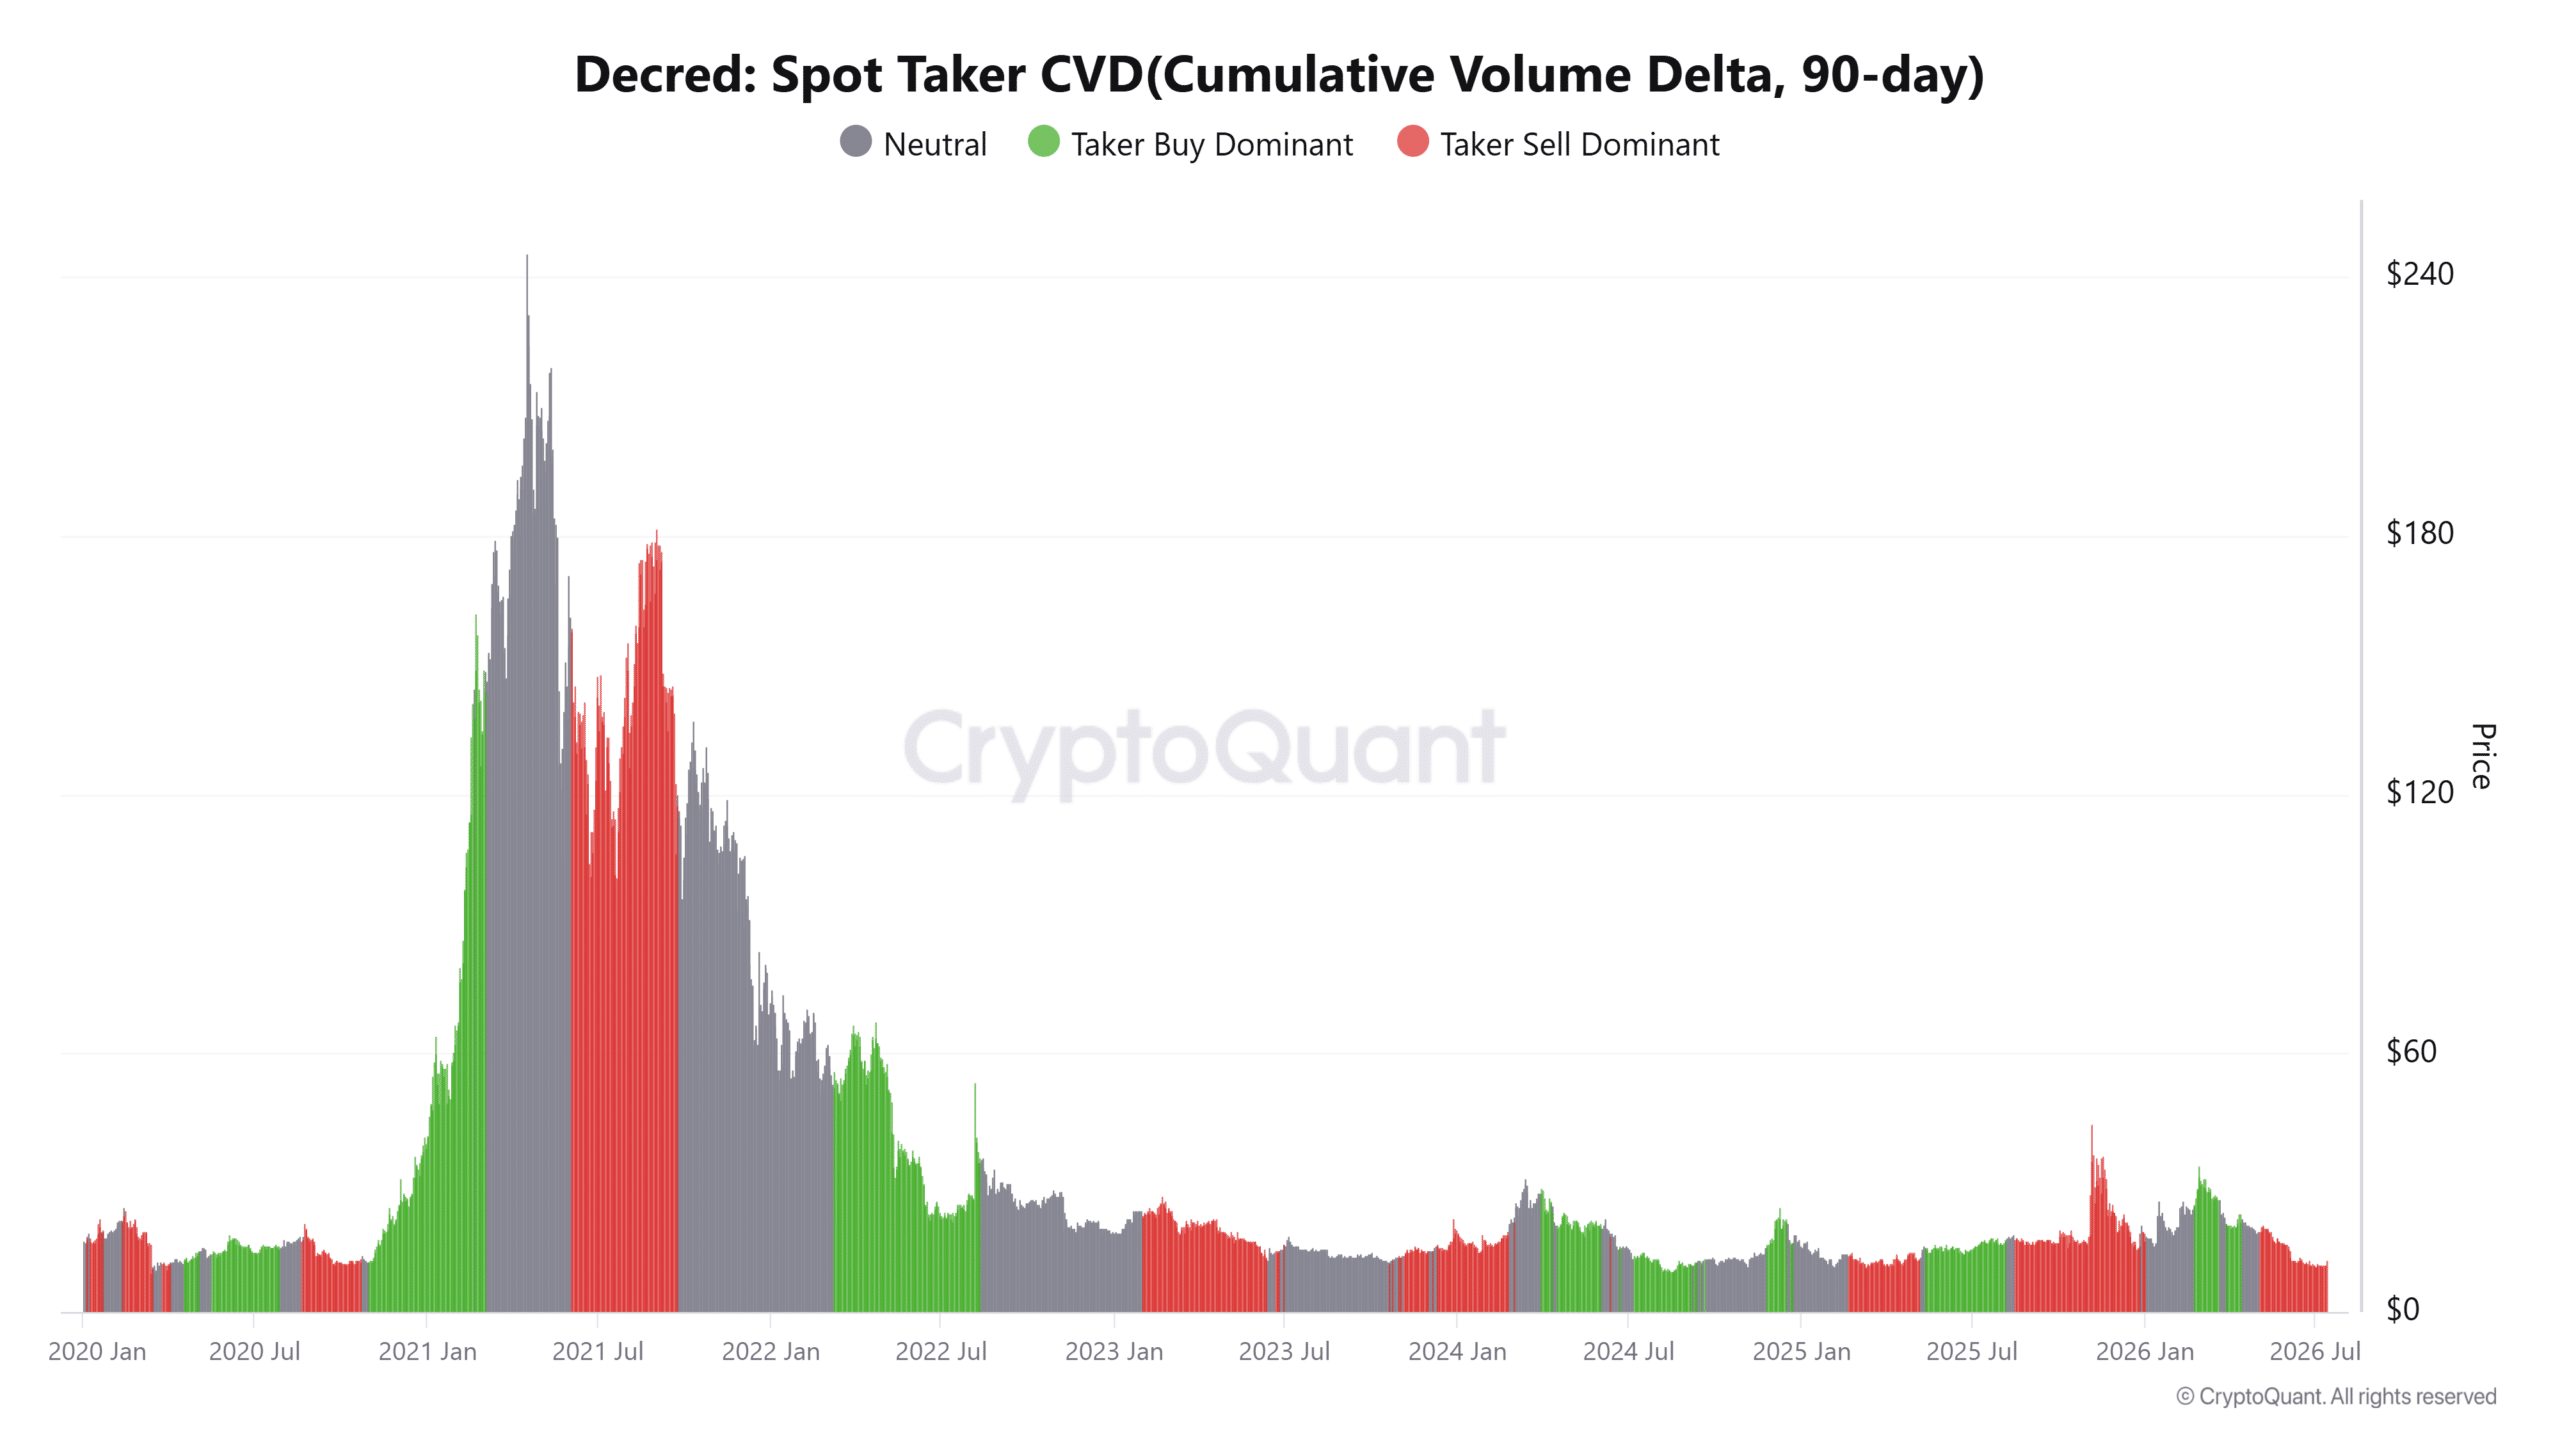
The 90-day Spot Taker Cumulative Volume Delta remained seller-dominant, indicating market sell orders continued to exceed aggressive buy orders throughout the broader period. Such a reading highlighted that sellers still entered positions even as the price advanced sharply. However, buyers absorbed much of that supply instead of allowing the rally to reverse immediately.

Such behavior often reflected improving demand because sustained buying managed to offset continuous selling pressure. Even so, the indicator showed that bullish conviction had not become one-sided. If aggressive selling continues to increase near higher price levels, DCR could face stronger resistance before extending its recovery.
Source: CryptoQuant

Large orders hinted at stronger market conviction

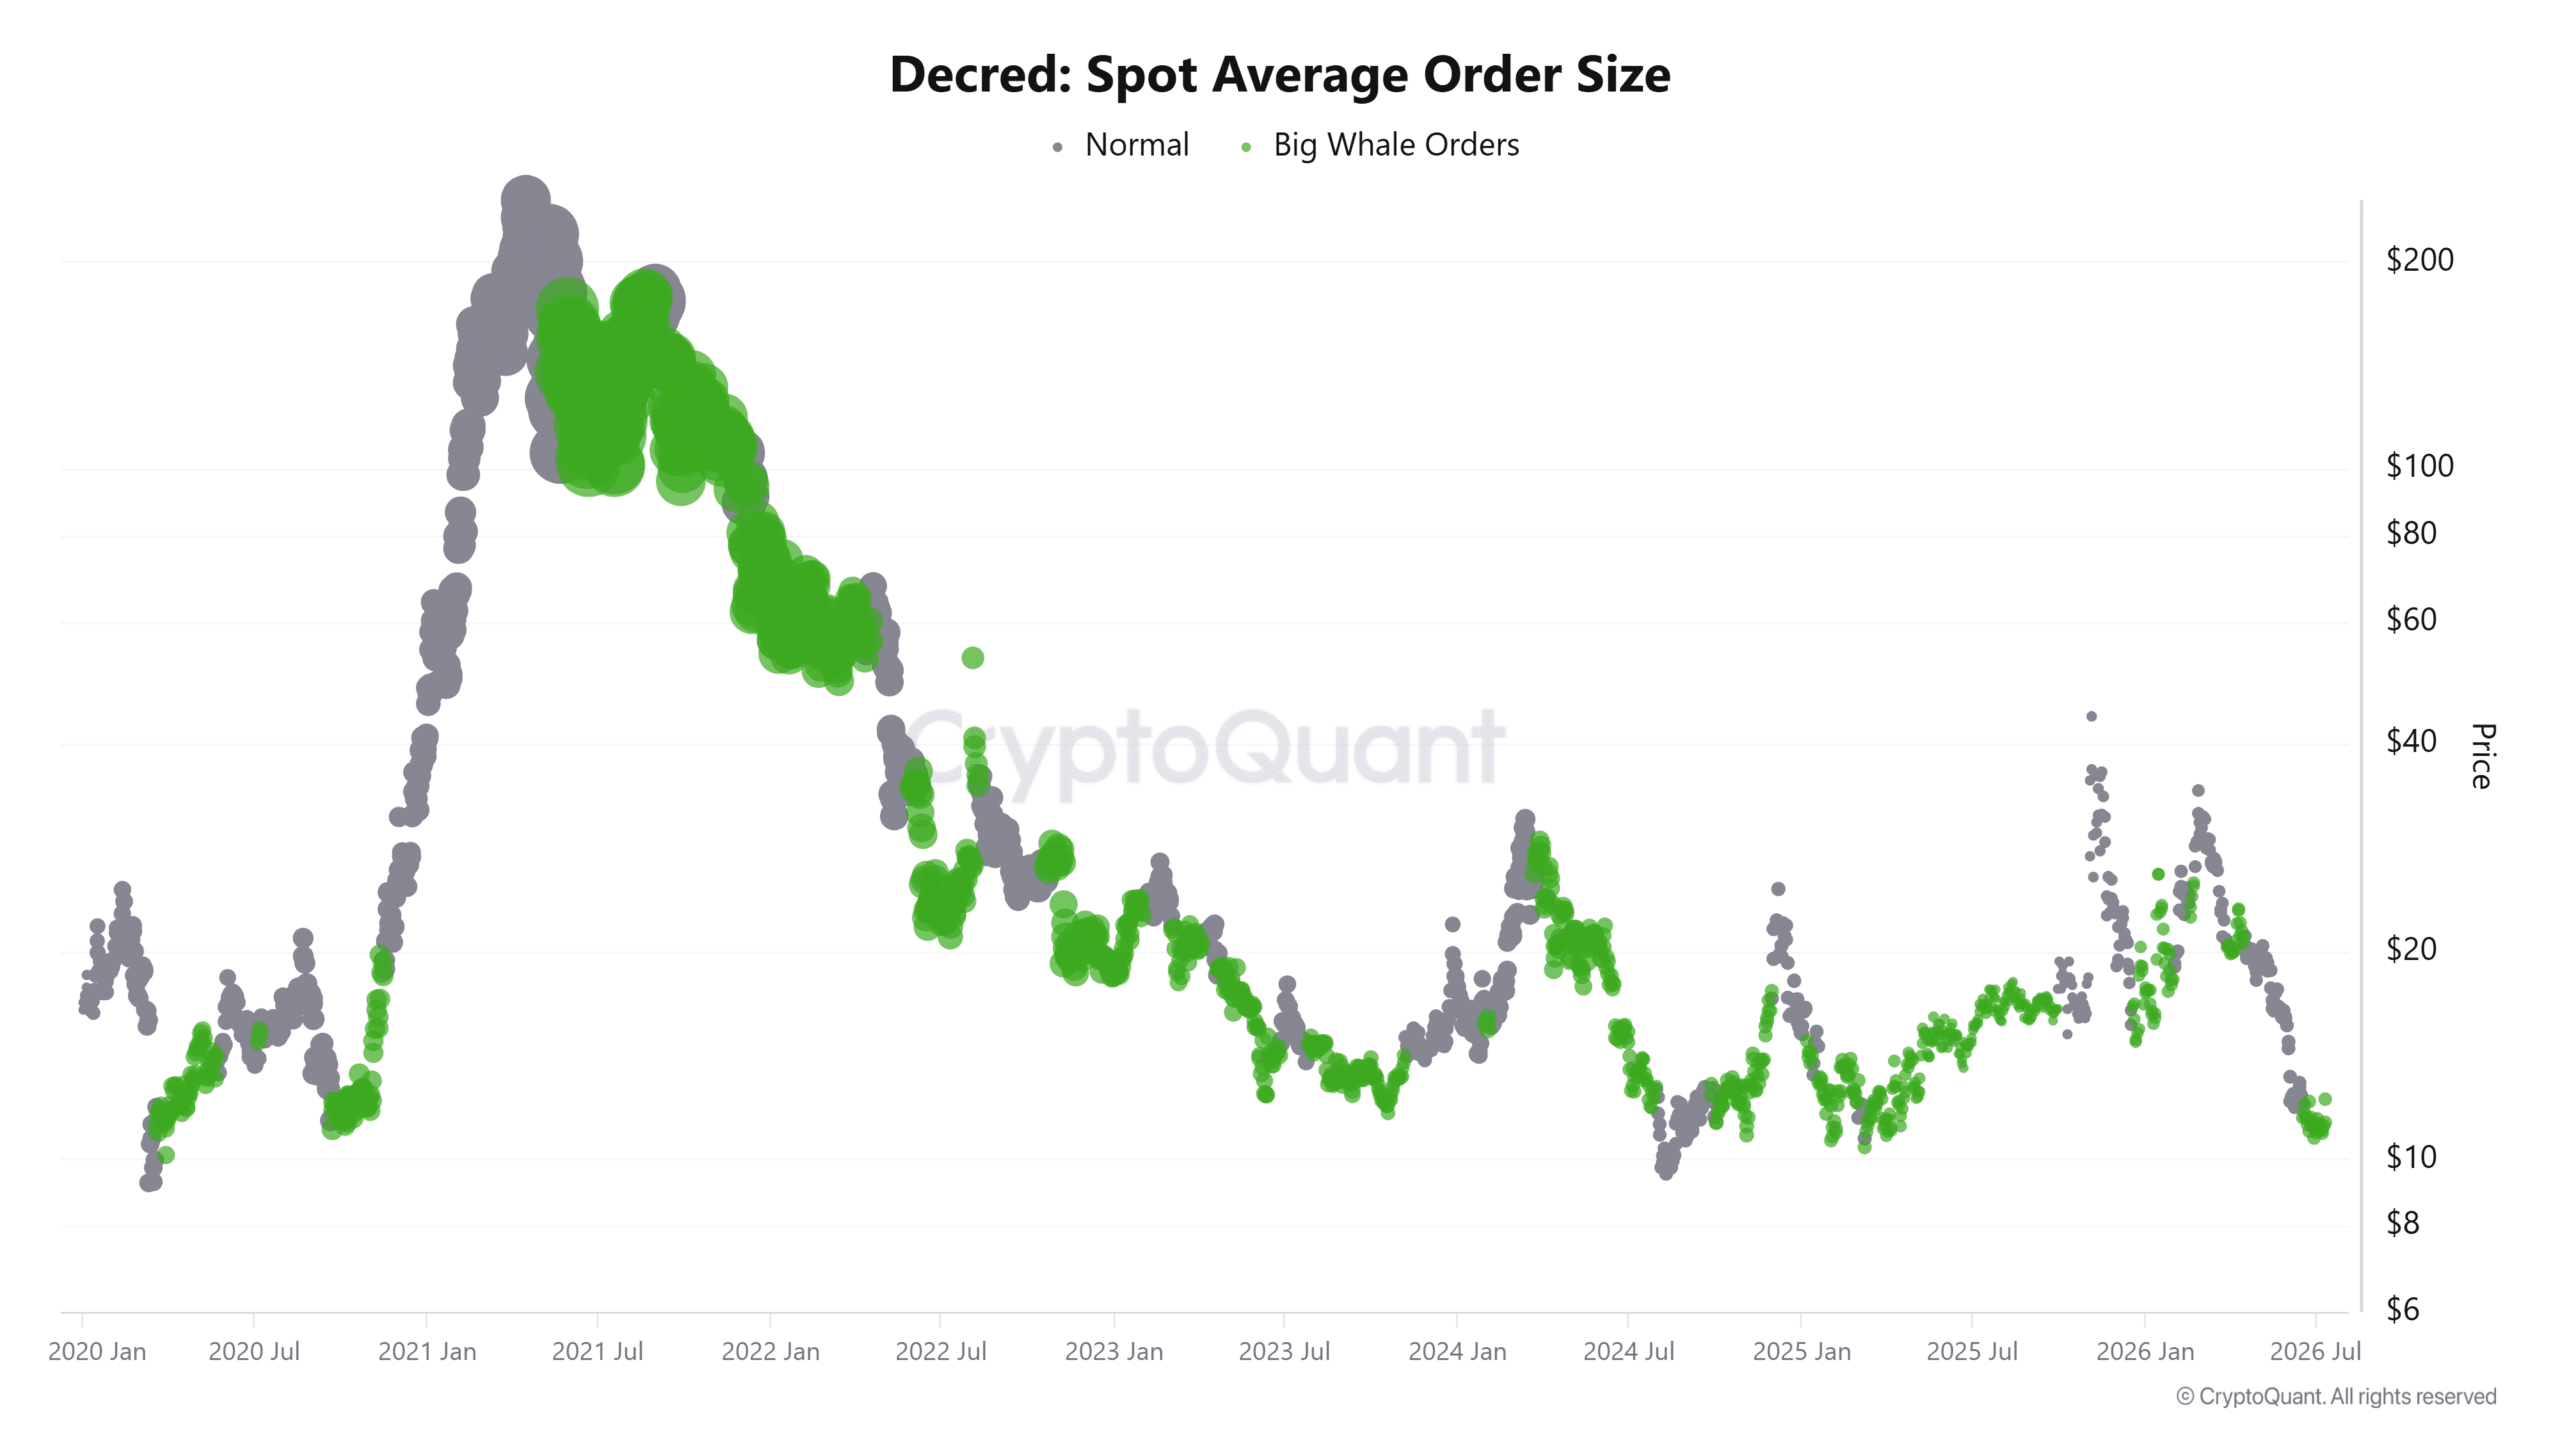
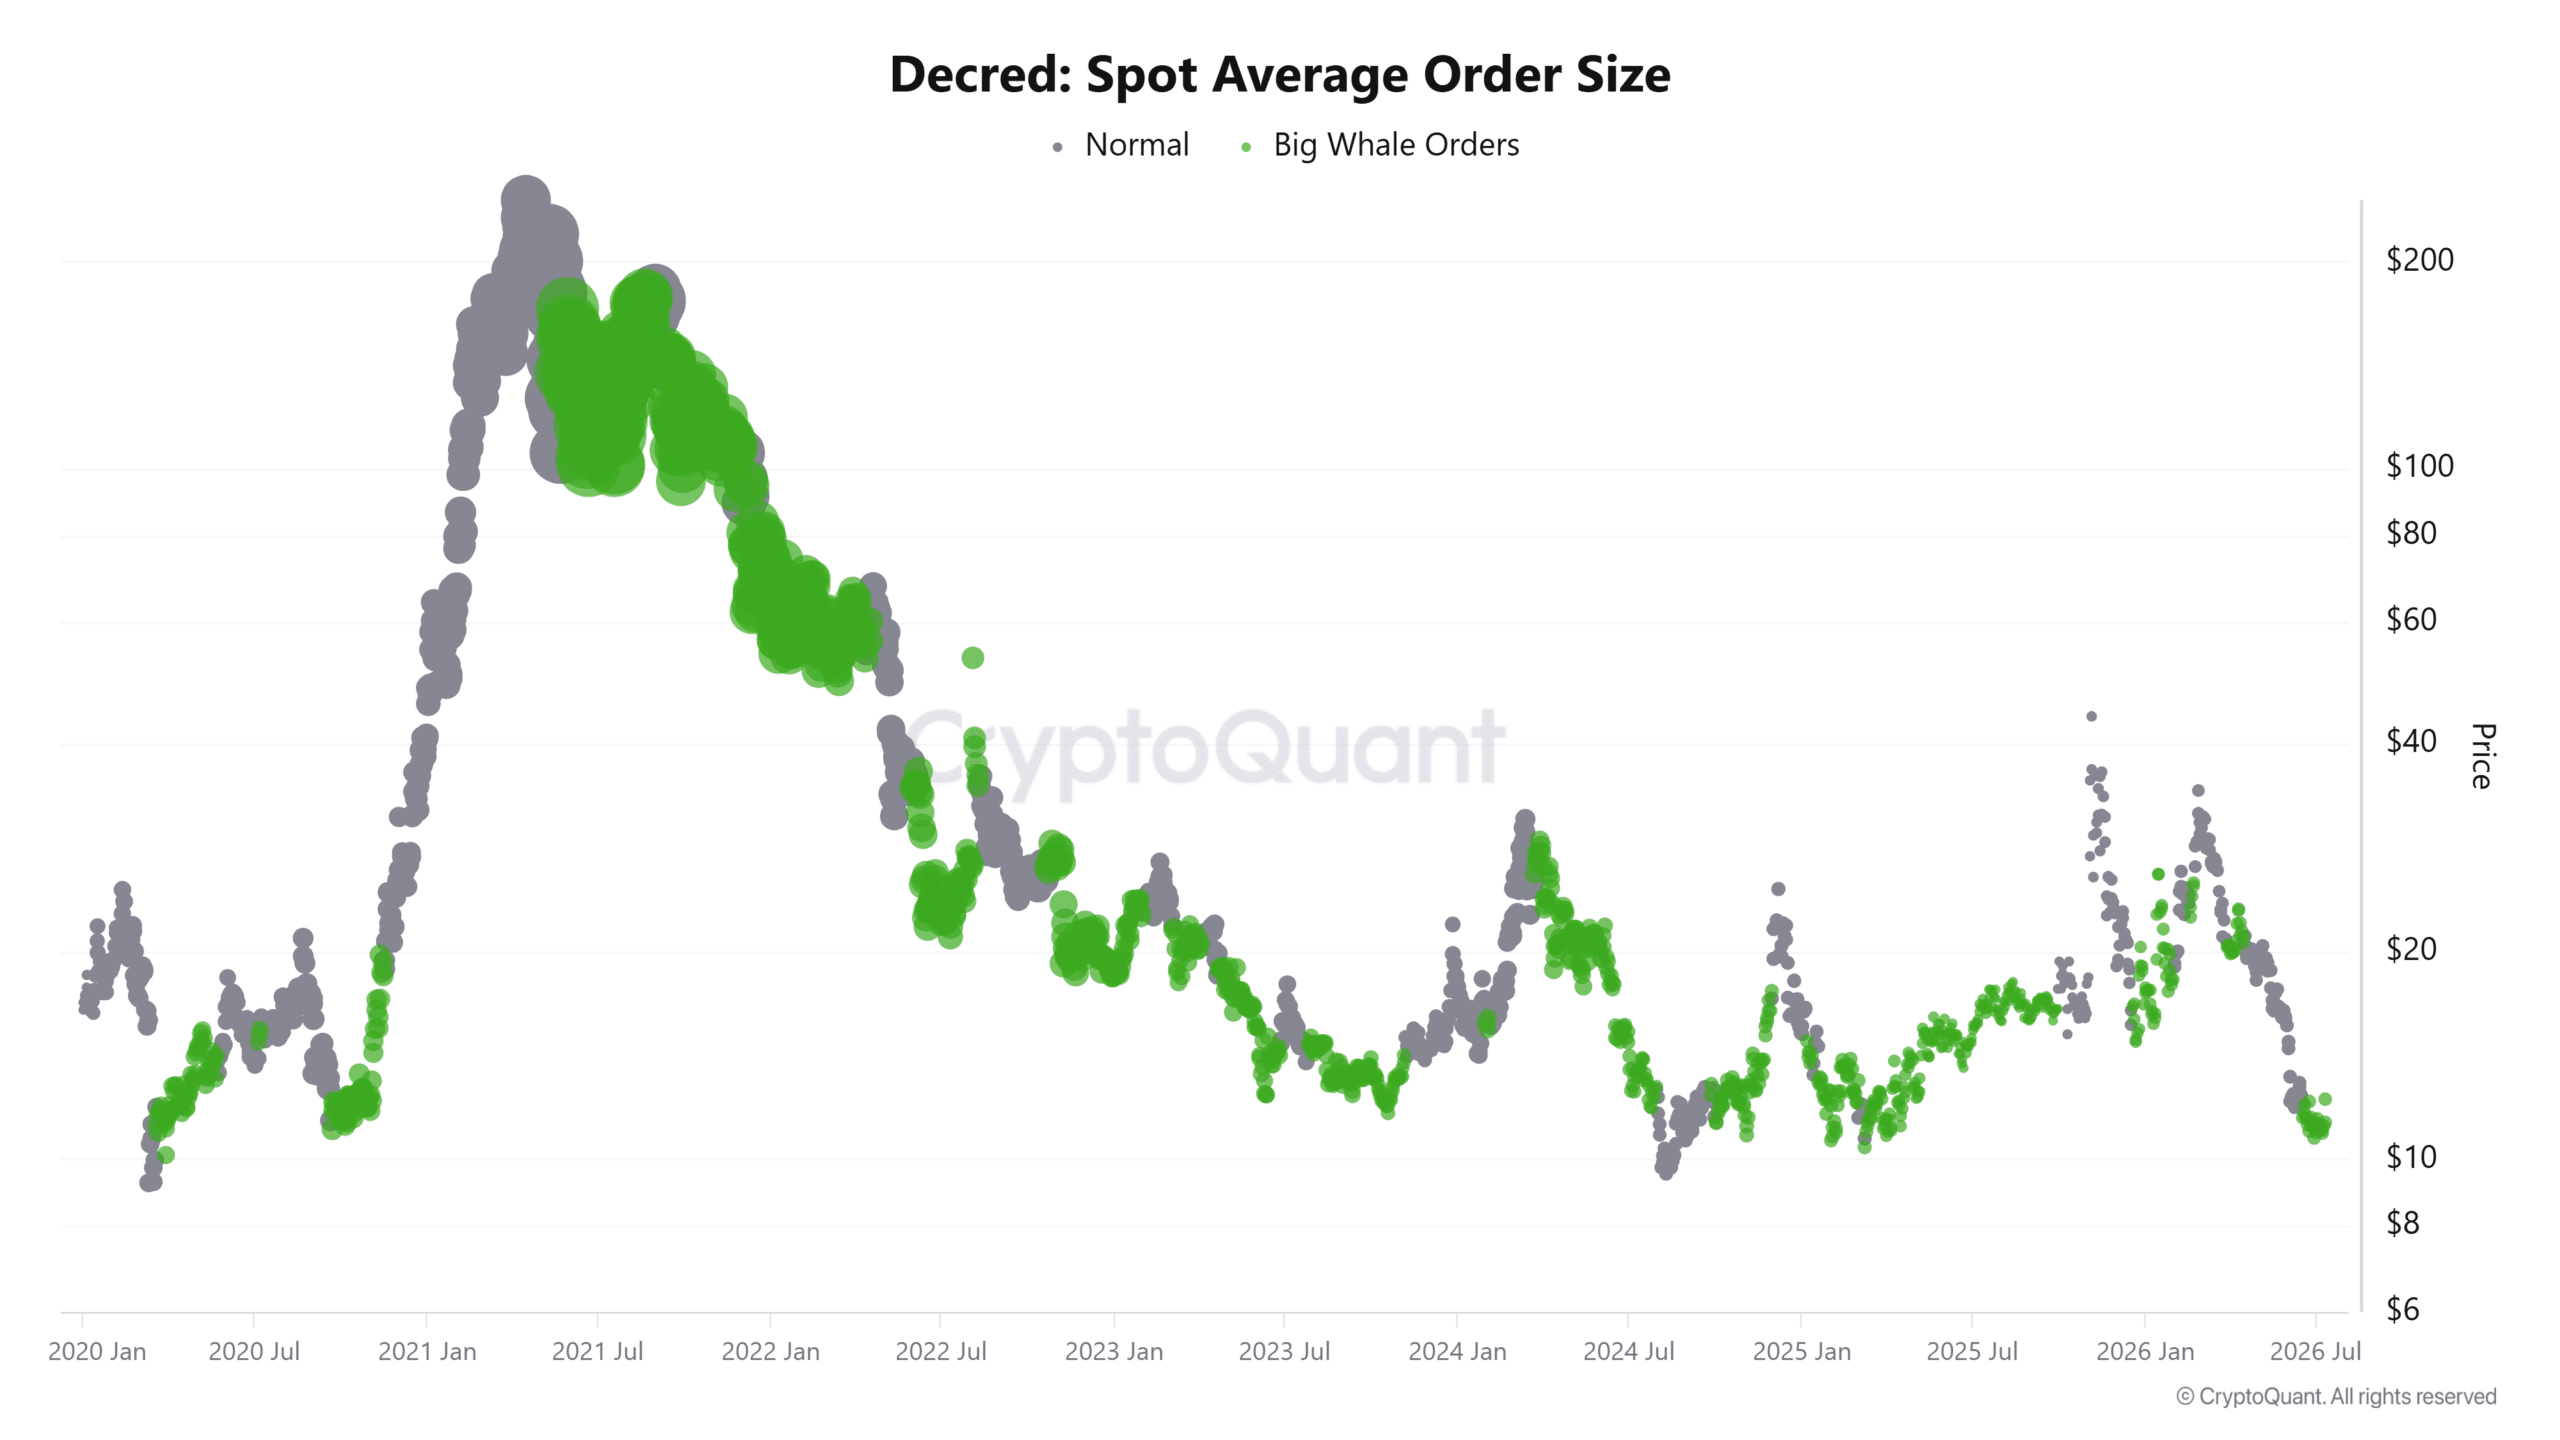
Spot Average Order Size showed the appearance of big whale orders during the rally, revealing that larger participants had become increasingly active. This development aligned with the sharp increase in trading volume instead of contradicting it.

Larger transactions generally reflected stronger capital deployment than retail-driven activity. Although the indicator did not reveal whether every order represented buying or selling, it confirmed institutional-scale participation had increased.

Such participation often carried greater influence over short-term price direction because larger orders absorbed liquidity more efficiently. As interest from bigger players expanded, Decred attracted broader market attention.

Even so, continued participation from these traders would remain necessary if buyers intend to sustain the recent advance.
Source: CryptoQuant

Channel breakout shifted DCR’s technical outlook

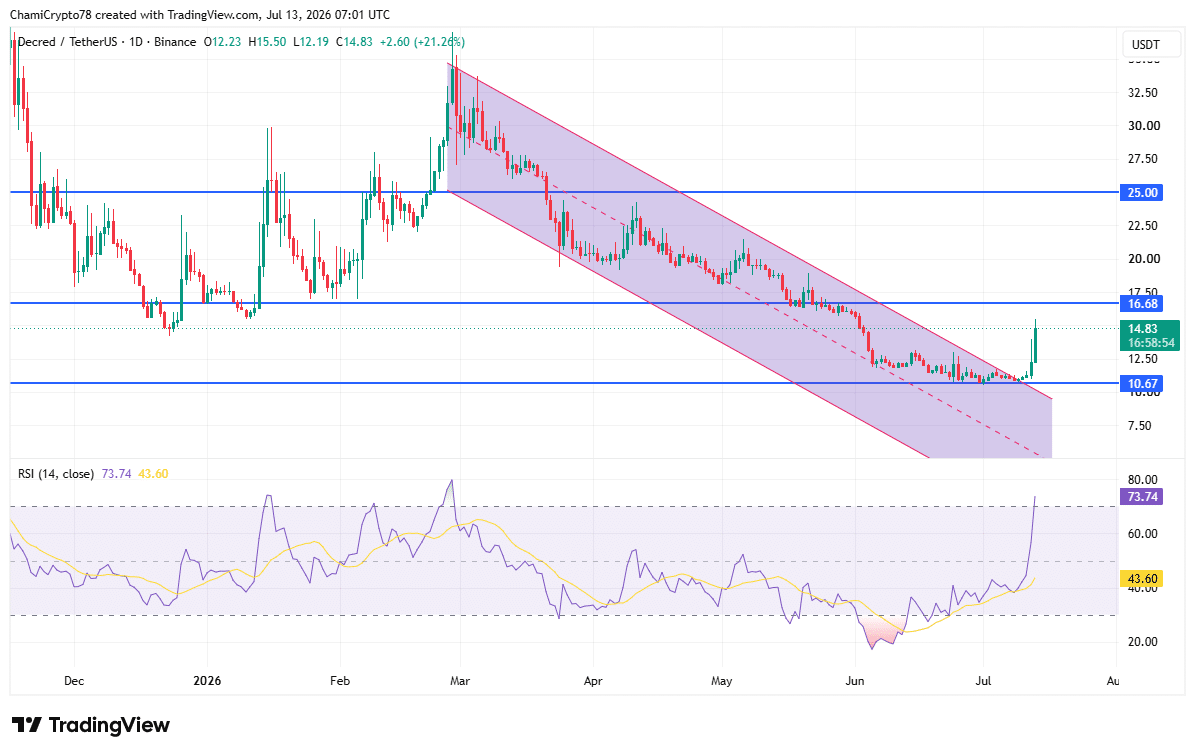
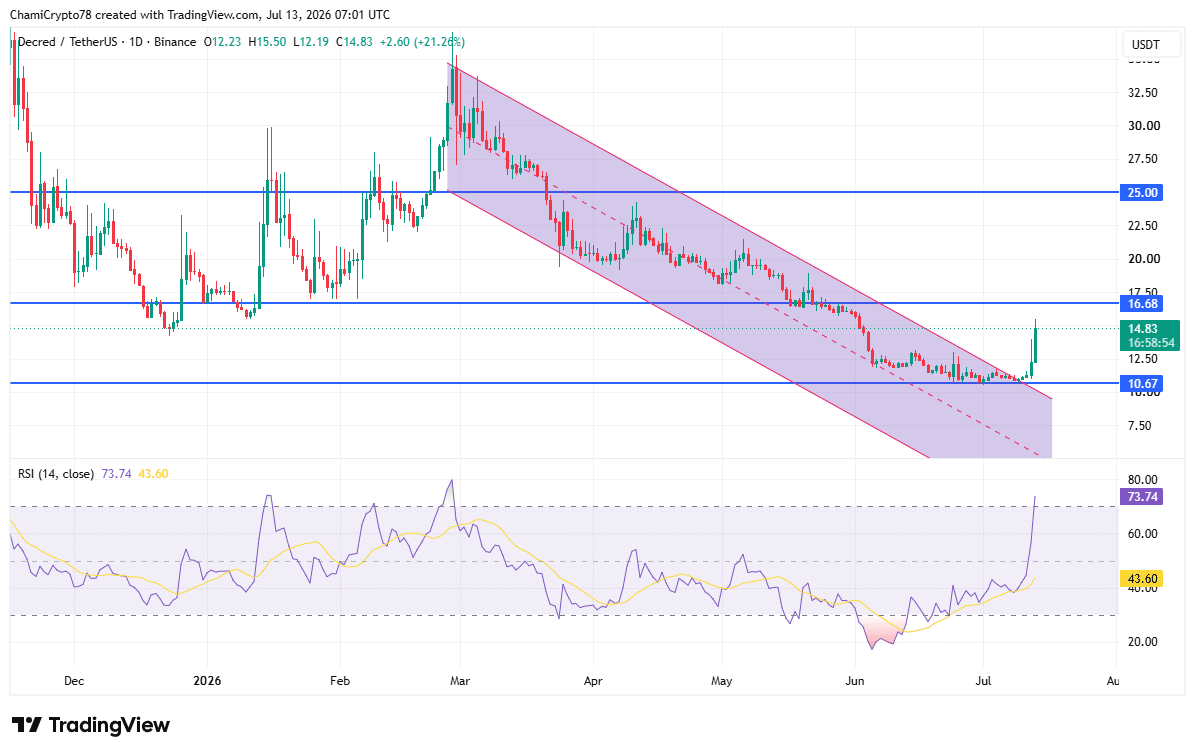
DCR broke above its multi-month descending channel after spending several months respecting lower highs and lower lows. The breakout marked the first decisive violation of the bearish structure visible on the daily chart. Price also rebounded strongly from support near $10.67 before climbing toward the next major resistance at $16.68.

Meanwhile, the Relative Strength Index reached 73.74 as of writing, placing the indicator inside the overbought territory after a sharp rise from neutral conditions. Such readings typically indicate exceptionally strong buying activity, but they also warn of potential short-term exhaustion.

Even so, the breakout remained technically significant because the price closed above the descending channel rather than rejecting from its upper boundary. If buyers defend the breakout zone, DCR could challenge $16.68. Otherwise, profit-taking could trigger a healthy pullback before another attempt higher.
Source: TradingView

Can DCR clear $16.68 next?

Decred’s breakout significantly improved its technical structure after months of sustained weakness.

Rising volume and increased whale-sized orders supported that shift, although seller dominance within Spot Taker CVD showed supply had not disappeared.

If buyers continue absorbing aggressive selling, DCR could reclaim $16.68 and strengthen the recovery. Otherwise, persistent selling pressure near resistance could slow the advance before the next directional move develops.


Final Summary

  • Decred broke its long-term downtrend while rising volume reflected renewed market participation.
  • Seller pressure persisted, yet buyers absorbed supply as DCR approached key resistance near $16.68.


Cryptos en tendance

Questions liées

QWhat were the key price and volume metrics for Decred (DCR) over the past 24 hours mentioned in the article?

ADecred (DCR) surged 24.03% over the past 24 hours. Daily trading volume jumped 400.65% to roughly $8.3 million, and its market capitalization climbed 24.07% to $242.93 million.

QWhat does the 90-day Spot Taker Cumulative Volume Delta (CVD) indicate about the market for DCR?

AThe 90-day Spot Taker Cumulative Volume Delta remained seller-dominant, indicating that market sell orders continued to exceed aggressive buy orders over the broader period. This highlights that selling pressure persisted even during the price rally.

QWhat does the increase in Spot Average Order Size for DCR suggest about market participants?

AThe increase in Spot Average Order Size suggests the appearance of big whale orders, revealing that larger participants (institutional-scale traders) had become increasingly active. This reflects stronger capital deployment and greater potential influence over short-term price direction.

QWhat was the significant technical development for DCR on the daily chart, and what are the key price levels mentioned?

ADCR broke above its multi-month descending channel, marking a decisive violation of the bearish structure. The price rebounded from support near $10.67 and is now approaching the next major resistance level at $16.68.

QAccording to the article, what are the two potential scenarios for DCR's price action after the breakout?

AIf buyers continue to absorb aggressive selling pressure, DCR could reclaim the $16.68 resistance level and strengthen the recovery. Otherwise, persistent selling pressure near that resistance could slow the advance, potentially triggering a healthy pullback before another attempt to move higher.

Lectures associées

Malgré une croissance par 10 de Zcash en un an, la société minière Fortitude n'évite pas les pertes

La société minière Fortitude Mining Holdings, détenue par Digital Currency Group de Barry Silbert et spécialisée dans l'extraction de la cryptomonnaie anonyme Zcash, fait face à des difficultés financières importantes malgré la performance de l'actif. Alors que la valeur du ZEC a connu une croissance de 1000% sur un an, Fortitude a enregistré des pertes nettes de 14,3 millions de dollars en 2024, 12,6 millions en 2025 et 4,6 millions au premier trimestre 2026. Sa position de leader supposé dans le minage de Zcash est remise en question, car 65% de ses revenus totaux de minage en 2025 (89 millions de dollars) provenaient en réalité du Bitcoin. La société a également souscrit un prêt de 26 millions de dollars en juin 2026, dont une partie avant de publier des documents aux investisseurs affirmant l'absence de dettes. Pour présenter ses résultats sous un jour plus favorable, Fortitude a mis en avant une EBITDA ajustée de 20 millions de dollars, obtenue en ajoutant environ 32 millions de dépréciation d'équipement à ses pertes nettes. Par ailleurs, son projet de fusion avec la société texane de logiciels d'IA HeartSciences, dont les revenus n'étaient que de 4000 dollars sur un an, comporte des risques, comme en témoigne la volatilité de son action. Après la fusion, le nouvel ensemble devrait être coté sous le ticker "TUDE", avec DCG conservant une majorité absolue des actions.

cryptonews.ruIl y a 1 h

Malgré une croissance par 10 de Zcash en un an, la société minière Fortitude n'évite pas les pertes

cryptonews.ruIl y a 1 h

Trading

Spot

Articles tendance

Comment acheter RE

Bienvenue sur HTX.com ! Nous vous permettons d'acheter Re (RE) de manière simple et pratique. Suivez notre guide étape par étape pour commencer votre parcours crypto.Étape 1 : Création de votre compte HTXUtilisez votre adresse e-mail ou votre numéro de téléphone pour ouvrir un compte sur HTX gratuitement. L'inscription se fait en toute simplicité et débloque toutes les fonctionnalités.Créer mon compteÉtape 2 : Choix du mode de paiement (rubrique Acheter des cryptosCarte de crédit/débit : utilisez votre carte Visa ou Mastercard pour acheter instantanément Re (RE).Solde :utilisez les fonds du solde de votre compte HTX pour trader en toute simplicité.Prestataire tiers :pour accroître la commodité d'utilisation, nous avons ajouté des modes de paiement populaires tels que Google Pay et Apple Pay.P2P :tradez directement avec d'autres utilisateurs sur HTX.OTC (de gré à gré) : nous offrons des services personnalisés et des taux de change compétitifs aux traders.Étape 3 : stockage de vos Re (RE)Après avoir acheté vos Re (RE), stockez-les sur votre compte HTX. Vous pouvez également les envoyer ailleurs via un transfert sur la blockchain ou les utiliser pour trader d'autres cryptos.Étape 4 : tradez des Re (RE)Tradez facilement Re (RE) sur le marché Spot de HTX. Il vous suffit d'accéder à votre compte, de sélectionner la paire de trading, d'exécuter vos trades et de les suivre en temps réel. Nous offrons une expérience conviviale aux débutants comme aux traders chevronnés.

246 vues totalesPublié le 2026.06.18Mis à jour le 2026.06.29

Comment acheter RE

Discussions

Bienvenue dans la Communauté HTX. Ici, vous pouvez vous tenir informé(e) des derniers développements de la plateforme et accéder à des analyses de marché professionnelles. Les opinions des utilisateurs sur le prix de RE (RE) sont présentées ci-dessous.

活动图片