Analyst: Ripple (XRP) Price Could Rise from $2 to $10 in Less Than a Year
Ripple ETF absorbed 5.6 billion XRP in less than a month, further strengthening the judgment that a price discovery phase may occur in 2026.

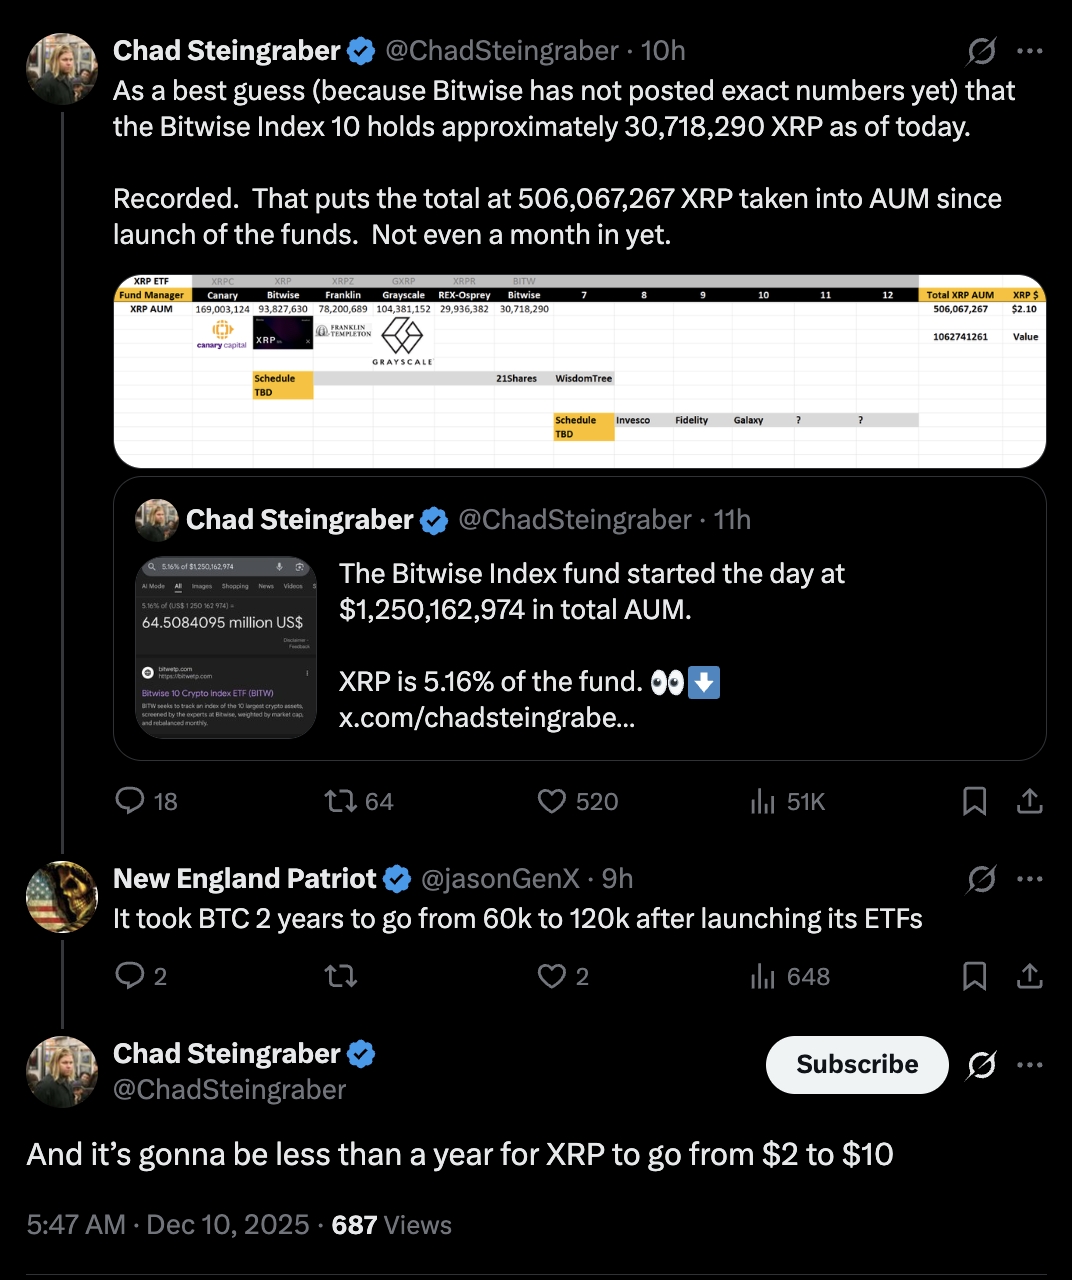
XRP (XRP) may enter a repricing phase faster than expected, with the price potentially rising "from $2 to $10" in less than a year, according to analyst Chad Steingraber's prediction.
Key Points:
XRP ETFs absorbed over 5.06 billion XRP in one month, supporting the $10 price expectation.
Two major chart patterns point to an upward target of $14-15.
ETF Demand Provides Basis for 400% XRP Surge in 2026
Steingraber's prediction comes after the new Ripple open-ended index funds (ETFs) launched in November received strong early attention.
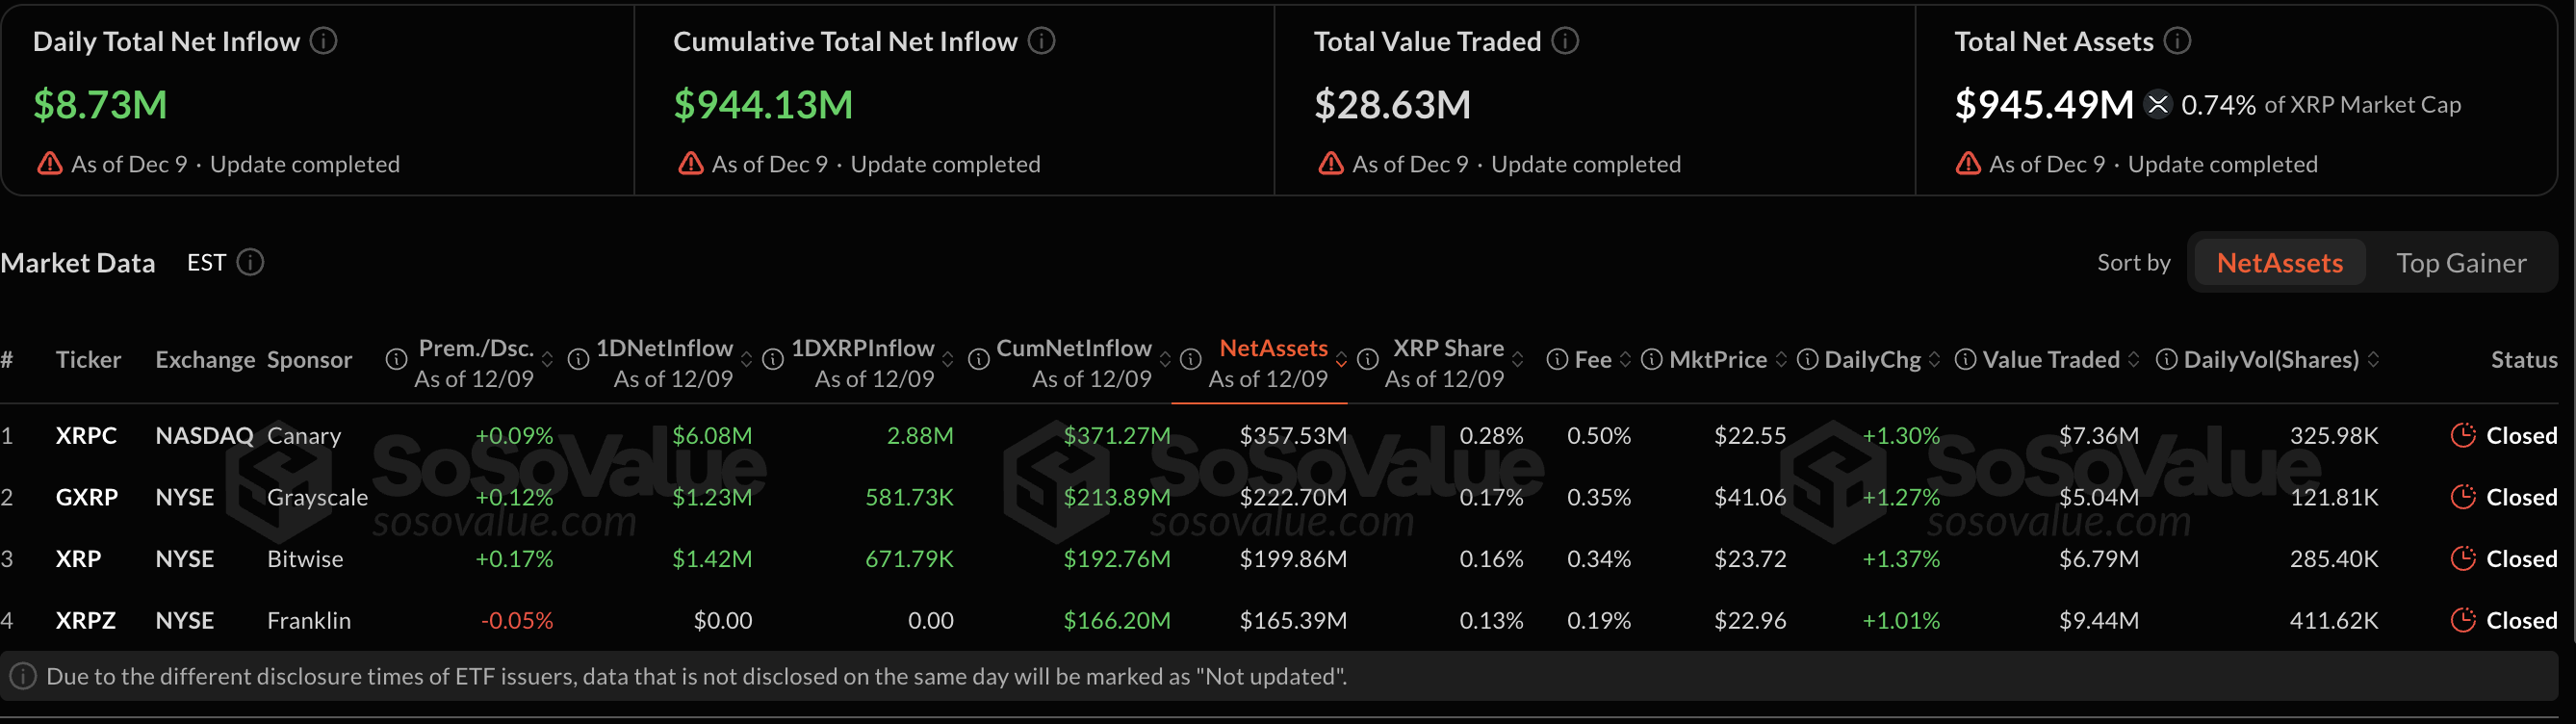
According to SoSoValue data, these investment products have absorbed over $9.44 billion worth of Ripple since going live on November 13. This means the ETFs currently hold about 0.74% of all XRP, a considerable scale for funds less than a month old.
The analyst also pointed to XRP's role in the newly launched Bitwise Crypto 10 Fund ETF (BITW). The fund opened on Tuesday with assets exceeding $1.25 billion, with XRP comprising 5% of its investment portfolio.
"As a best guess (since Bitwise hasn't released exact figures), the Bitwise Index 10 holds approximately 30,718,290 XRP as of today," Steingraber stated in a Wednesday X post, adding:
"This brings the total XRP absorbed into AUM since the fund's launch to 506,067,267 XRP. In less than a month."
Noting that Bitcoin doubled within two years after its U.S. ETF debut, Steingraber believes Ripple still has catching up to do. If ETF fund flows continue to accumulate, the token could accelerate towards the $10 mark in 2026, a gain of about 400%.
XRP Technical Setup Supports Price Exceeding $10
From a technical perspective, XRP's charts also align with Steingraber's bullish view.
On the two-week chart, the token has entered the breakout phase of its multi-month symmetrical triangle, a pattern that typically appears after prolonged consolidation phases and often预示 (foreshadows) a strong trend continuation.
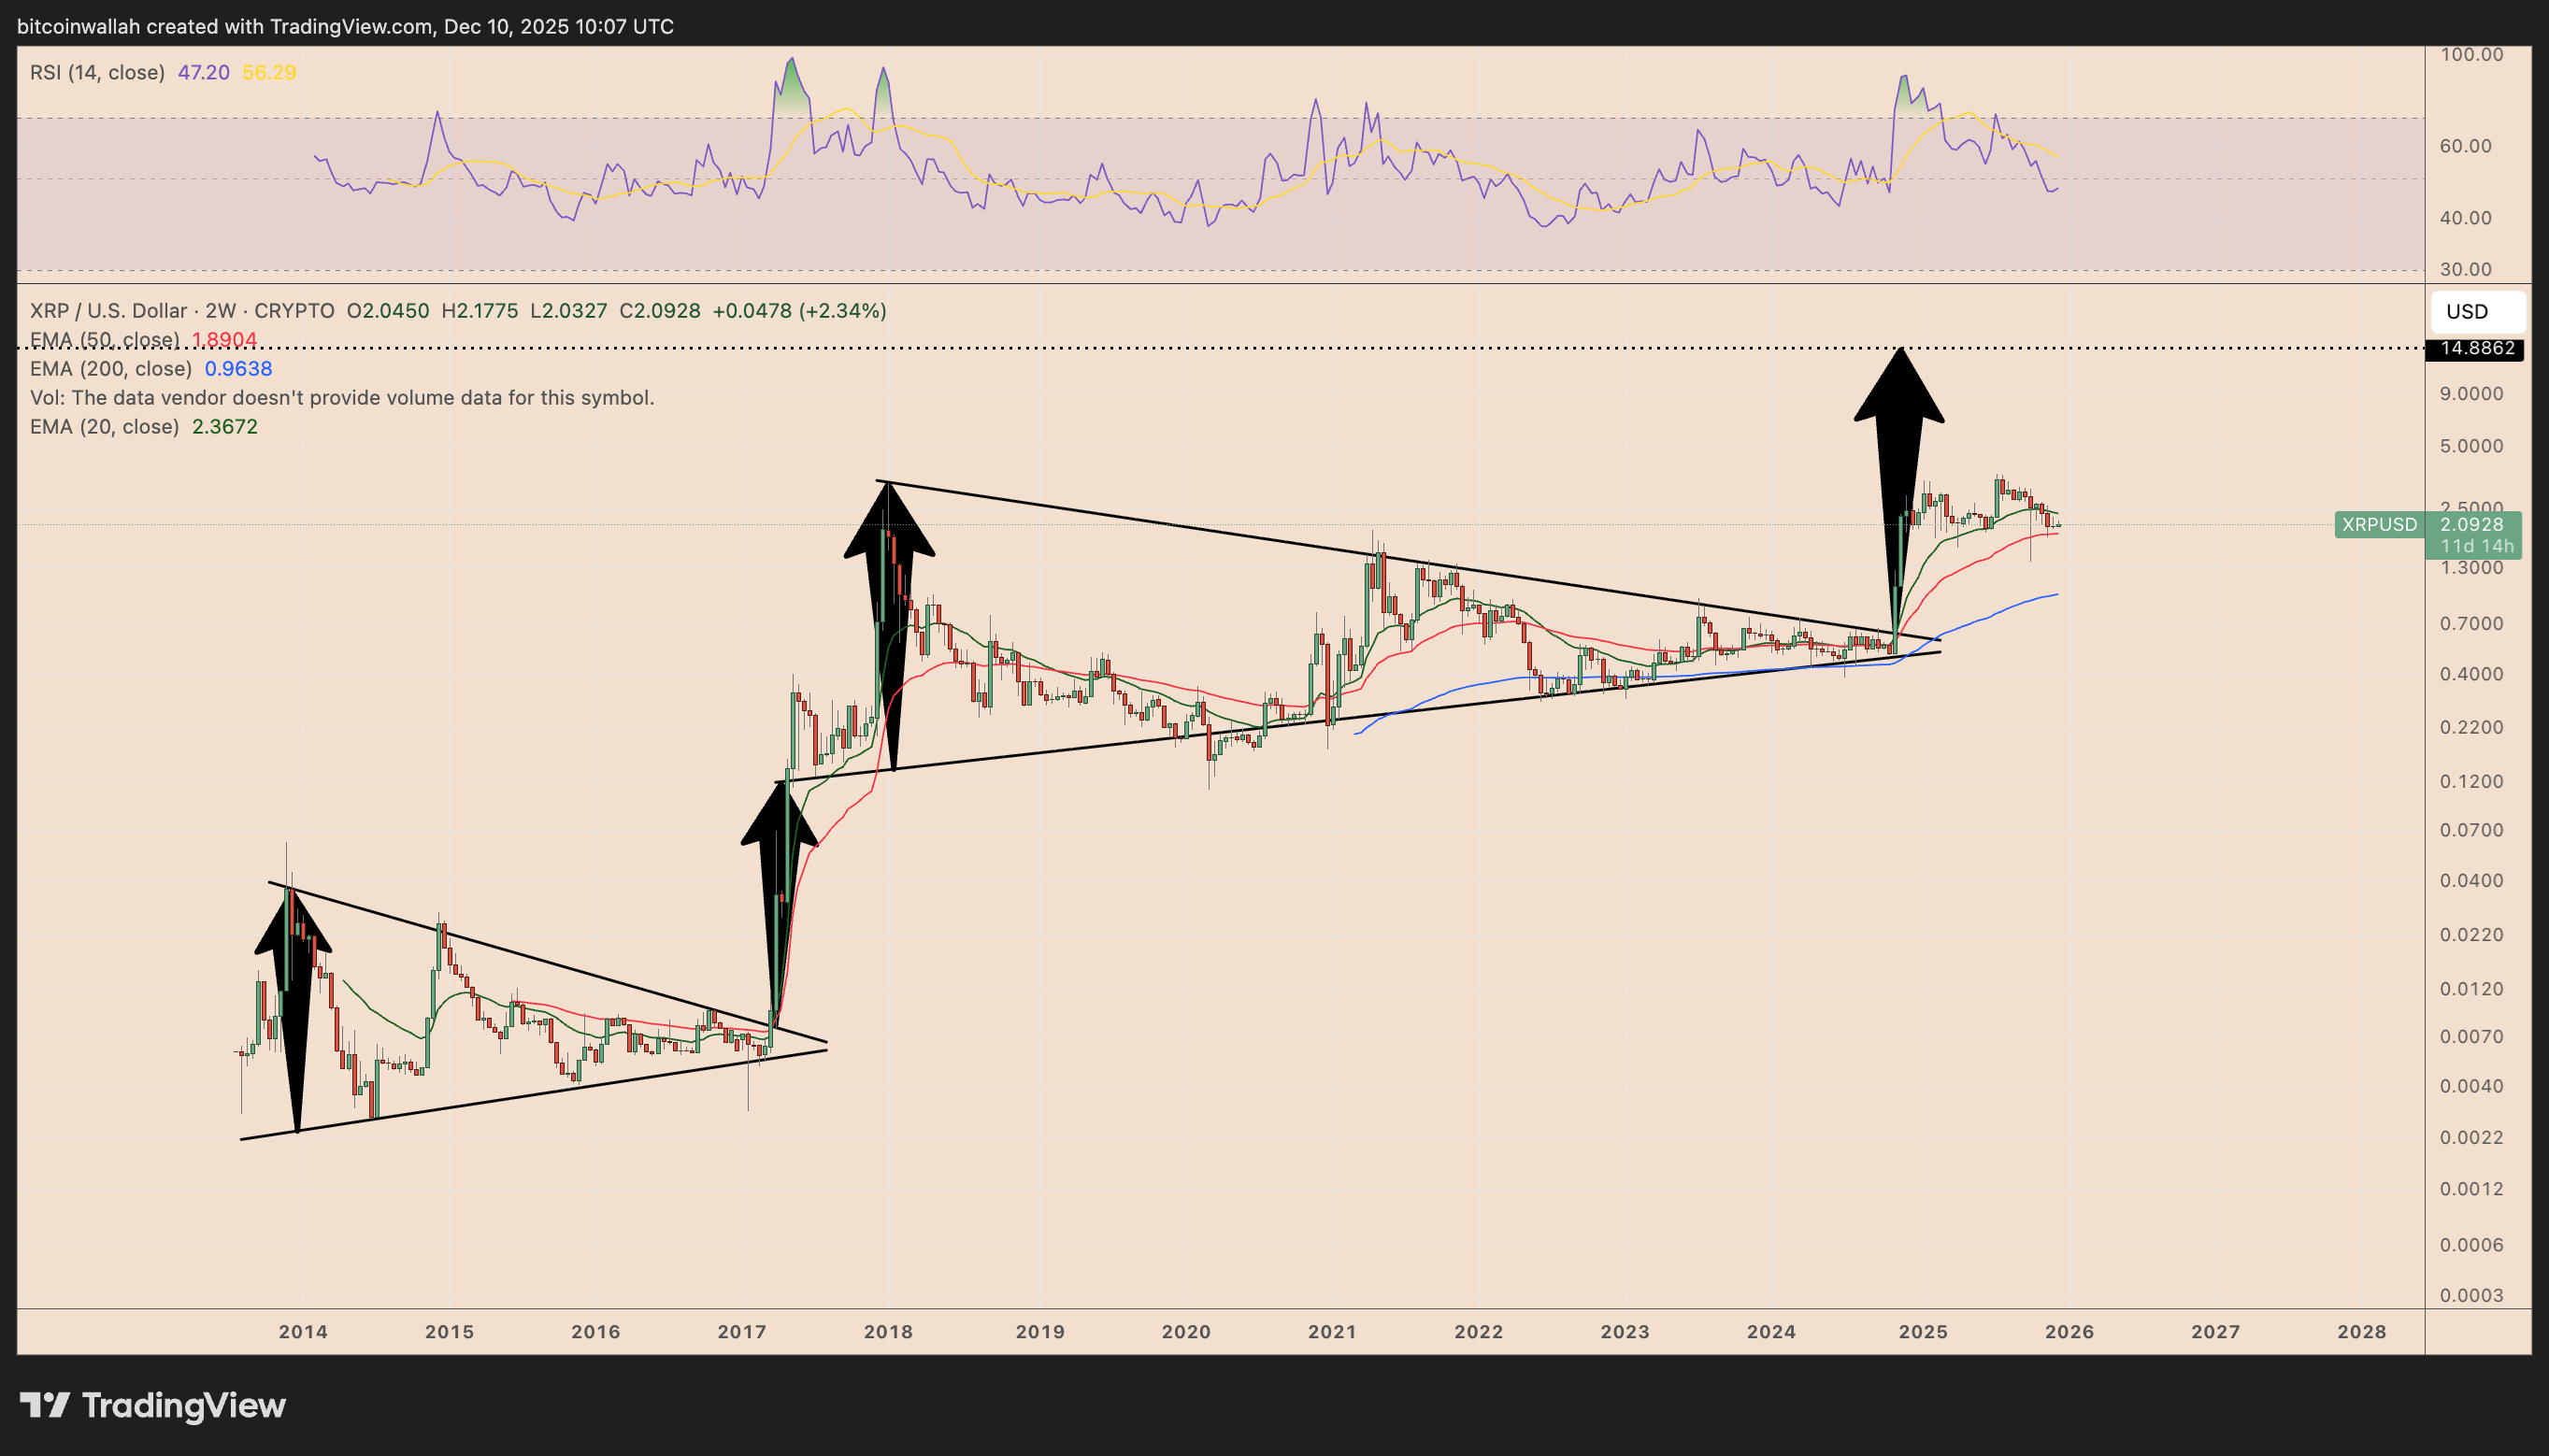
Breaking above the triangle's upper trendline indicates buyers are regaining control, with the structure's measured move pointing towards $14-15 in the coming months.
A second setup reinforces the same target range. On a higher timeframe, XRP appears to have formed a bull flag, a classic continuation pattern that typically emerges after a strong initial rally and is accompanied by a downward-sloping consolidation channel.
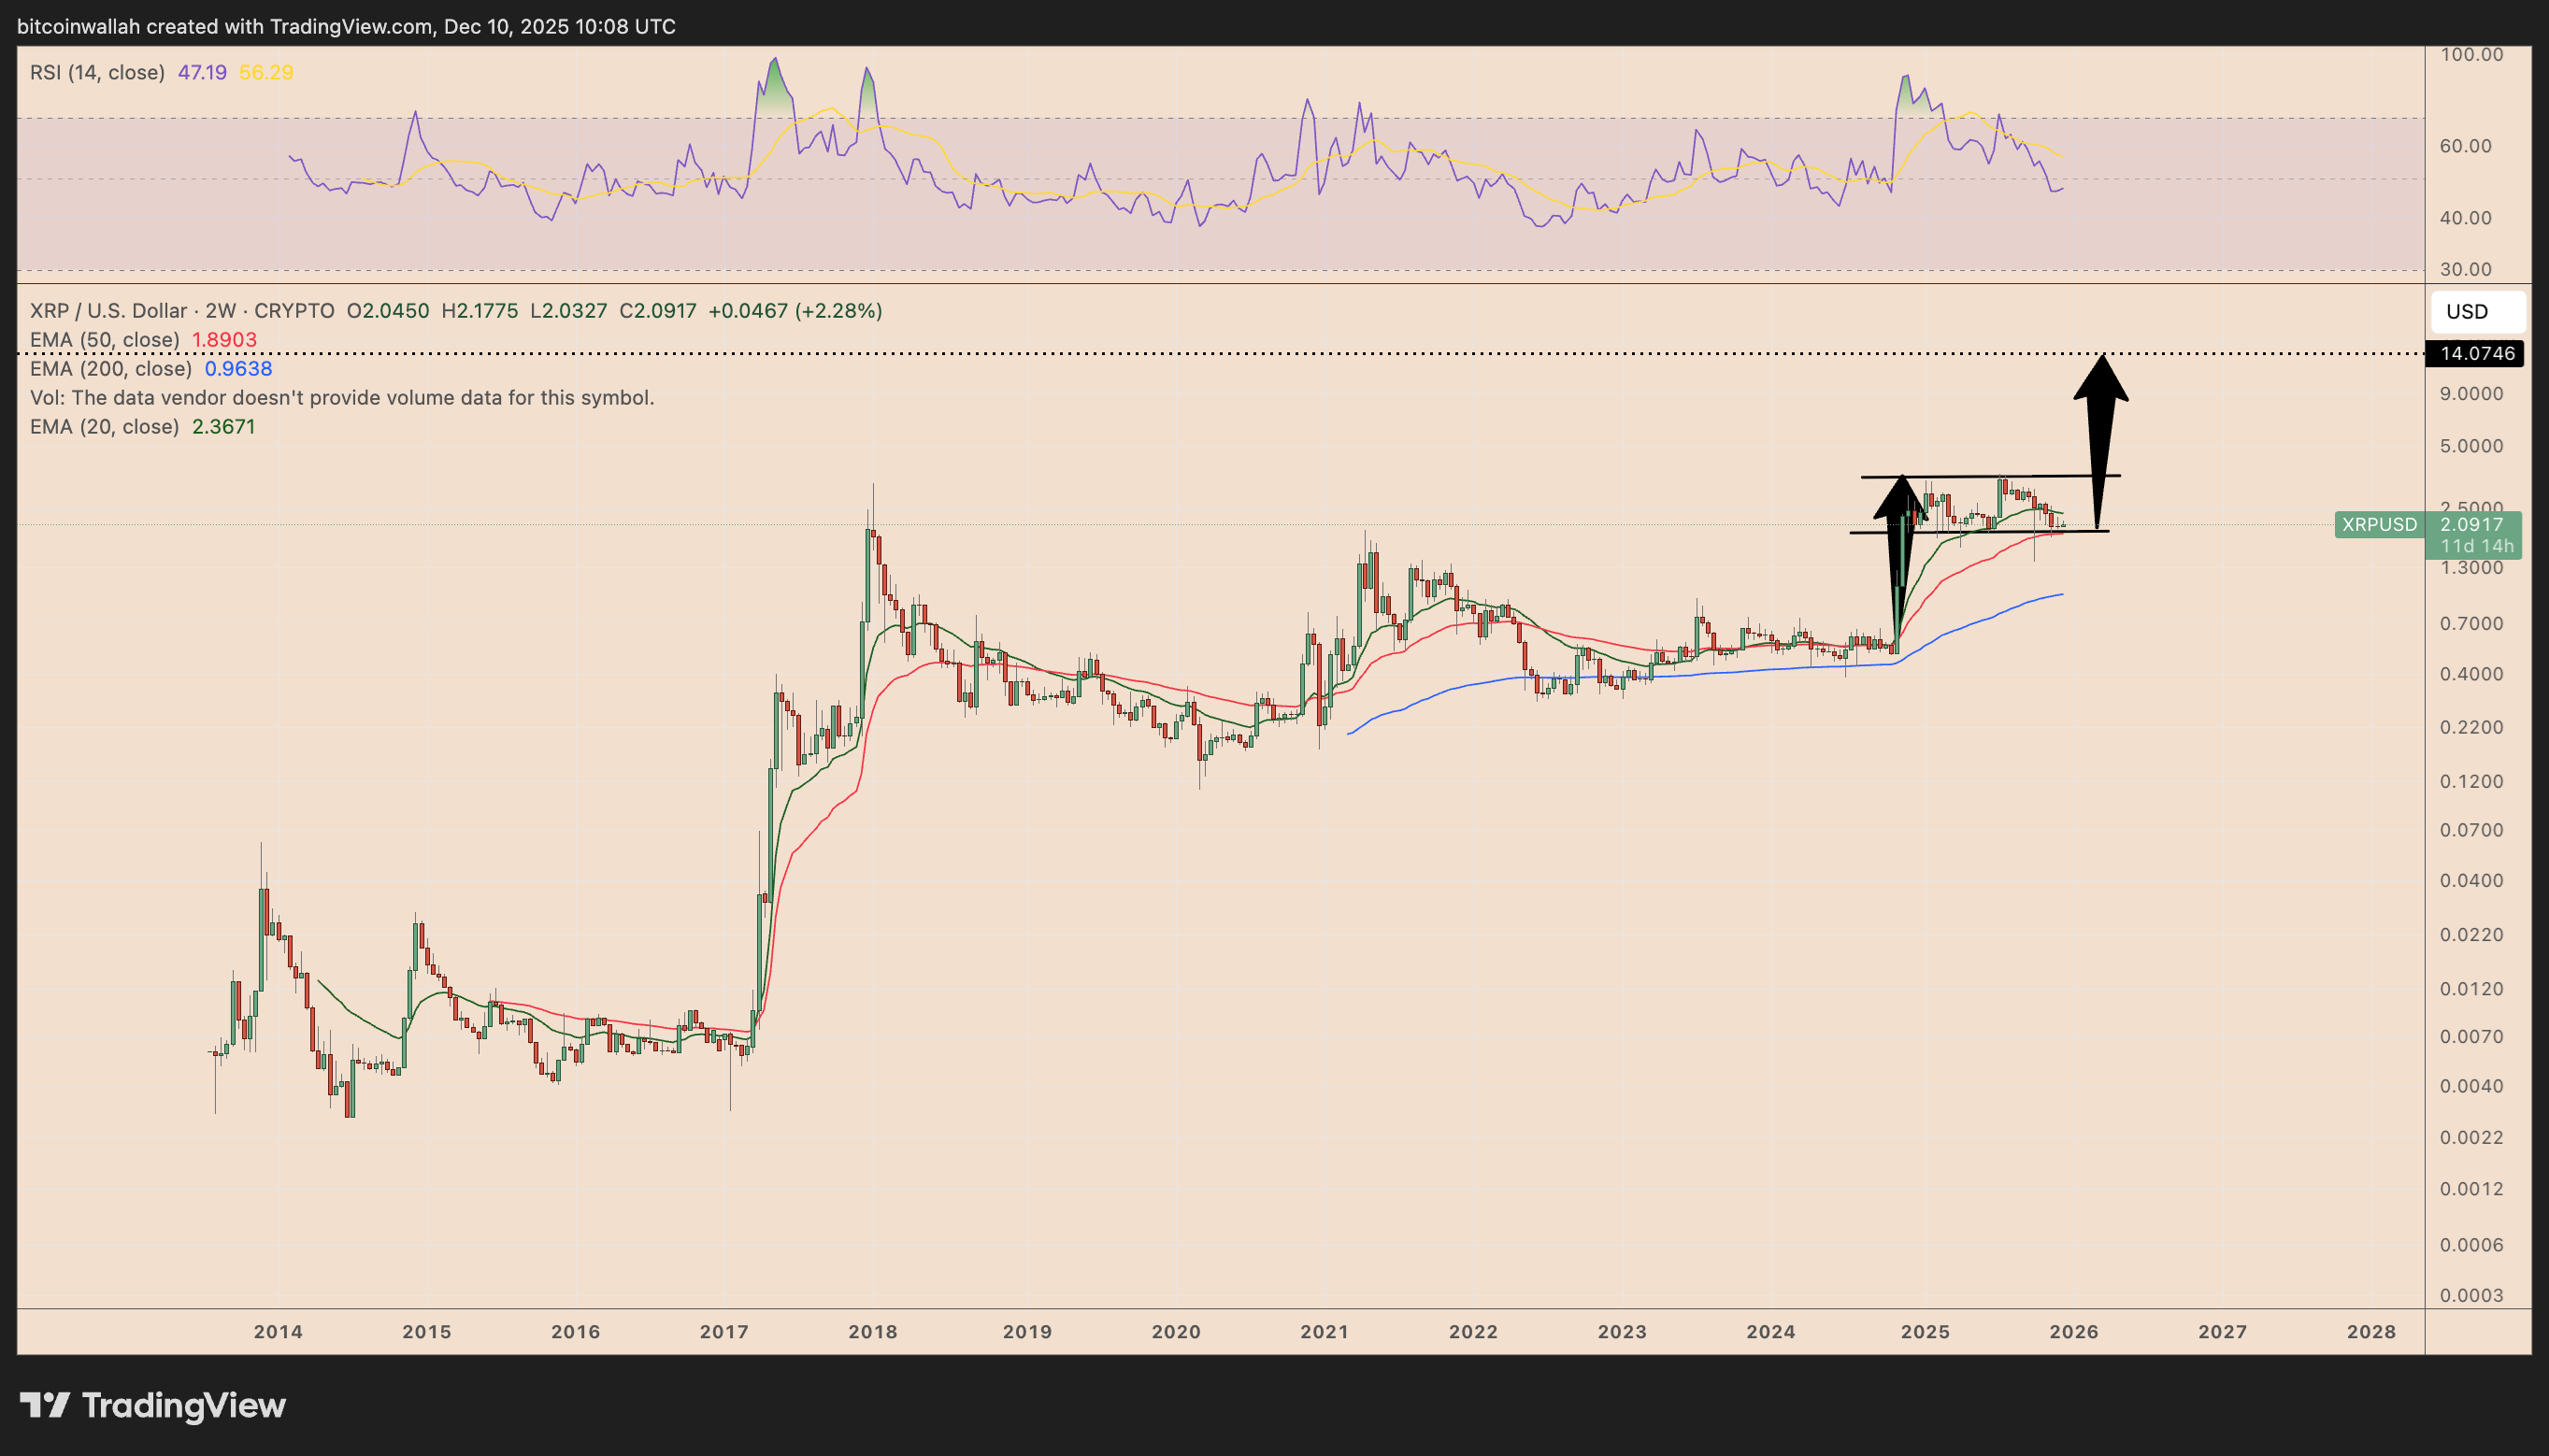
If XRP confirms a breakout above the flag's resistance, the structure's projected move also points to the $14-15 area, consistent with the triangle's target.
Related Recommendation: Bitcoin's (BTC) year-end push towards $100,000 depends largely on the outcome of the Fed's policy shift.
This article does not contain investment advice or recommendations. Every investment and trading move involves risk, and readers should conduct their own research when making a decision. Although we strive to provide accurate and timely information, Cointelegraph does not guarantee the accuracy, completeness, or reliability of any information in this article. This article may contain forward-looking statements that are subject to risks and uncertainties. Cointelegraph is not responsible for any losses or damages resulting from reliance on this information.