XRP at a Critical Juncture: Stagnating Before Strong Resistance - Will It Break Through or Plummet?

金色财经Pubblicato 2025-12-12Pubblicato ultima volta 2025-12-12

Introduzione

XRP price has initiated a fresh decline after falling below the $2.080 and $2.050 support levels. It is currently trading below $2.050 and the 100-hour Simple Moving Average, showing signs of weakness near the $2.040 resistance area. A descending trend line is forming with resistance near $2.040 on the hourly chart. Key support levels are identified at $2.00 and $1.9850. A break below $2.00 could lead to further declines toward $1.920 and possibly $1.880. On the upside, immediate resistance is near $2.040, followed by major hurdles at $2.080 and $2.150. A close above $2.080 might initiate a move toward $2.1850 and $2.220. Technical indicators show the hourly MACD is losing momentum in the bearish zone, while the RSI is above 50. The market remains at a critical juncture, with the potential for either an upward breakout or further downside movement.

Article Source: WeChat Official Account Miao Jie Trading Diary

XRP price started a new decline after breaking below $2.080. The current price action is weak, facing resistance near the $2.040 level.

  • XRP price started a new decline after breaking below the $2.050 zone.

  • The price is currently below $2.050 and the 100-hour Simple Moving Average.

  • A descending trend line is forming on the XRP/USD hourly chart with resistance near $2.040 (data source: Kraken).

  • The pair could extend its decline if it breaks below $2.00.

XRP Price Hovers Near Resistance

XRP price attempted a recovery wave above $2.150 but failed to continue higher, unlike Bitcoin and Ethereum. Subsequently, the price started a new decline, breaking below $2.080 and $2.050.

The price broke below the $2.00 support and formed a low near $1.993 before starting a recovery correction. There was a move above the 23.6% Fib retracement level of the downward move from the $2.177 high to the $1.993 low.

However, bears were active near $2.040 and $2.050. A descending trend line is also forming with resistance near $2.040 on the hourly chart of XRP/USD. The price is now below $2.050 and the 100-hour Simple Moving Average.

If there is another increase, the price might face resistance near $2.040. The first major resistance is near $2.080 or the 50% Fib retracement level of the downward move from the $2.177 high to the $1.993 low.
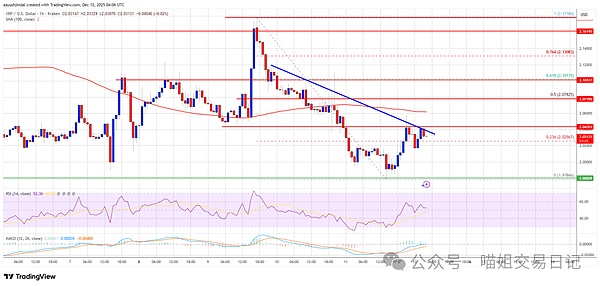
A close above $2.080 could push the price toward $2.012. The next resistance sits at $2.150. A clear move above the $2.150 resistance might send the price toward the $2.1850 resistance. Further gains could lead the price toward the $2.220 resistance. The next major resistance for the bulls could be near $2.250.

Another Decline?

If XRP fails to clear the $2.040 resistance, it could start another decline. Initial support on the downside is near $2.00. The next major support is near $1.9880.

If the price breaks below the $1.9880 level and closes below it, it could continue to move down toward $1.920. The next major support is near $1.880, below which the price might test $1.820.

Technical Indicators

Hourly MACD – The MACD for XRP/USD is now losing pace in the bearish zone.

Hourly RSI (Relative Strength Index) – The RSI for XRP/USD is now above the 50 level.

Major Support Levels – $2.00 and $1.9850.

Major Resistance Levels – $2.040 and $2.080.

Crypto di tendenza

Domande pertinenti

QWhat is the current resistance level that XRP is struggling to break above?

AXRP is currently facing resistance near the $2.040 level, where a descending trend line is forming on the hourly chart.

QWhat key support level could trigger another decline if broken?

AA break below the $2.00 support level could trigger another decline, with the next major support located near $1.9850.

QWhat was the high point from which the recent decline to $1.993 began?

AThe recent decline began from a high of $2.177 before dropping to the $1.993 low.

QWhat are the two major technical indicators mentioned and what are their current signals?

AThe hourly MACD is accelerating in the bearish zone, while the hourly RSI is currently above the 50 level.

QWhat price must XRP close above to start a potential rally towards $2.120?

AA close above the $2.080 resistance level is needed for XRP to start a potential rally towards $2.120 and higher.

Letture associate

Bitcoin Is Ready for "Parabolic Growth". Is Altseason Upon Us?

Amid a general market uptrend, experts are discussing the potential start of an 'altcoin season', where major cryptocurrencies could outpace Bitcoin's growth. This follows Bitcoin surpassing $81,000, predictions of a new bull market, and a capital shift from AI stocks toward Bitcoin and gold. Since August 17th, the crypto market has risen over 22%, primarily driven by Bitcoin (BTC) and Ethereum (ETH), which gained 25% and 30% respectively, reaching highs last seen in May. Analysts suggest the Bitcoin bear cycle has ended, anticipating a historically strong rally, with renewed institutional demand for cryptocurrency ETFs. BitMEX founder Arthur Hayes, in a recent interview, declared the start of a new bull market, predicting Bitcoin could quickly reach "hundreds of thousands" of dollars. Market observers interpret this as an expectation for 'parabolic growth.' Signs of a bull market revival include Bitcoin ETFs re-entering the top 10 most-traded ETFs, displacing some AI-focused funds. Analysts at CryptoQuant note capital is flowing from Bitcoin into riskier altcoins, with their bull market indicators showing the most optimistic signals since October 2025. However, the reality is more nuanced. The current surge is a rebound from yearly lows; Bitcoin's price is still down nearly 40% from its October peak. The Altcoin Season Index has dropped to 39 from 67 in early August, and Bitcoin's dominance remains around 60%, indicating investor focus is still on Bitcoin rather than altcoins. Experts predict the market is entering a phase where project fundamentals and real revenue, rather than speculation, will increasingly determine asset value.

cryptonews.ru1 h fa

Bitcoin Is Ready for "Parabolic Growth". Is Altseason Upon Us?

cryptonews.ru1 h fa

Trading

Spot

Articoli Popolari

Come comprare PURR

Benvenuto in HTX.com! Abbiamo reso l'acquisto di Hyperliquid Strategies Inc. (PURR) semplice e conveniente. Segui la nostra guida passo passo per intraprendere il tuo viaggio nel mondo delle criptovalute.Step 1: Crea il tuo Account HTXUsa la tua email o numero di telefono per registrarti il tuo account gratuito su HTX. Vivi un'esperienza facile e sblocca tutte le funzionalità,Crea il mio accountStep 2: Vai in Acquista crypto e seleziona il tuo metodo di pagamentoCarta di credito/debito: utilizza la tua Visa o Mastercard per acquistare immediatamente Hyperliquid Strategies Inc.PURR.Bilancio: Usa i fondi dal bilancio del tuo account HTX per fare trading senza problemi.Terze parti: abbiamo aggiunto metodi di pagamento molto utilizzati come Google Pay e Apple Pay per maggiore comodità.P2P: Fai trading direttamente con altri utenti HTX.Over-the-Counter (OTC): Offriamo servizi su misura e tassi di cambio competitivi per i trader.Step 3: Conserva Hyperliquid Strategies Inc. (PURR)Dopo aver acquistato Hyperliquid Strategies Inc. (PURR), conserva nel tuo account HTX. In alternativa, puoi inviare tramite trasferimento blockchain o scambiare per altre criptovalute.Step 4: Scambia Hyperliquid Strategies Inc. (PURR)Scambia facilmente Hyperliquid Strategies Inc. (PURR) nel mercato spot di HTX. Accedi al tuo account, seleziona la tua coppia di trading, esegui le tue operazioni e monitora in tempo reale. Offriamo un'esperienza user-friendly sia per chi ha appena iniziato che per i trader più esperti.

132 Totale visualizzazioniPubblicato il 2026.08.21Aggiornato il 2026.08.21

Come comprare PURR

Come comprare PDD

Benvenuto in HTX.com! Abbiamo reso l'acquisto di PDD Holdings, Inc. (PDD) semplice e conveniente. Segui la nostra guida passo passo per intraprendere il tuo viaggio nel mondo delle criptovalute.Step 1: Crea il tuo Account HTXUsa la tua email o numero di telefono per registrarti il tuo account gratuito su HTX. Vivi un'esperienza facile e sblocca tutte le funzionalità,Crea il mio accountStep 2: Vai in Acquista crypto e seleziona il tuo metodo di pagamentoCarta di credito/debito: utilizza la tua Visa o Mastercard per acquistare immediatamente PDD Holdings, Inc.PDD.Bilancio: Usa i fondi dal bilancio del tuo account HTX per fare trading senza problemi.Terze parti: abbiamo aggiunto metodi di pagamento molto utilizzati come Google Pay e Apple Pay per maggiore comodità.P2P: Fai trading direttamente con altri utenti HTX.Over-the-Counter (OTC): Offriamo servizi su misura e tassi di cambio competitivi per i trader.Step 3: Conserva PDD Holdings, Inc. (PDD)Dopo aver acquistato PDD Holdings, Inc. (PDD), conserva nel tuo account HTX. In alternativa, puoi inviare tramite trasferimento blockchain o scambiare per altre criptovalute.Step 4: Scambia PDD Holdings, Inc. (PDD)Scambia facilmente PDD Holdings, Inc. (PDD) nel mercato spot di HTX. Accedi al tuo account, seleziona la tua coppia di trading, esegui le tue operazioni e monitora in tempo reale. Offriamo un'esperienza user-friendly sia per chi ha appena iniziato che per i trader più esperti.

67 Totale visualizzazioniPubblicato il 2026.08.24Aggiornato il 2026.08.24

Come comprare PDD

Cosa è JP225

Il più rappresentativo indice azionario del Giappone, composto da 225 titoli blue-chip quotati alla Borsa di Tokyo, copre principali settori come la manifattura, la tecnologia e la finanza. È stato pubblicato continuamente dal 1950 e funge da riferimento fondamentale per misurare le performance complessive del mercato azionario giapponese.

37 Totale visualizzazioniPubblicato il 2026.08.25Aggiornato il 2026.08.25

Cosa è JP225

Discussioni

Benvenuto nella Community HTX. Qui puoi rimanere informato sugli ultimi sviluppi della piattaforma e accedere ad approfondimenti esperti sul mercato. Le opinioni degli utenti sul prezzo di A A sono presentate come di seguito.

活动图片