What Does Ethena's Trend Reveal About the Cryptocurrency Market?

marsbitPubblicato 2026-03-09Pubblicato ultima volta 2026-03-09

Introduzione

The article analyzes the perpetual futures market structure and risk sentiment in the cryptocurrency market using Ethena's transparency dashboard as a key indicator. It reveals that Ethena's deployed capital has dropped to $791 million, only 71% of its 2025 low and 12.9% of its peak, reflecting extremely low net long demand in the market. A key insight is that directional long positions are nearly equal to directional short positions—a rare and historically unsustainable balance in crypto. The analysis breaks down perpetual contract holders into four categories: directional longs, directional shorts (including hedgers), basis traders (like Ethena), and arbitrageurs. Ethena’s role as a basis trader provides a proxy for excess long demand. The sharp decline in its deployed capital—over 60% since February 2026—suggests either the unwinding of unprofitable basis trades, increased hedging activity from directional shorts, or weak leveraged long demand. Current negative funding rates and stable open interest indicate growing short or hedge demand, possibly from VC firms and crypto companies managing risk in a bearish market. This equilibrium between longs and shorts is unusual and may signal a market regime change, though it remains uncertain whether this balance can persist.

Article Author: Kyle Soska

Article Translation: Block unicorn

The cryptocurrency market has been in a risk-off state for several consecutive months, and I have been carefully studying various market data, looking for signs of a potential market turnaround. In this article, I will delve into the market structure of perpetual futures and, combined with data from the Ethena transparency dashboard, analyze market risk appetite.

In short: Ethena's deployed capital is at a multi-year low, only 71% of the 2025 low. This is not a criticism of Ethena, but rather a reflection of the current market conditions. Directional short positions are almost on par with directional long positions, an extremely rare and historically unsustainable balance in the cryptocurrency space.

The cryptocurrency market has long been characterized by the extreme volatility of its assets and the heavy use of leverage by traders. My previous research, "Understanding Cryptocurrency Derivatives: The BitMEX Case Study," explored the novel 100x perpetual contracts offered on BitMEX.

Since the BitMEX era, cryptocurrency futures have become the highest-volume product in the cryptocurrency market, with trading volumes 5 to 20 times that of the spot market. As a center for leveraged trading for retail investors, perpetual contracts can reflect the risk appetite of the cryptocurrency market and are therefore worthy of our attention.

Ethena provides us with an extremely unique perspective, allowing us to gain deep insights into the cryptocurrency derivatives market. As shown in the figure below, Ethena implements a cryptocurrency arbitrage trade. The strategy is simple: when cryptocurrency traders go long, Ethena acts as their counterparty and goes short. Ethena ensures it buys exactly the same amount of assets as the traders are shorting. In a sense, Ethena provides a leverage service. Traders want to profit from rising cryptocurrency prices but lack capital; while Ethena has capital but limited risk tolerance. Therefore, traders use perpetual contracts to borrow funds from Ethena at the basis plus the funding cost of the perpetual contract.
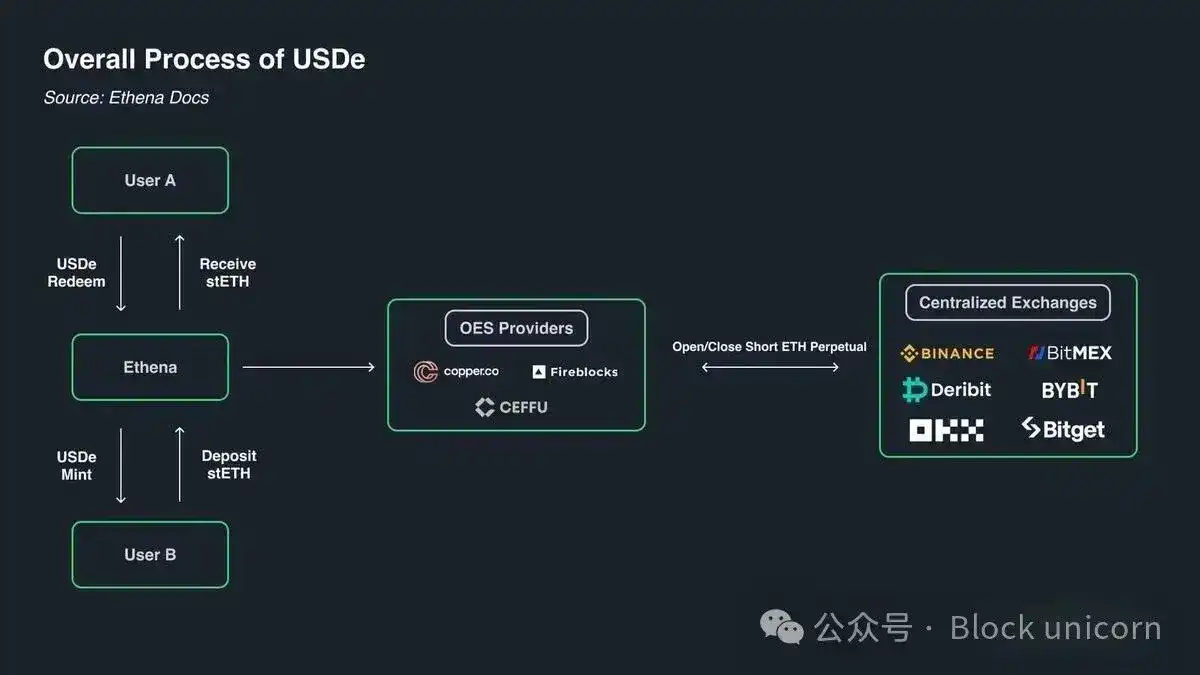
(Chart: Ethena Mechanism Illustration)

By construction, each long contract corresponds to a short contract in a 1:1 ratio. Each open interest in perpetual contracts represents a cash flow agreement between two parties. The exchange's role is to facilitate the matching of these contracts, ensuring that each contract always has a sufficiently funded long and short holder. The table below shows the four possible outcomes facilitated by the exchange.

Perpetual Contract Matching Matrix

Every trade has a buyer and a seller. When both the buyer and seller of a contract are long or both are short, the exchange merely transfers ownership of the contract from one party to the other. This transfer does not create or destroy any contracts. When the buyer is long and the seller is short, a new contract must be created, with the buyer taking the long position and the seller taking the short position, increasing the open interest by 1 contract. On the other hand, if the seller is long and the buyer is short, the exchange can directly unwind the contracts of the buyer and seller and delete the newly released contract, decreasing the open interest by 1 contract.

So, who are the actual holders of these contracts in a typical market? I believe contract holders can be broadly categorized into four types:

  • [Long] Directional Longs

  • [Short] Directional Shorts / Hedgers

    • a. Direct Asset Shorts / Hedges

    • b. Structured Product Hedges

  • [Short] Basis Traders (e.g., Ethena, etc.)

  • [Hybrid] Perpetual Arbitrageurs

Directional Longs seek exposure. They are risk-takers, and their demand for risk depends on their level of risk appetite.

Directional Shorts include both investors who wish to take on the downside risk of an asset and investors who wish to hedge their assets in a tax-efficient manner. Venture capital firms and company employees compensated with tokens often wish to hedge tokens that vest at current prices. For altcoins, many markets are too small for effective direct hedging, or may not even exist. In such cases, companies like Cumberland, Wintermute, FalconX, Flowdesk, and Amber can construct dynamically managed synthetic positions, using short sales of Bitcoin and Ethereum and other highly correlated assets to hedge exposure to less liquid markets (e.g., Monad). Projects like Neutrl also employ this strategy, offering such hedging as a yield strategy.

Basis Traders are opportunistic shorts. They are not interested in directional risk but actively fill the excess demand from directional longs when market supply and demand are imbalanced. Under most market mechanisms, long demand exceeds short demand, and the basis traders' role is to bridge the gap. Their position sizes are usually highly elastic.

Perpetual Arbitrageurs hold both long and short positions in perpetual contracts simultaneously. Their role is to connect different perpetual contracts and correct any minor price discrepancies, at a cost not exceeding transaction fees. Their long positions perfectly match their short positions at any given moment.

By construction, all perpetual contracts are in a 1:1 ratio, with long positions perfectly matched by short positions, so we know:

Directional Longs + Arbitrage Longs = Directional Shorts + Basis Shorts + Arbitrage Shorts

Furthermore, the structure of perpetual arbitrage tells us:

Arbitrage Longs = Arbitrage Shorts

Canceling this term from the first equation yields:

Directional Longs = Directional Shorts + Basis Shorts

Ethena provides us with a proxy for all basis shorts, which helps us gain insight into the difference between directional longs and shorts.

The chart below is Ethena's self-reported balance sheet, divided into cash and deployed capital, for the period from December 27, 2024, to March 7, 2026:
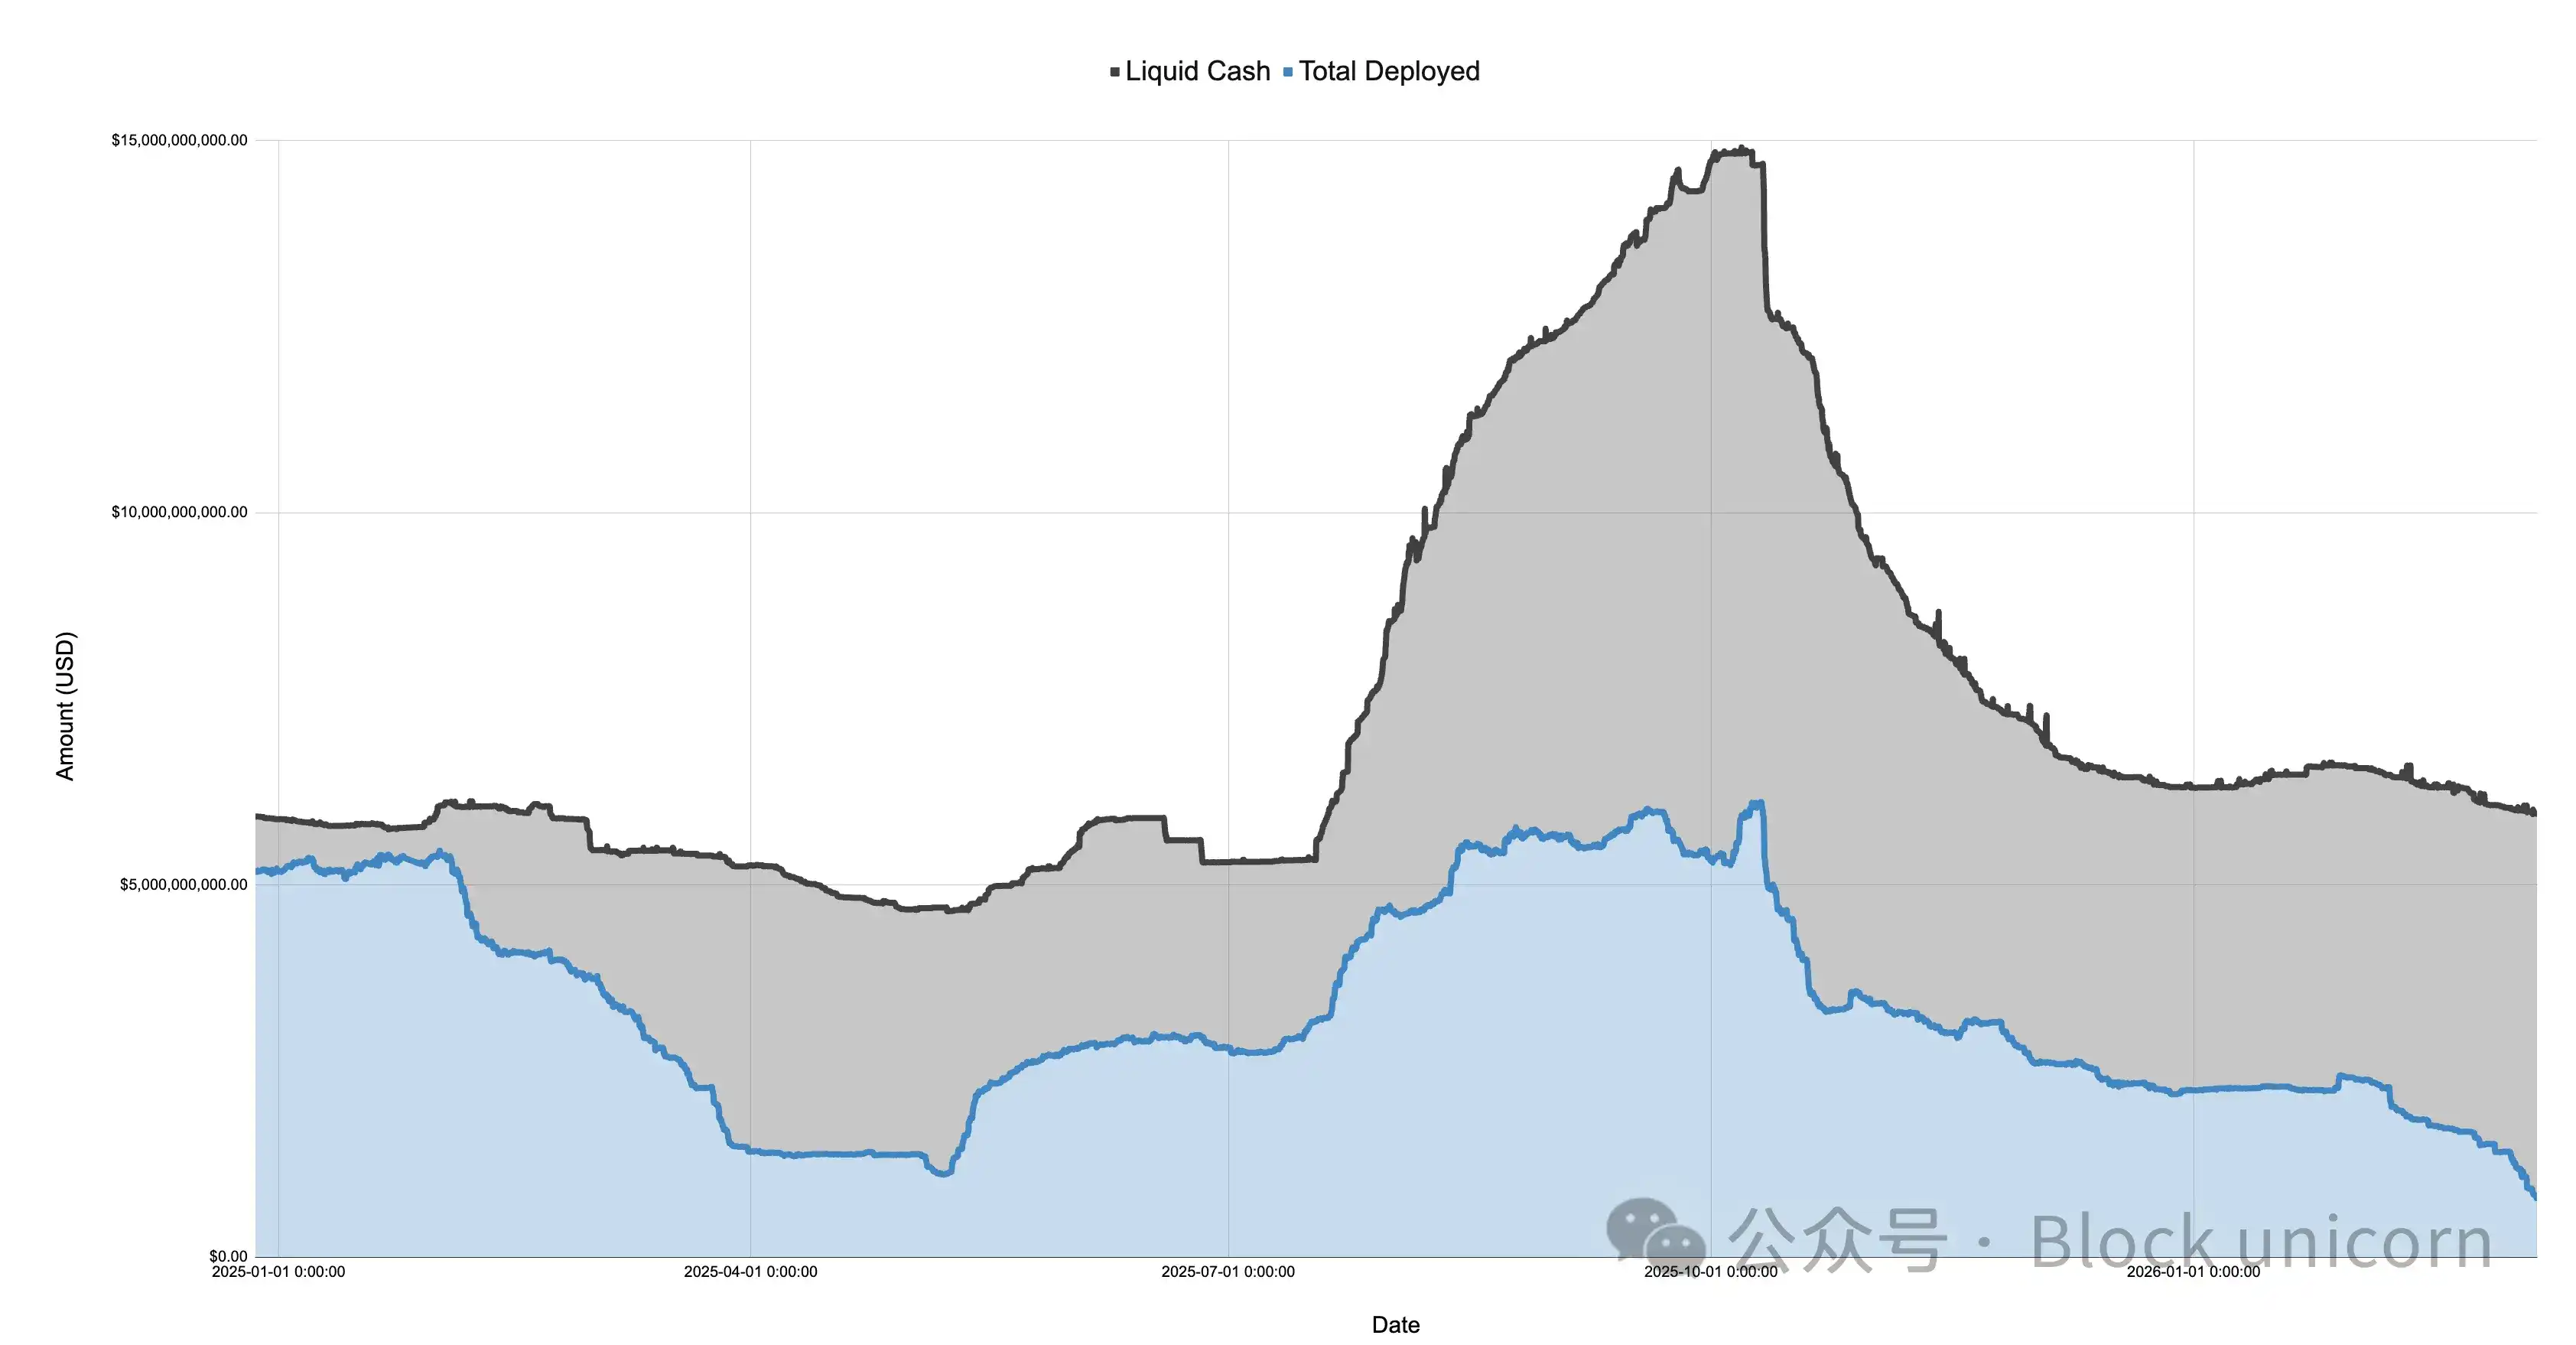
(Chart: Ethena Balance Sheet 2024-2026)

The market turned sharply risk-off in January 2025 after the launch of the $TRUMP token, followed by a continued decline during the initial tariff discussions and the "Liberation Day" in April. During this period, Ethena's deployed capital plummeted from over $5 billion to around $1.108 billion, a drop of more than 75%.

It is important to note that Ethena's deployed capital can serve as a reference for the degree of excess long demand in the market. Although Ethena is not the only institution conducting such trades, its size is substantial (sometimes around 25% of Binance and Bybit), and as long as it has ample cash, it will expand its positions to meet any unmet long demand. This suggests that while total long demand may not have fallen by 75% by April 2025, the excess demand not met by directional short covering did indeed fall by 75%.

The chart below shows the deployment of Ethena's balance sheet relative to its total size, the 2025 minimum, and maximum values.
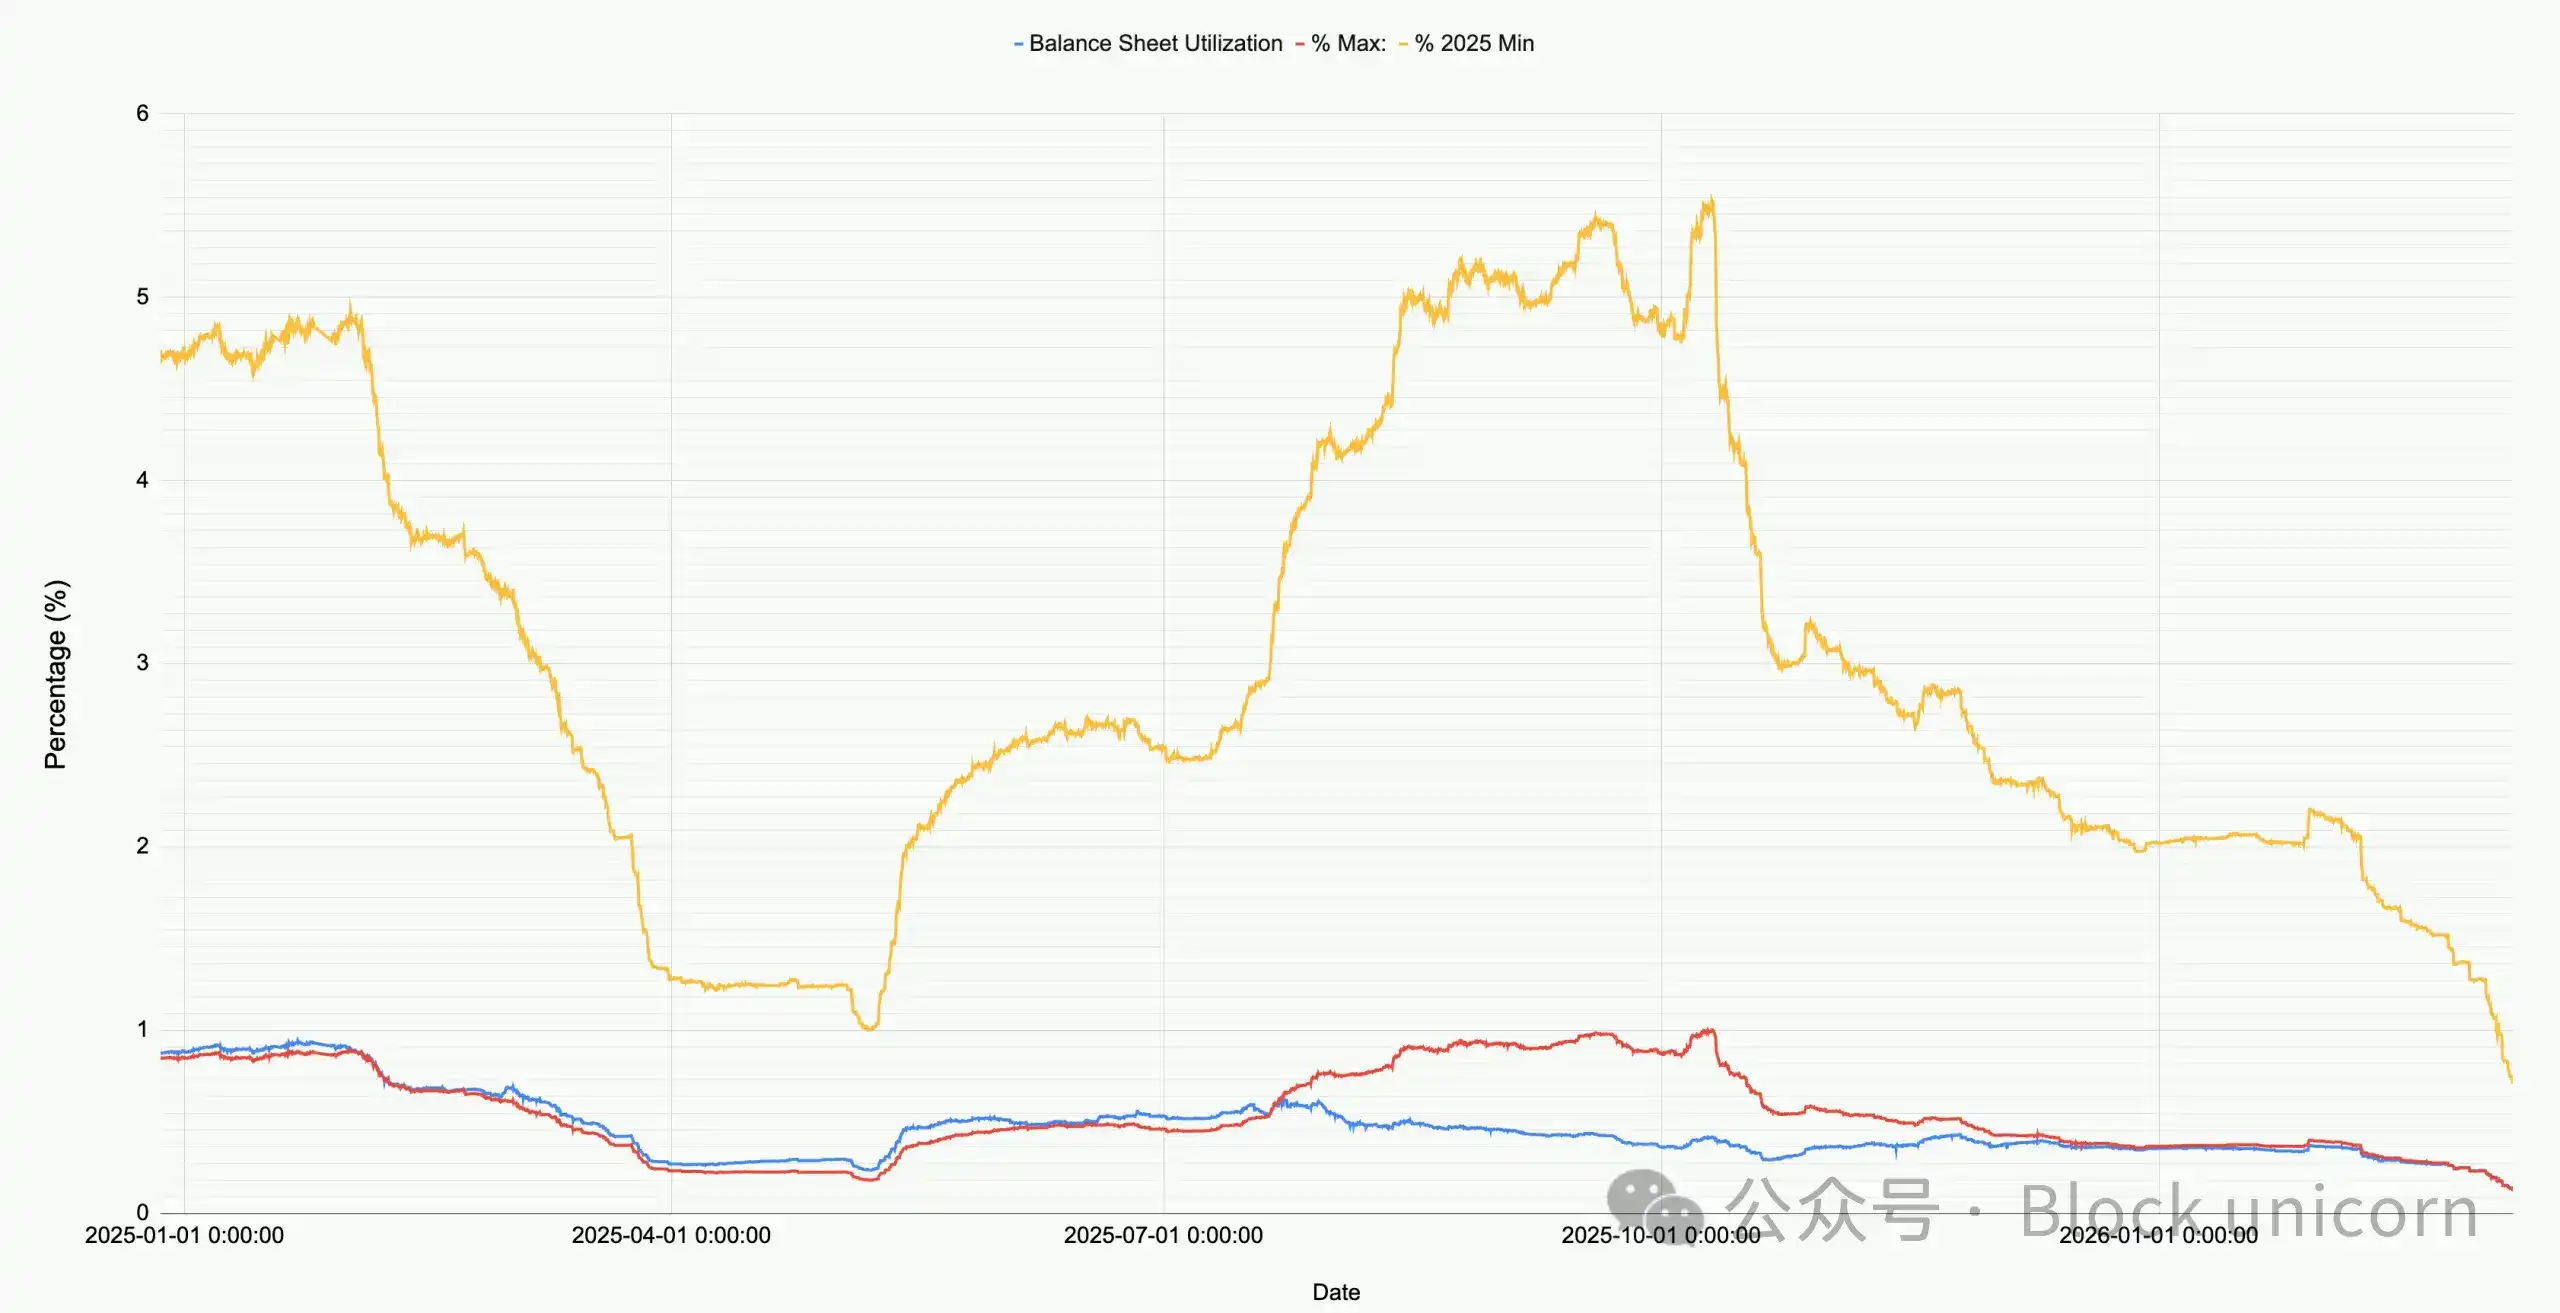
(Chart: Ethena Deployment Comparison)

Observing the current market, the total capital deployed by Ethena across all markets (BTC, ETH, SOL, BNB, XRP, HYPE) is only about $791 million. This is only 71% of the 2025 minimum and a mere 12.9% of the peak value before October 10th. This figure is not a criticism of Ethena but reflects the current market conditions: net long demand is at a historically low level.

It is particularly noteworthy that during the market crash where Bitcoin price plummeted to $60,000, Ethena deployed over $2 billion in capital. Since just a month ago, on February 8, 2026, Ethena's deployed capital has astonishingly decreased by 60%!

The chart below zooms in on Ethena's deployed capital and the price trend of Bitcoin since January this year.
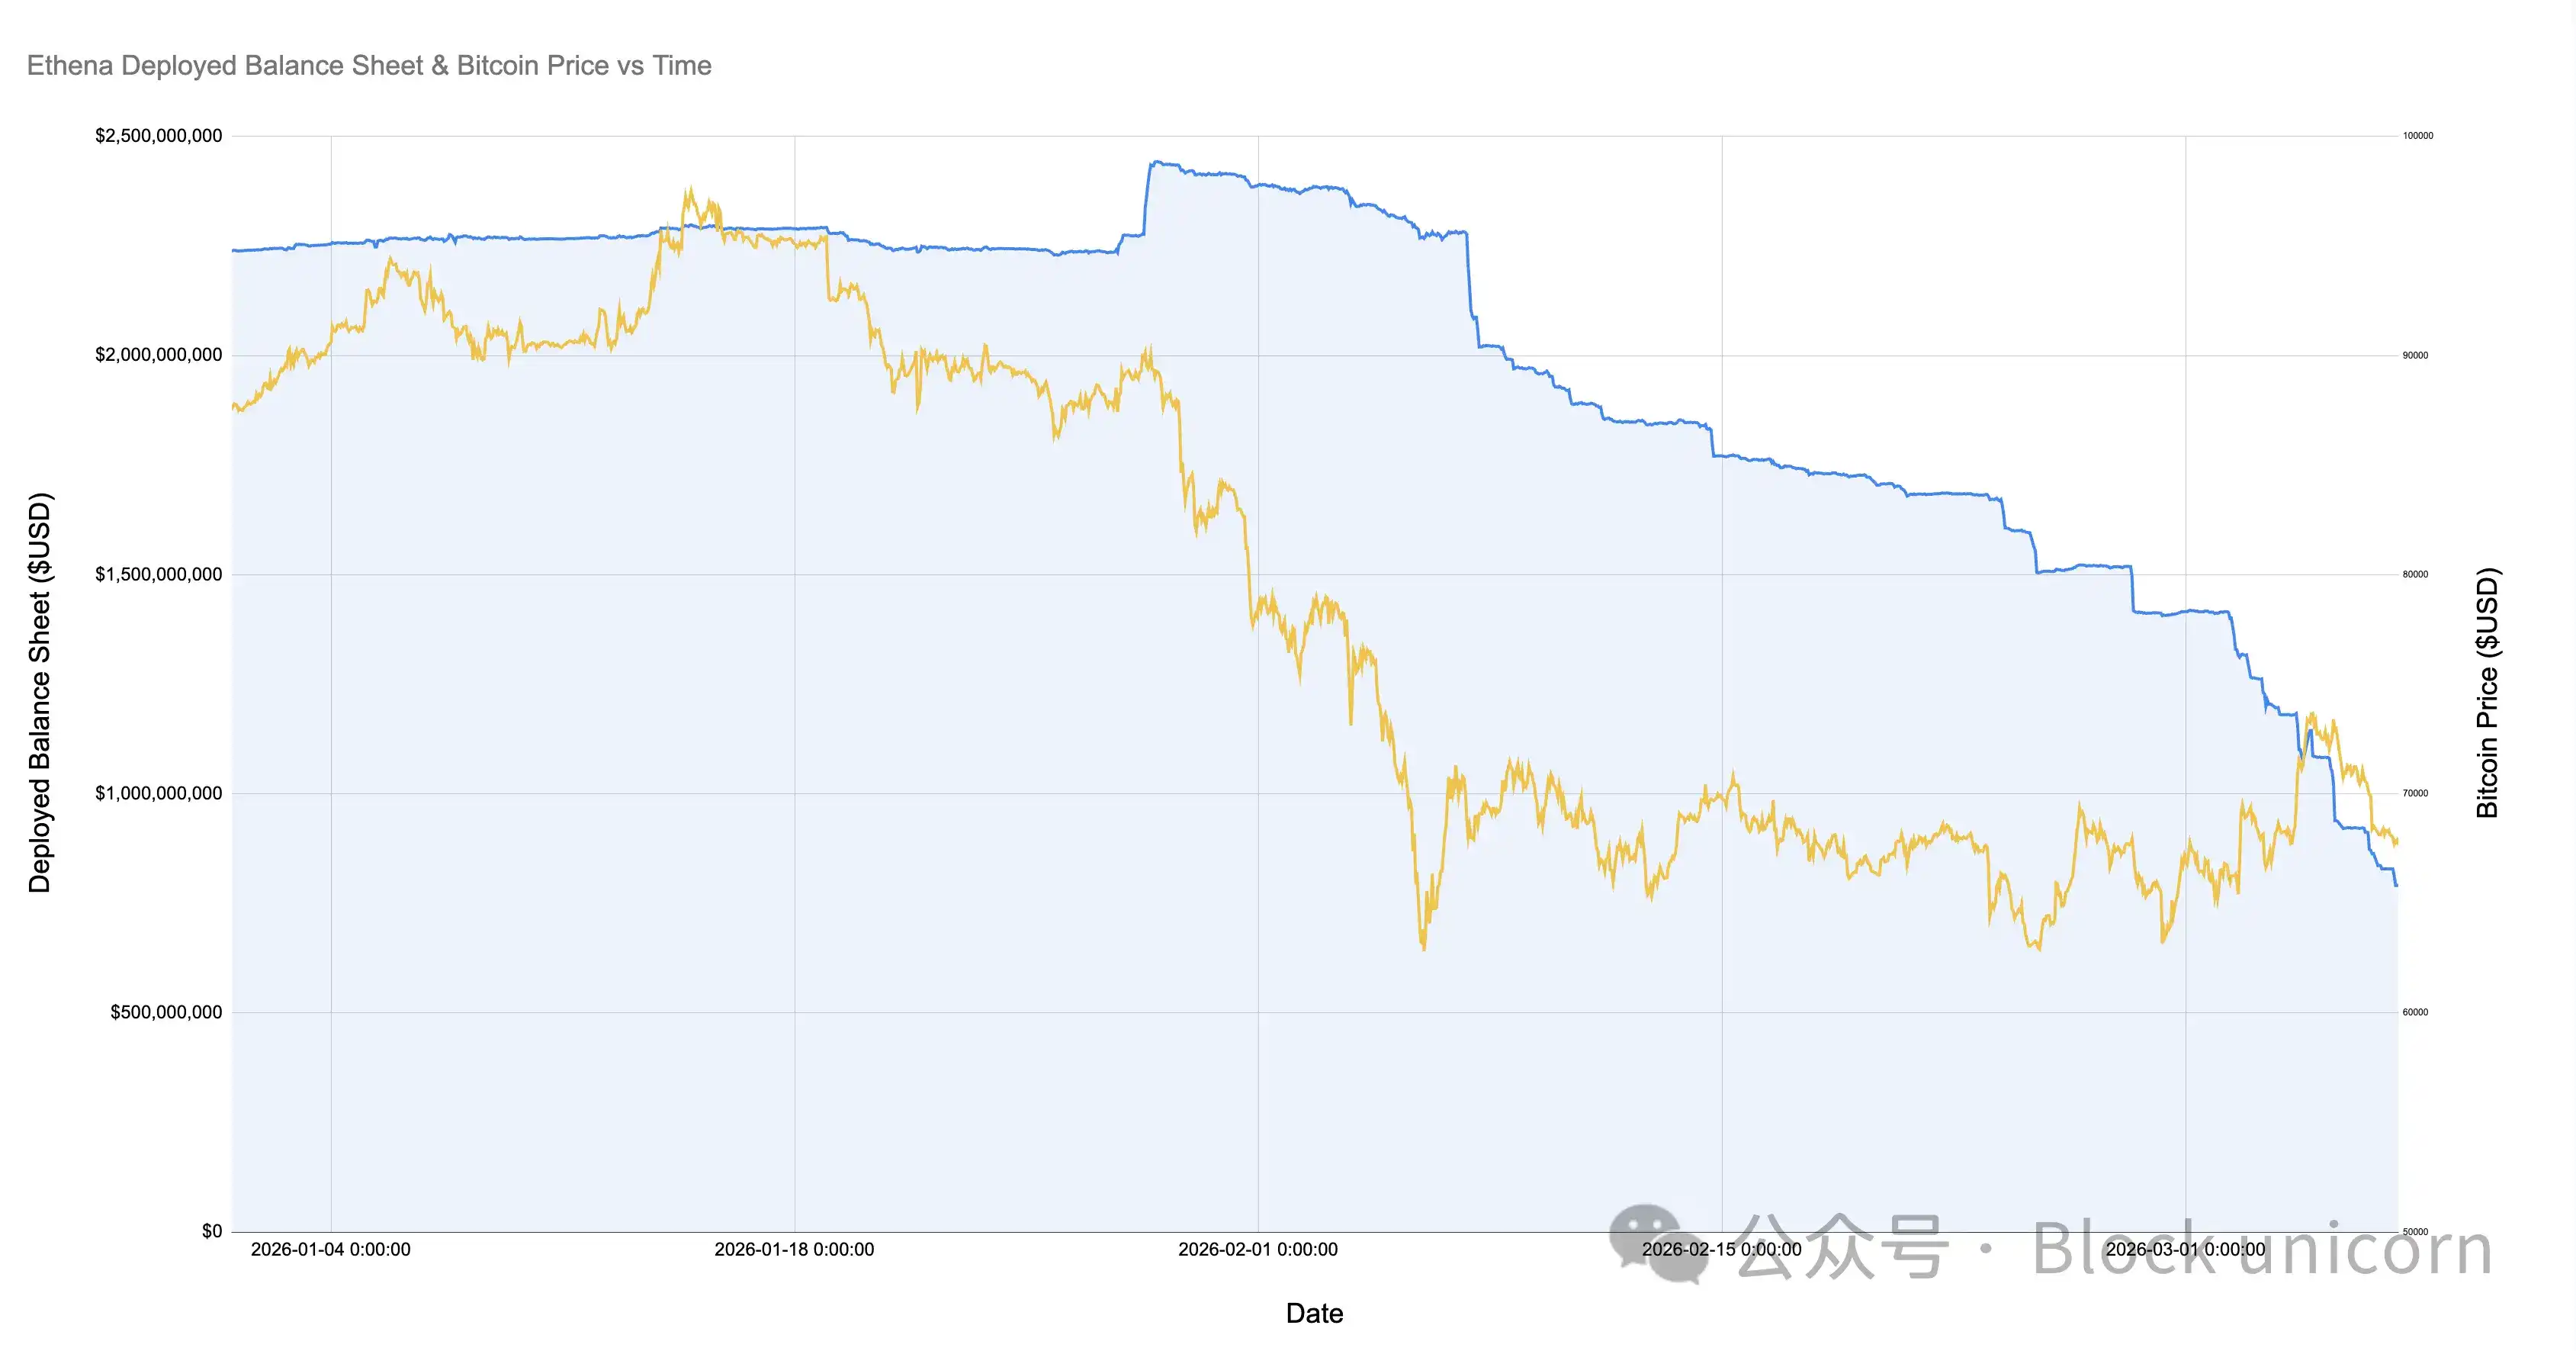
(Chart: Ethena Deployed Capital vs. Bitcoin Price Trend 2026)

Since the Bitcoin price fell to $60,000, Ethena's basis positions have shrunk by over 60%, from over $2 billion to less than $800 million. This change is puzzling because the market has been relatively stable during this period. The reasons for this are as follows:

  1. Profitable but unsustainable basis trades established after the February crash (the basis turned negative, but funding rates were also negative) are being gradually unwound.

  2. Increased hedging activity from directional shorts and price-insensitive participants is squeezing out opportunistic basis traders.

  3. Insufficient demand for leveraged exposure from longs.

(Chart: Open Interest vs. Funding Rate Trend)

In my opinion, the truth is primarily determined by a combination of factors 1 and 2, with factor 3 playing a minimal role. As shown in the chart above, during this period of gradual Ethereum project unwinding, the overall open interest for Bitcoin (and other major cryptocurrencies) has remained relatively stable. Meanwhile, funding rates have been negative for an extended period, with many cryptocurrencies (e.g., SOL) having cumulative negative funding rates across multiple exchanges. This indicates an increasing demand for shorting or hedging some form of risk exposure.

If I had to guess, I would say that small and medium-sized cryptocurrency companies and venture capital firms are both facing a crisis. Think of small-cap projects like Eigen, Grass, Monad, etc. There are hundreds of such cryptocurrencies, each representing dozens of venture capital firms and a company with capital and employees. Venture capital firms need to control losses and lock in profits to meet fund investment targets, and these companies need to ensure cash flow and headcount. This creates a situation where all participants want to squeeze the maximum benefit from the "stone," and the answer lies in relatively crowded trades through actively managed structured products that short a basket of correlated assets.

We saw the presence of these structured products during Ethereum's (ETH) explosive rally days, which also triggered short-covering rallies in numerous small and medium-sized cryptocurrencies. Another piece of evidence is the significant crowding out of opportunistic basis traders like Ethena.

Regardless of the specific reason, we can be sure that this is the first time in the history of the crypto market that directional longs and directional shorts have almost reached equilibrium. There is no充分 reason why this state cannot become the new normal, nor can it be proven that this market regime must change, but looking at other asset classes and markets, it is very unusual for such a trend to persist.


Domande pertinenti

QWhat does the significant decrease in Ethena's deployed capital indicate about the current cryptocurrency market?

AThe significant decrease in Ethena's deployed capital, which is at 71% of its 2025 low and only 12.9% of its peak, indicates that net long demand is at a historically low level. This reflects a prolonged risk-off sentiment in the market, where there is a lack of excess demand for leveraged long positions that is not being met by directional shorts.

QAccording to the article, what are the four main categories of perpetual contract holders in the crypto market?

AThe four main categories are: 1. Directional Longs (speculators seeking upside exposure), 2. Directional Shorts / Hedgers (those betting on downside or hedging existing assets), 3. Basis Traders (opportunistic shorts like Ethena that fill excess long demand), and 4. Perpetual Arbitrageurs (traders who hold both long and short positions to exploit price differences between contracts).

QHow does the article use the equation 'Directional Longs = Directional Shorts + Basis Shorts' to interpret market structure?

AThis equation, derived from the fact that all perpetual contracts are matched 1:1, shows that the amount of speculative long demand must be balanced by a combination of speculative short selling and the capital provided by basis traders. Ethena's deployed capital serves as a proxy for 'Basis Shorts,' allowing analysts to infer the relationship and imbalance between directional long and short interest.

QWhat are the proposed reasons for the 60% contraction in Ethena's positions since the February market crash, despite relatively stable prices?

AThe proposed reasons are: 1. The unwinding of profitable but unsustainable basis trades established after the February crash (where basis turned negative along with funding rates). 2. Increased hedging activity from directional shorts and price-insensitive participants, crowding out opportunistic basis traders. The article suggests reason 3 (insufficient leveraged long demand) plays a minimal role compared to the first two.

QWhat unique market condition does the current low level of Ethena's deployment reveal, and why is it considered unusual?

AIt reveals a market condition where directional long positions are nearly equal to directional short positions, achieving an extremely rare and historically unsustainable equilibrium. This is unusual because, in most asset classes and market regimes, there is typically a natural imbalance with a greater propensity for long speculation, making such a balance between bullish and bearish directional bets highly atypical.

Letture associate

Analyzing the Impact of AI on Economic Growth and Productivity

**Title: Analyzing AI's Impact on Economic Growth and Productivity** This article examines three contrasting views on AI's influence on economic growth and productivity. **The Optimistic View** posits that AI, especially through automating R&D ("recursive self-improvement"), could dramatically accelerate growth, even triggering a technological "singularity" with explosive, potentially infinite, economic expansion. **The Moderate/Mainstream View** acknowledges AI's productivity benefits but emphasizes significant real-world constraints that could limit its impact. These include: limited cost savings per task, structural ceilings on which jobs and industries are "exposed" to AI, adoption bottlenecks (e.g., compute, energy, regulatory hurdles), and the "weak link" effect where non-automatable tasks cap overall gains. Consequently, the realized AI dividend may be far lower than optimistic projections, with estimates typically ranging from 0.1% to 1.3% annual productivity growth. **The Pessimistic View** stems from two strands. The first aligns with the moderate view but applies extremely conservative assumptions about task exposure and efficiency gains, yielding minimal projected impact. The second introduces a demand-side critique: if AI primarily replaces rather than augments labor, it could depress labor's share of income, weaken consumer demand, and create a "demand trap" that ultimately stifles growth, unless offset by redistribution policies. **The authors' assessment** is nuanced: * **Short-term (1-2 years):** AI will support growth primarily through investment spending, not significant productivity gains. * **Medium-term (3-5 years):** Three potential paths emerge based on AI demand and bottleneck severity: 1. **"Optimistic Path":** High demand, few bottlenecks. Rapid productivity gains but risk of major job displacement and social conflict without redistribution. 2. **"Moderate Path" (most likely):** High demand but significant, surmountable bottlenecks. Leads to moderate productivity gains, financial market volatility (K-shaped returns), and sectoral job losses. 3. **"Pessimistic Path":** Low demand or severe bottlenecks. Minimal productivity and growth impact, triggering financial market corrections but allowing a smoother societal transition with less labor disruption. * **Long-term:** AI holds potential for a major productivity revolution and prosperity. The conclusion stresses that no path is smooth. Technologically "optimistic" outcomes could be socially detrimental, while "pessimistic" technological diffusion might be more socially stable. Policymakers must monitor developments and prepare balanced responses to manage economic, financial, and social sustainability.

marsbit3 min fa

Analyzing the Impact of AI on Economic Growth and Productivity

marsbit3 min fa

The New Cold War is a Tech Stock War

The New Cold War is a Tech Stock War The article argues that the contemporary geopolitical and economic rivalry between the US and China represents a "New Cold War," but one fundamentally fought through technology and financial markets, not physical barriers or conventional trade. Historically, US dominance was secured through financial systems. The Soviet Union, reliant on the rigid "Transferable Ruble," was ultimately undermined by its dependency on the US dollar for oil trade. Later, Japan's semiconductor challenge was countered not just by tariffs (e.g., Plaza Accord, 301 investigations) but by binding it to US Treasury bonds. China presents a more complex, "embedded" challenger. While it holds vast dollar reserves and US debt like Japan, its industrial base is stronger and more diversified than the Soviet Union's. Surviving the initial 2018 trade war phase, the conflict has evolved into a "tech-financial war." The core battlefield is now the stock market. US tech stocks (AI, semiconductors) are treated as sovereign assets, buoyed by bipartisan national will. China is pushing to strengthen its own financial markets to convert industrial strength into financial power and fund its tech ambitions. Companies like ChangXin (semiconductors), Moonshot AI, and DJI compete not just for market share but as financial proxies for their respective systems. The new paradigm is moving from globally efficient monopolies (Apple, Google) towards companies that achieve monopolistic profits within their respective geopolitical spheres. This competition over "pricing power" and financial valuation in segmented markets defines the current era, making the stock market the primary arena for this tech-centric struggle.

marsbit12 min fa

The New Cold War is a Tech Stock War

marsbit12 min fa

RWA Weekly: Ten European Financial Institutions Establish Tokenized Asset Cooperative; Ondo Launches New Execution Network Ondo Network

RWA Weekly: European Banks Form Tokenized Asset Cooperative; Ondo Launches New Execution Network Ondo Network Covering July 24-31, 2026, the RWA sector saw a steady on-chain total value locked (TVL) of $36.8 billion, with holder count hitting a record high. However, stablecoin transfer volumes fell sharply (~30%), indicating low on-chain settlement demand. Key regulatory moves include South Korea advancing stablecoin legislation and a push to scrap crypto taxes, Kenya lowering capital requirements for stablecoin issuers, and Zimbabwe approving seven projects for its crypto sandbox. In project developments, BIS-led Project Agorá successfully tested cross-border payments with tokenized funds across six currencies. Ten major European financial institutions formed the RL1 blockchain cooperative to build tokenized asset infrastructure. Other notable updates: Aviva launched a tokenized dollar liquidity fund on XRPL, POSCO International tokenized commercial invoices on Injective, and a Brazilian farmer used tokenized cattle as collateral for a loan. Additional progress includes BNY Mellon migrating its core transfer agent operations to blockchain, Securitize gaining SEC investment advisor registration, and Tether’s compliant stablecoin USA₮ launching on Celo. Ondo Finance introduced Ondo Network, a new execution layer focused on speed and privacy, moving away from its initial chain plans. An analysis highlights that despite the growing scale of on-chain RWAs (~$32B), approximately 90% remain underutilized in DeFi, pointing to a critical challenge in unlocking liquidity and fostering real-world application beyond mere issuance.

marsbit12 min fa

RWA Weekly: Ten European Financial Institutions Establish Tokenized Asset Cooperative; Ondo Launches New Execution Network Ondo Network

marsbit12 min fa

South Korean Stock Market Sees Sharp Rebound After Forceful De-leveraging, SK Hynix Rises 30%

On July 31, South Korean stocks staged a historic rebound. The benchmark KOSPI index surged 18.27%, with chipmaker SK Hynix hitting a 30% gain limit. This followed a brutal, near-40% decline in the KOSPI over the previous month, driven largely by a deleveraging spiral involving leveraged ETFs. Analysts attributed the sharp sell-off to structural liquidity issues rather than deteriorating corporate fundamentals. The rally was triggered by a confluence of positive catalysts. Firstly, strong earnings from U.S. cloud giants Microsoft and Amazon alleviated fears of an "AI bubble burst," boosting global tech sentiment. Secondly, SK Group Chairman Chey Tae-won made a rare personal purchase of SK Hynix shares, seen as a strong vote of confidence. Thirdly, the South Korean government announced a 20 trillion won ($139 billion) AI investment fund. In response to the market turmoil, South Korean regulators are tightening controls on leveraged ETFs, admitting oversight shortcomings. Measures include raising minimum cash保证金 requirements for散户 investors and suspending new product launches. While the rebound signals eased liquidity pressure, analysts note deep structural issues remain. The market's future stability is seen as dependent on global tech capital expenditure trends and memory chip price cycles, with some viewing the surge as a technical correction rather than a definitive trend reversal.

marsbit33 min fa

South Korean Stock Market Sees Sharp Rebound After Forceful De-leveraging, SK Hynix Rises 30%

marsbit33 min fa

Trading

Spot
活动图片