Following a disappointing US Non-Farm Payrolls report last Friday, the US dollar extended its decline, while gold and US stocks posted significant weekly gains.
US non-farm payrolls unexpectedly dropped by 23,000 in July, far worse than the expected increase of 80,000. Additionally, figures for May and June were revised down by a total of 103,000. Although the unemployment rate fell from 4.2% to 4.1%, a decline in the labor force participation rate to 61.4% suggests more people are leaving the workforce.
Signals of a cooling labor market reduced the probability of a September Fed rate hike to 43% (compared to around 70% two weeks ago). However, some analysts argue that due to productivity gains from AI, the Non-Farm Payrolls data may be less significant than before. In other words, this week's US July CPI data could carry greater weight for the interest rate outlook.
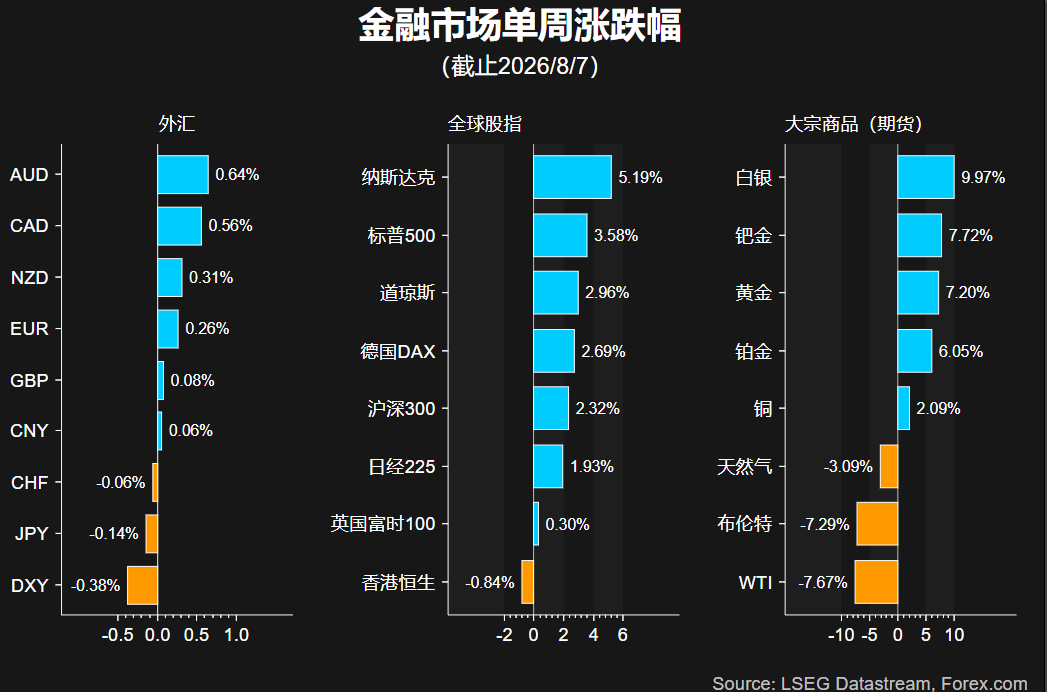
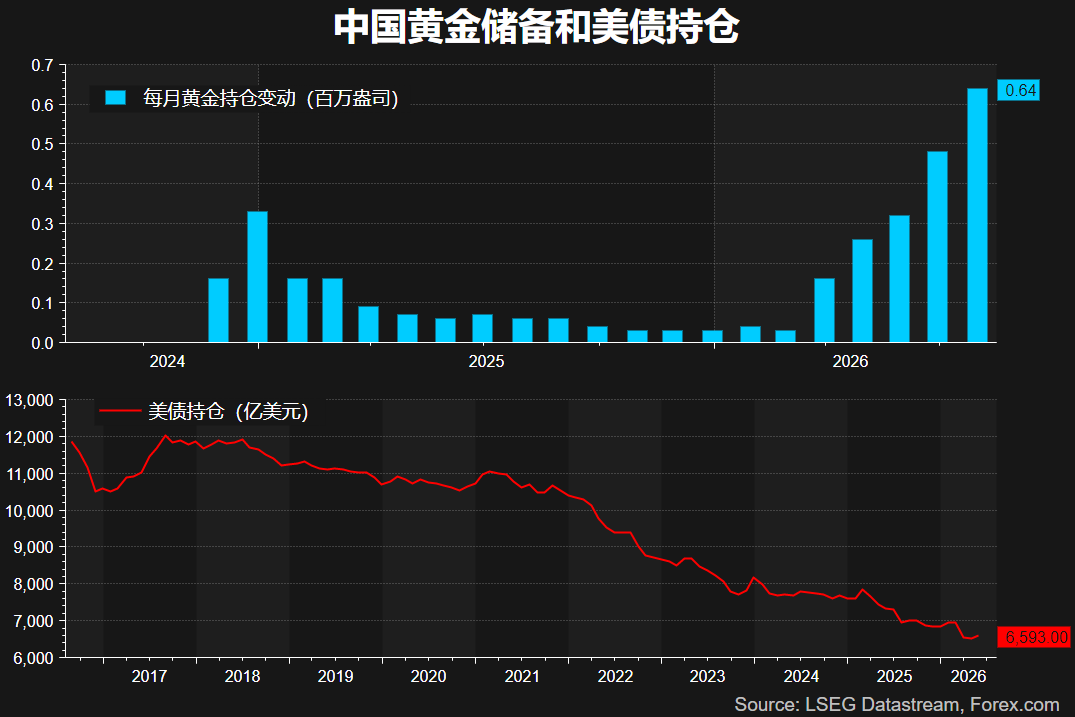
Gold surged over 7% last week, breaking through $4,300 and recording its largest weekly gain since January. Notably, the People's Bank of China has been increasing its gold reserves for 21 consecutive months, with purchase volumes rising month by month, while its holdings of US Treasuries have fallen to their lowest level since 2008.
This week's key focuses include US CPI, the Reserve Bank of Australia's interest rate decision, and the performance of tech stocks and gold.
US July CPI – Wednesday, 20:30 (GMT+8)
Oil prices have fallen 15% from their peak in late July. As negotiations regarding the passage through the Strait of Hormuz are reportedly "entering the final stage," both oil prices and inflation risks are expected to continue their downward trend.
The market expects CPI to dip slightly to 3.4% from a previous 3.5%, while core CPI is forecast to drop from 2.6% to 2.5%. Lower-than-expected inflation could further dampen rate hike expectations for the year, putting pressure on the US dollar, but benefiting gold, silver, and tech stocks. Conversely, if inflation surprises to the upside, expectations for a September rate hike may rise again, potentially helping the US Dollar Index find support near 99.40.
Other US economic data this week include PPI on Thursday and Retail Sales on Friday.
Reserve Bank of Australia Interest Rate Decision – Tuesday, 12:30 (GMT+8)
With both inflation and unemployment remaining stubbornly high in Australia, the market widely expects the central bank to keep interest rates unchanged this week. Furthermore, the probability of another rate hike within the year is below 50%.
Although the RBA is no longer as hawkish as it was in the first half of the year, the Australian dollar has benefited from the US dollar's pullback, closing higher for 5 out of the past 6 weeks. The AUD/USD pair has risen above 0.7000, reaching a new high since June. If the central bank refrains from dovish remarks this week, the Aussie's uptrend may continue.
"Explosive" Earnings Fuel Continued Tech Stock Recovery
As of last Friday, approximately 90% of S&P 500 companies have reported earnings. The overall Q2 profit growth rate is projected to reach a staggering 50%, the highest since 2021, far exceeding the 23% estimated at the end of June and the previous quarter's 27%.
Strong earnings have temporarily alleviated market concerns about excessive AI-related spending. Major US indices posted their best weekly performance since April last week, with the S&P 500 closing at a record high and the Nasdaq 100 Index now only about 3% away from its all-time high.
This week, earnings reports from CoreWeave, Cisco, Applied Materials, and others will continue to test market confidence. For Hong Kong-listed stocks, Tencent and JD.com will release their latest earnings reports.
The next potential market mover is likely NVIDIA's earnings on August 26th.
XAUUSD 1-Hour Chart
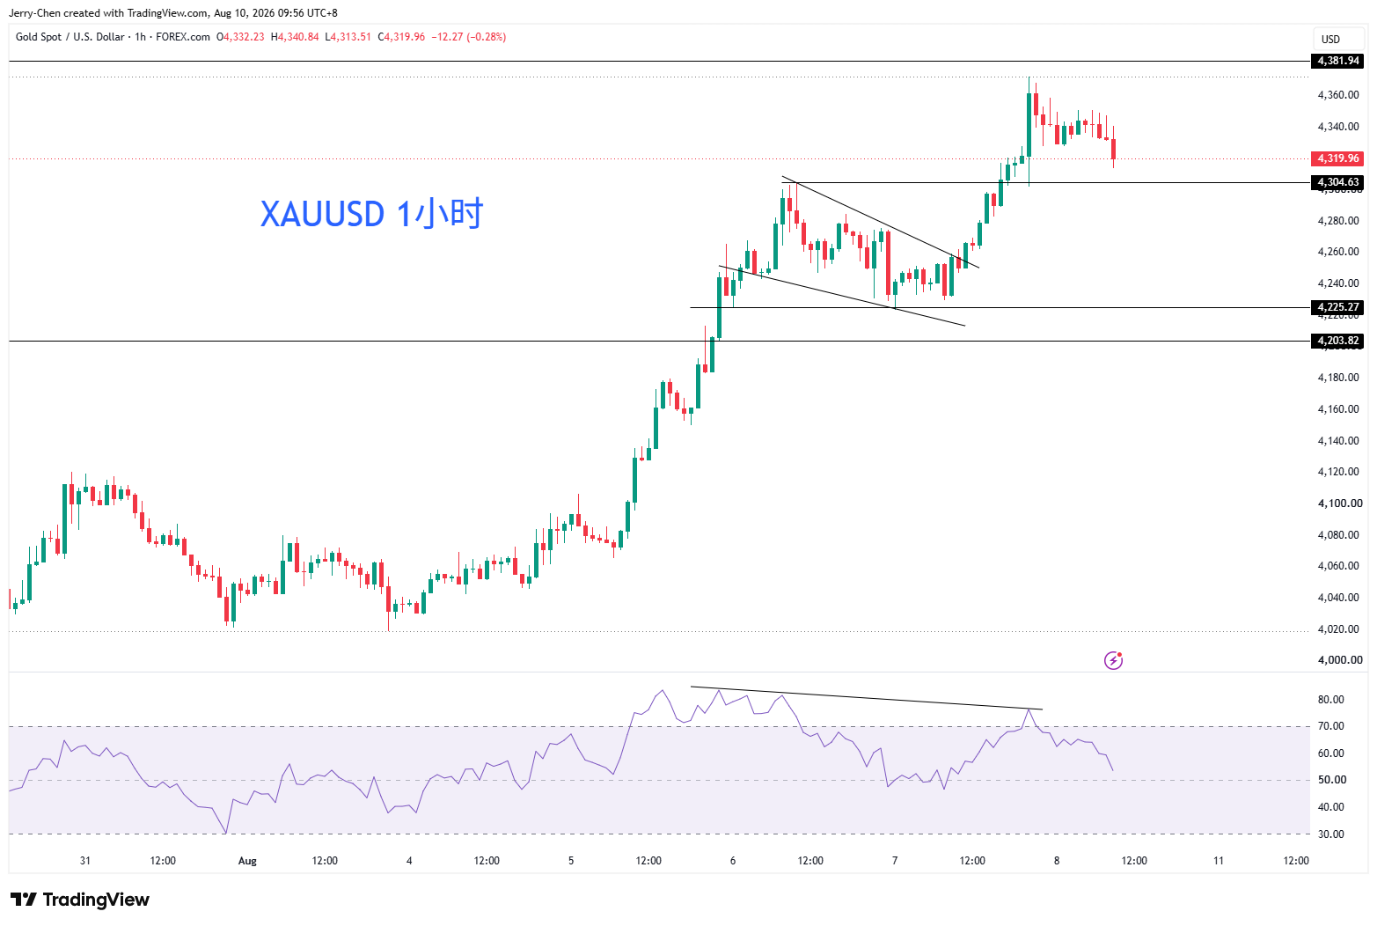
As shown in the chart, after breaking through the long-term (six-month) downtrend line and rising above $4,300, the weekly and daily chart patterns suggest continued upward momentum. Considering the drag on the US dollar from reduced rate hike expectations, opportunities for buying on dips can still be monitored.
As shown in the chart, from a short-term perspective, gold prices were under pressure in early Monday trading as they continued to correct overbought technical indicators. The $4,300/$4,320 area is the initial zone to watch, being the starting point of Friday's surge post-NFP data, which may offer some cushion. Holding above this level could pave the way for another test of the critical $4,380 level, the final hurdle before further gains. However, a break below $4,300/$4,320 could extend the correction towards the $4,200/$4,230 area for support.
NASDAQ 100 4-Hour Chart
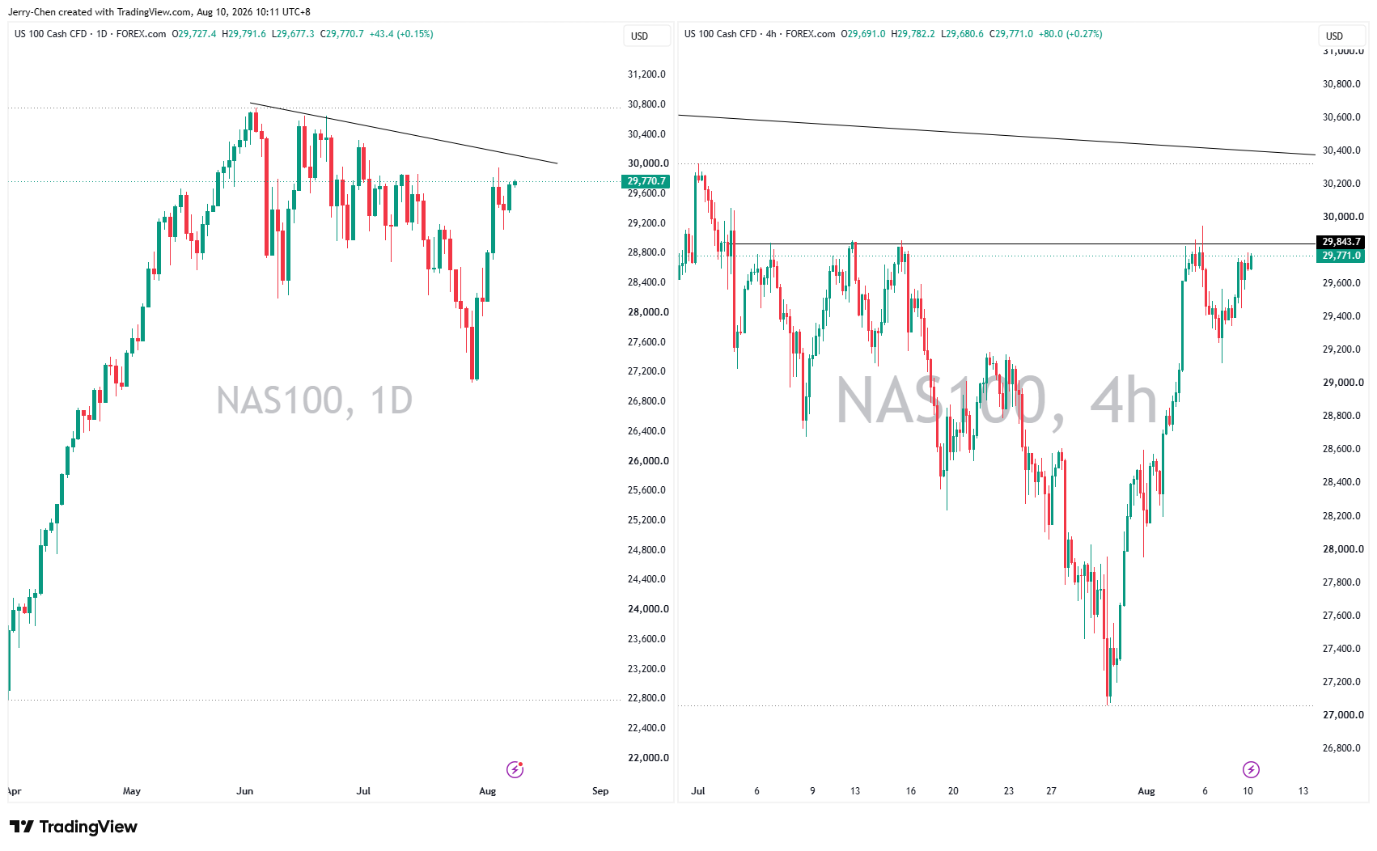
As shown in the chart, the Nasdaq 100 Index has staged a strong rebound on the daily chart, rising nearly 10% from its low in late July. On the 4-hour chart, after retesting the 29,100 level, the uptrend was reaffirmed. It is currently challenging the 29,850 level. A decisive breakthrough could extend the rally towards 30,000 and beyond.
On the downside, a break below the 29,100/29,200 area could indicate a fading of upward momentum.