VIRTUAL traders bet on sustained gains, but can demand break $0.65?

ambcryptoPubblicato 2026-07-21Pubblicato ultima volta 2026-07-21

Introduzione

Virtuals Protocol (VIRTUAL) price rallied nearly 5% in 24 hours, with Open Interest up 17% and trading volume doubling to $71.1 million, signaling improved short-term sentiment. However, the broader trend remains bearish, with price action confined within a downtrend since May. The rally has reached a key local supply zone at $0.63-$0.65, which previously rejected bulls in mid-June. While the RSI indicates upward momentum, declining On-Balance Volume (OBV) suggests weak buying pressure. Traders are advised to maintain a bearish bias unless VIRTUAL can decisively break and hold above $0.65 as support, which could open a path toward $1.04-$1.19. Until then, a rejection at this resistance level is expected.

Virtuals Protocol [VIRTUAL] rallied nearly 5% in the past 24 hours, with an Open Interest increase of nearly 17%. The rally, rising open interest, and stronger trading volume suggest improving short-term sentiment, although the broader trend remains under pressure.

This statement was reinforced by the high daily trading volume. According to CoinMarketCap data, the volume in the past 24 hours at press time was $71.1 million, more than double the previous day’s volume.

Weekends tend to see low volume, and it could be that Monday kicked off VIRTUAL’s rally. Bitcoin [BTC] was also challenging the $65.2k local supply zone.

AMBCrypto reported that Virtuals Protocol had introduced customizable tokenized indexes to the Robinhood Chain. Any user can publish such a composite asset and would earn fees when others mint the associated token.

So far, the news has not been enough to nudge the altcoin prices back above key overhead supply zones. Let’s examine where these were and how strong demand really has been.

VIRTUAL still labors within a downtrend
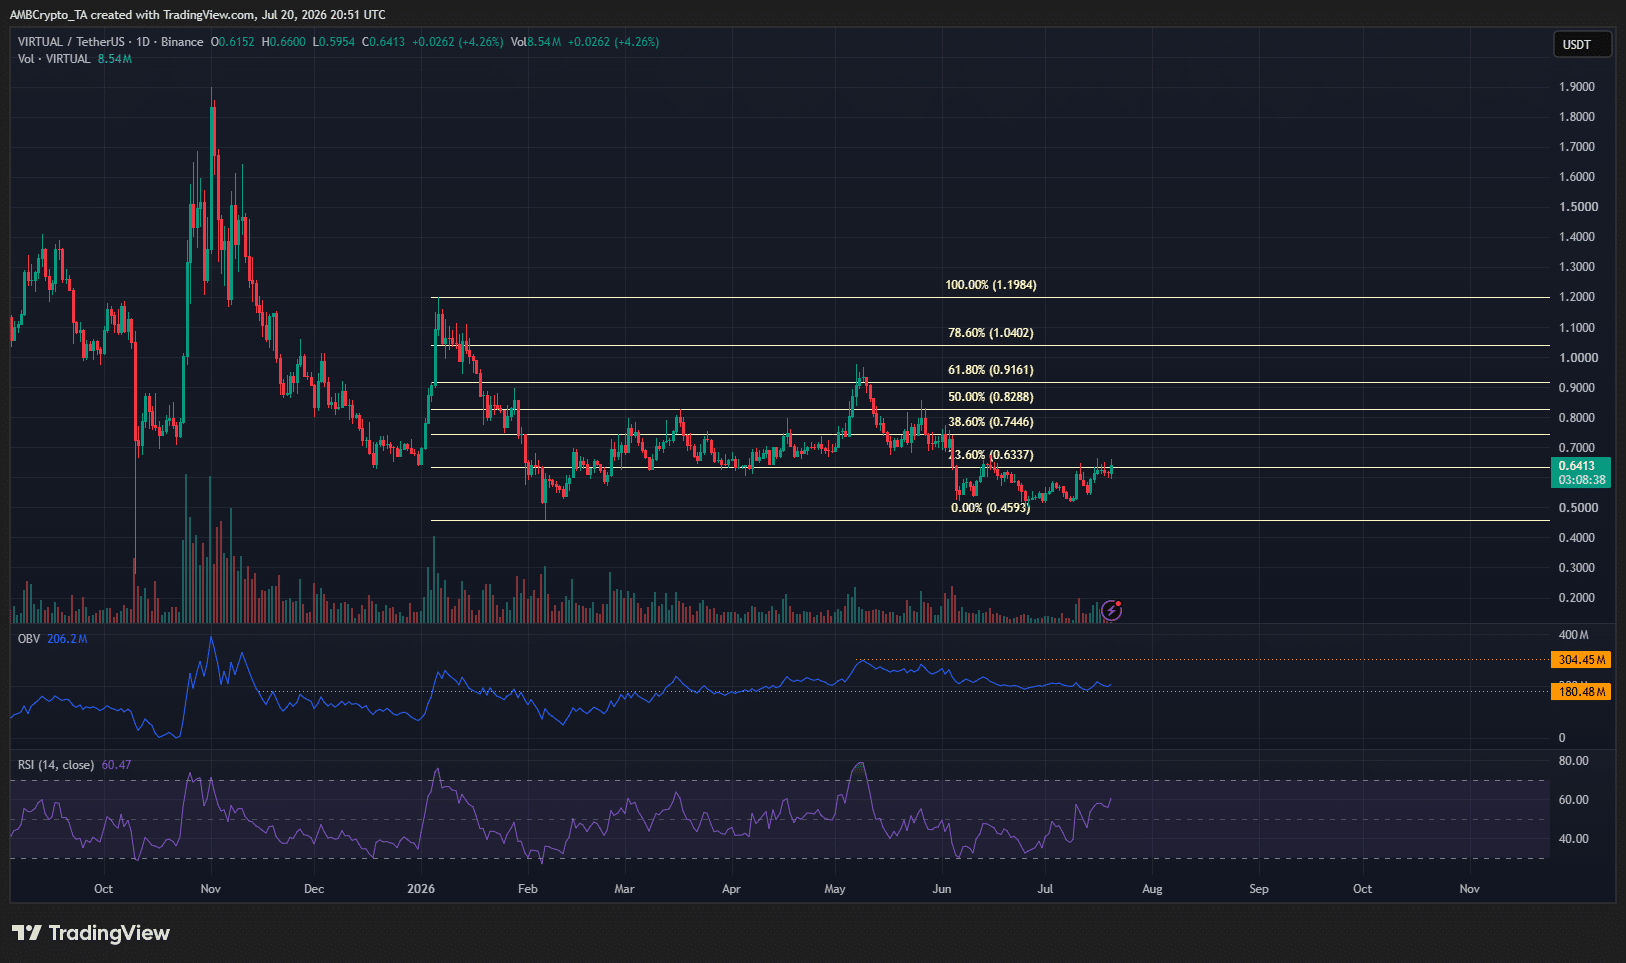
Source: VIRTUAL/USDT on TradingView

The swing structure on the 1-day timeframe was bearish. As things stand, a move below the $0.459 swing low would indicate a bearish trend continuation. Meanwhile, a rally past $1.19 is needed to flip the swing structure bullishly.

The VIRTUAL price gain of 17% in the past week was set against this bearish backdrop. The rally has reached the $0.63-$0.65 local supply zone. The same area had rejected the bulls back in mid-June.

The OBV has been trending lower since May. The 100% spike in daily trading volume could be a misleading sign. Though the RSI was above 50 to signal upward momentum, a lack of sustained buying volume over the past two months was a telltale sign of a weak bounce.

Traders’ call to action- Sell, but be ready to flip biases

In the short-term, a rejection from the $0.65 local supply zone is expected. However, if VIRTUAL prices breach this area, a bullish move as high as $1.04 and even $1.19 becomes possible.

Therefore, traders can maintain a bearish bias until $0.65 is conquered. Once it is flipped to support, swing traders can try to profit from the rally toward $1, although they should remember that the higher timeframe structure remained bearish.


Final Summary

  • The Virtuals Protocol price and volume spike on Monday could be a sign of a bullish short-term price move.
  • The long-term trend was bearish, but if $0.65 is flipped to support, a rally toward $1.0-$1.2 could follow.


Domande pertinenti

QAccording to the article, what are the two key price levels that traders should watch to determine the next major trend for VIRTUAL?

AAccording to the article, a move below the $0.459 swing low would indicate a bearish trend continuation, while a rally past $1.19 is needed to flip the swing structure bullishly.

QWhat recent development for Virtuals Protocol was reported by AMBCrypto, and how does the article suggest it has impacted the price so far?

AAMBCrypto reported that Virtuals Protocol introduced customizable tokenized indexes to the Robinhood Chain, allowing users to publish composite assets and earn fees. The article states that so far, this news has not been enough to nudge the altcoin prices back above key overhead supply zones.

QWhat is the immediate local supply zone that VIRTUAL's price has reached, and what is the expected short-term price action if it gets rejected?

AThe immediate local supply zone is $0.63-$0.65. The article states that in the short-term, a rejection from this $0.65 local supply zone is expected.

QWhat do the On-Balance Volume (OBV) indicator and the spike in daily trading volume suggest about the strength of VIRTUAL's recent rally?

AThe OBV has been trending lower since May, indicating a lack of sustained buying volume. The 100% spike in daily trading volume could be a misleading sign, and the article describes the recent bounce as a weak one.

QWhat potential price targets does the article suggest could become possible if VIRTUAL manages to decisively break above the $0.65 resistance?

AThe article suggests that if VIRTUAL prices breach the $0.65 area, a bullish move as high as $1.04 and even $1.19 becomes possible.

Letture associate

Why Bitcoin Holds Above $64,000 After Fed's Hard Pause

**Bitcoin Stabilizes Near $64,000 Following Hawkish Fed Pause** The cryptocurrency market, led by Bitcoin, remained stable around $64,000 despite a volatile reaction to the latest U.S. Federal Reserve meeting. The Fed paused interest rates but signaled a hawkish stance, with three committee members voting for an increase—the highest dissent since 2016. This limits risk appetite but hasn't triggered panic selling. Key market highlights include Bitcoin ETFs seeing a net inflow of $32.1 million, breaking a streak of outflows, while Ethereum ETFs experienced outflows of $18.65 million. Liquidations affected about 90,000 traders. Technically, Bitcoin finds support around $63,000-$63,500, with major resistance near $66,000. While its price is about 49% below its all-time high, institutional demand via ETFs and the absence of mass capitulation support a potential recovery scenario in the second half of the year. Major altcoins showed mixed movements, with Solana attracting capital while Ethereum faced selling pressure despite strong on-chain metrics like a growing staking queue. Regulatory news took a pause as the U.S. Senate delayed the CLARITY Act vote until at least autumn. For the final trading day of July, U.S. inflation and consumer spending data will be crucial. Bitcoin's key levels to watch are $63,000 support and $66,000 resistance. Sustained ETF inflows and Bitcoin holding above $63,000 are seen as positive signs for a potential market recovery later in the year.

cryptonews.ru1 h fa

Why Bitcoin Holds Above $64,000 After Fed's Hard Pause

cryptonews.ru1 h fa

Trading

Spot
活动图片