Violent Attacks On Crypto Holders Escalate Worldwide, Data Shows

bitcoinistPubblicato 2026-01-06Pubblicato ultima volta 2026-01-06

Introduzione

Data shows a significant escalation in violent "wrench attacks" – physical robberies and kidnappings targeting cryptocurrency holders to force asset transfers – both in frequency and severity worldwide. Security researcher Haseeb Qureshi analyzed an incident database maintained by Jameson Lopp, finding 269 categorized attacks, with over half classified as "Serious" and 5% as "Fatal." The data indicates attacks are becoming more violent over time, with 2025 showing the highest incident count. Approximately 45% of the variation in attacks is explained by crypto market capitalization, meaning higher prices correlate with more incidents. However, when normalized per user (using Coinbase active users as a proxy), attack rates spiked in earlier market cycles, fell after 2019, and have recently risen again toward 2021 levels. Geographically, Western Europe and North America have the most incidents, but Latin America and Africa have significantly higher fatality rates. Notably, zero fatal attacks have occurred in North America. Researchers warn these events are transitioning from rare occurrences to a recurring risk for crypto participants.

Violent “wrench attacks” against crypto holders, physical robberies and kidnappings meant to force victims to hand over coins, appear to be rising in absolute terms and trending more severe, according to a new visualization built from a long-running incident database maintained by security researcher Jameson Lopp.

Dragonfly partner Haseeb Qureshi said he analyzed Lopp’s dataset and built an interactive dashboard to stress-test a question many traders and builders have been asking quietly for years: is simply holding crypto becoming physically more dangerous? “You’re not imagining it: the number of attacks has been increasing over time,” Qureshi wrote on X. “Not only that, the attacks are getting more violent.”
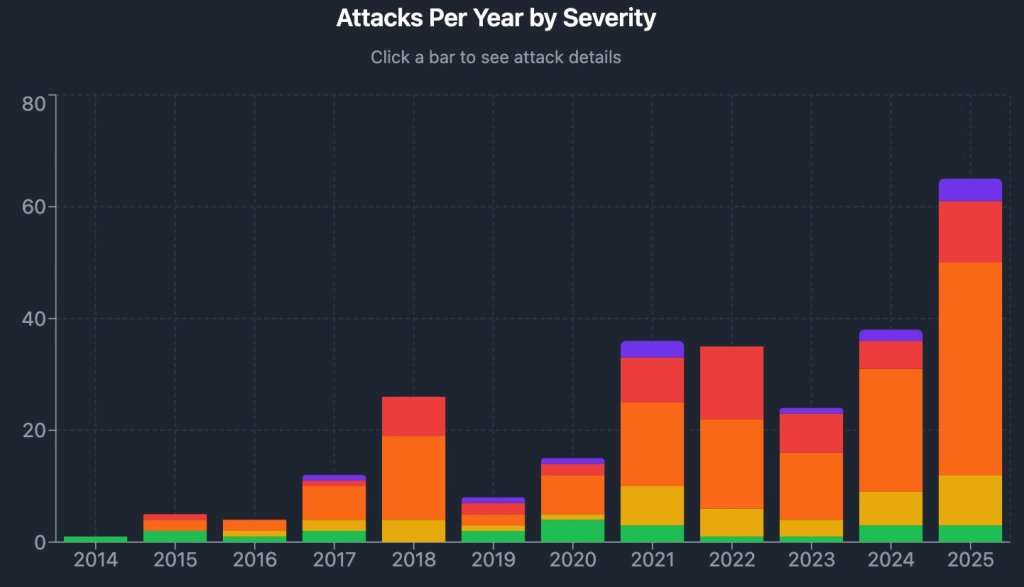
Attacks per year by severity | Source: X @hosseeb

The dashboard breaks reported incidents into five severity bands — Minor, Moderate, Serious, Severe, and Fatal and the distribution skews heavily toward the sharp end of the spectrum. Of 269 categorized incidents shown, 137 (51%) were labeled “Serious,” 57 (21%) “Severe,” and 13 (5%) “Fatal,” with the remainder split between 39 (14%) “Moderate” and 23 (9%) “Minor.”

The year-by-year bars show the later years carrying a larger share of “Severe” and “Fatal” outcomes than the early history of the dataset, with 2025 appearing as the highest-incident year on the chart.
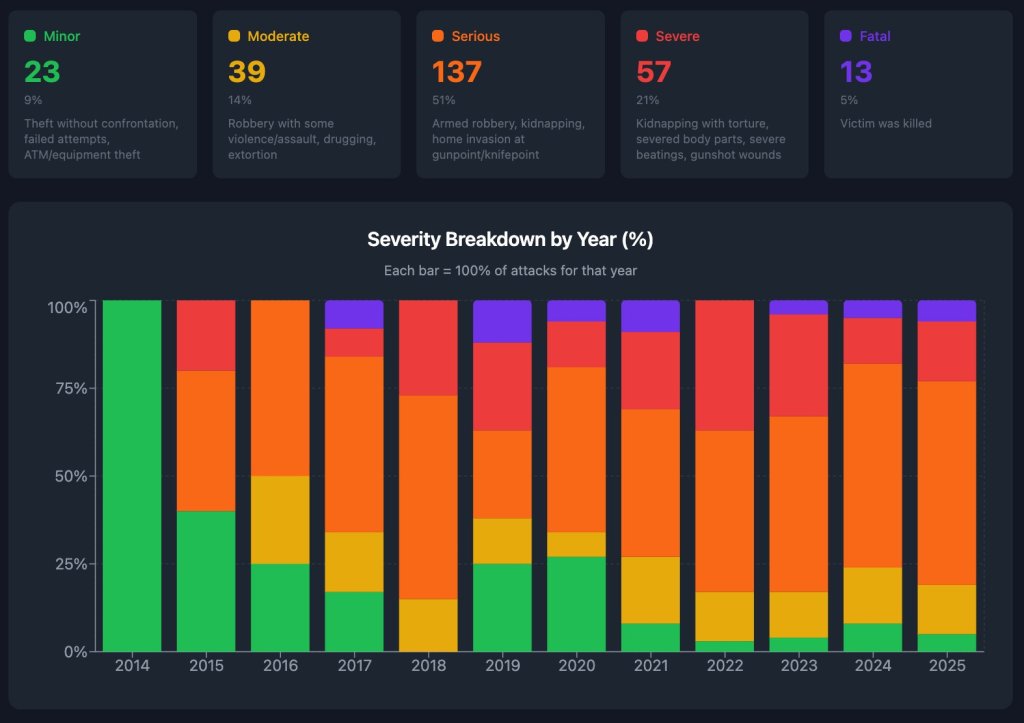
Severity breakdown by year | Source: X @hosseeb

Qureshi’s analysis also puts a number on the most intuitive driver: price. Charting incidents against total crypto market capitalization, he reported a simple regression with an R2 of 0.45 — implying roughly 45% of the variation in reported violence is explained by market cap alone. In plain terms, higher prices coincide with more attacks.

But the more consequential question for everyday holders is not raw counts; it’s risk per person. Because comprehensive “number of crypto users” data is hard to pin down, Qureshi used Coinbase monthly active users as a proxy, and separately normalized incidents by market cap to approximate attacks per dollar of wealth.

The resulting “normalized attack rates” chart tells a less linear story: per-user attack rates spiked in earlier market eras (notably around 2015 and again in 2018), then fell sharply after 2019, before ticking higher in the most recent observations. “So is that it?” Qureshi asked. “Proof crypto is becoming more physically dangerous?”
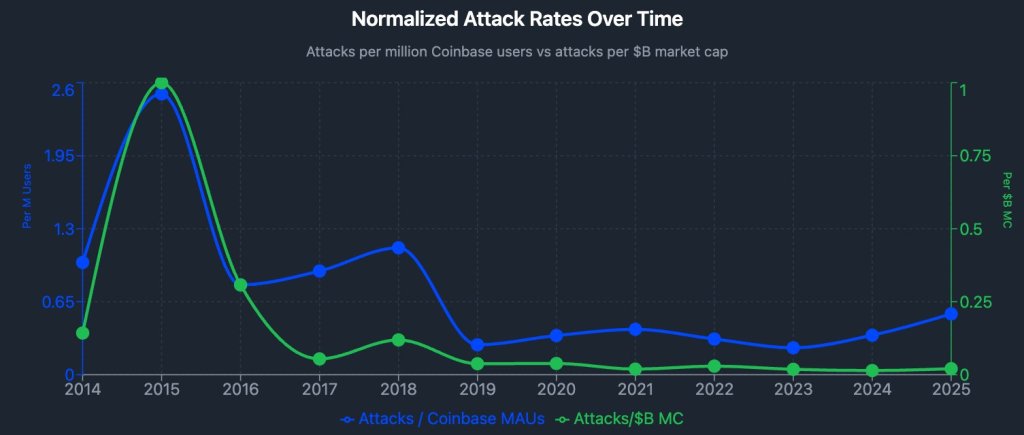
Normalized attack rate over time | Source: X @hosseeb

On his telling, not quite. Coinbase MAUs, he noted, expanded dramatically over the decade, while normalized attack rates did not rise proportionally, suggesting a meaningful “population effect” behind the higher headline totals. Still, the per-user line has moved up from its post-2019 lows, roughly back toward the levels seen during the 2021 cycle, even as the “attacks per $ of market cap” line remains comparatively flat in recent years.

Geography adds another uncomfortable layer. A regional table in the dashboard shows Western Europe (73 attacks) and North America (64) as the two largest buckets by incident count, with Asia-Pacific also substantial (53). But the most lethal outcomes cluster elsewhere: Latin America shows a 21% fatality rate and Africa 17%, versus 0% in North America. Qureshi underscored that point directly: “Notably, there have been 0 fatalities in North America ever,” he wrote, adding that the “lion’s share” of fatalities are in Latin America and Africa.
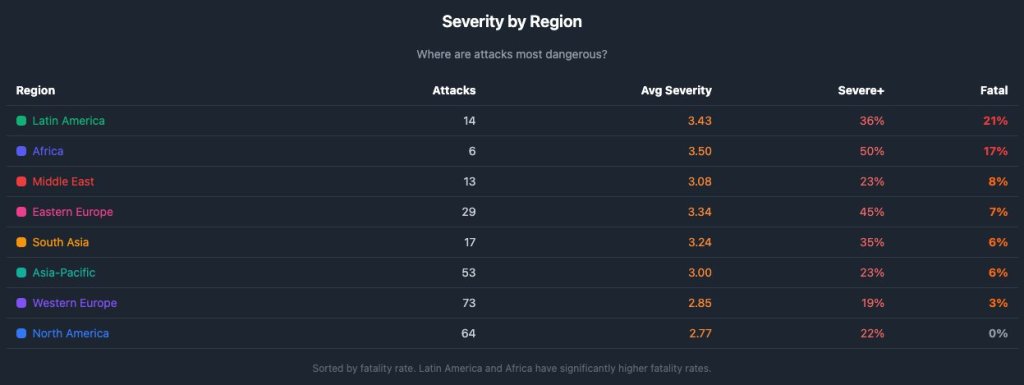
Severity by region | Source: X @hosseeb

Lopp, who has maintained the underlying “Bitcoin Wrench Attack” archive for years, has warned the workload and frequency are becoming harder to treat as isolated incidents. “When an event goes from being rare to happening every few days, it’s no longer newsworthy — it’s just a fact of life,” he wrote in a Dec. 21 post cited in the thread, while inviting others to help maintain the database.

At press time, the total crypto market cap stood at $3.12 trillion.
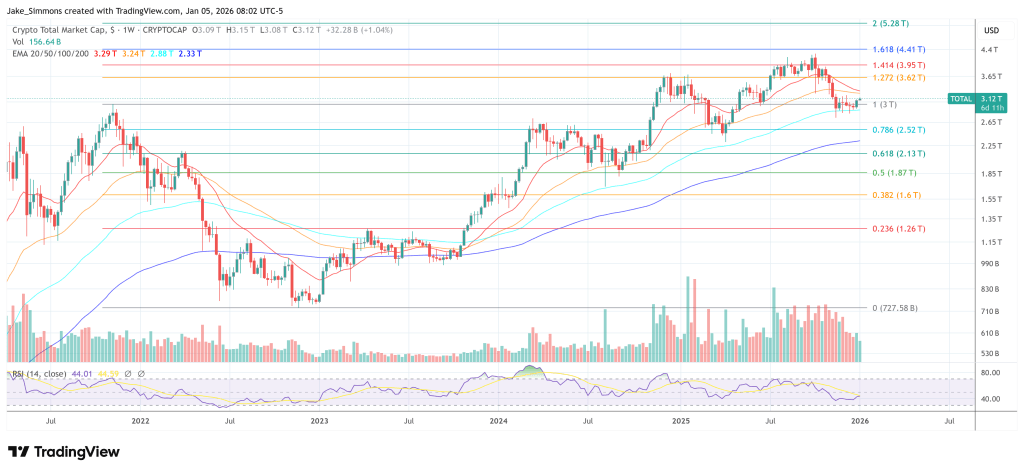
Total crypto market cap recovers above the 2021 high, 1-week chart | Source: TOTAL on TradingView.com

Domande pertinenti

QAccording to the analysis, what is the relationship between crypto market capitalization and violent attacks?

AThe analysis shows a correlation between higher crypto prices and increased attacks, with a regression R2 of 0.45 indicating that approximately 45% of the variation in reported violence is explained by market cap alone.

QWhich regions have the highest fatality rates in crypto-related attacks, according to the data?

ALatin America has a 21% fatality rate and Africa has a 17% fatality rate in crypto-related attacks, while North America has recorded 0% fatalities.

QWhat does the normalized attack rate analysis reveal about per-user risk over time?

AThe normalized attack rate shows that risk per user spiked in earlier market eras (2015 and 2018), fell sharply after 2019, but has recently ticked higher toward 2021 levels, though it didn't rise proportionally to the dramatic expansion of crypto users.

QHow are the severity of attacks distributed across the 269 incidents analyzed?

AThe severity distribution is heavily skewed toward serious outcomes: 51% were 'Serious', 21% 'Severe', 5% 'Fatal', 14% 'Moderate', and 9% 'Minor'.

QWhat trend does Jameson Lopp observe regarding the frequency of these attacks?

AJameson Lopp notes that attacks have moved from being rare events to happening every few days, making them 'no longer newsworthy' but rather 'a fact of life' in the crypto space.

Letture associate

human.tech Launches Clean SDK for Privacy-First Web3 Apps

human.tech has launched the Clean SDK, a toolkit enabling developers to build privacy-first Web3 applications with transparent accountability. Released alongside Aztec's version 5, the SDK provides components for integrating zero-knowledge identity verification, sanctions screening, and private transactions, without developers handling sensitive user data or building compliance infrastructure from scratch. It uses zero-knowledge proofs and programmable verification to allow apps to confirm user legitimacy and sanctions compliance while keeping identities confidential. The first application built on the SDK, Shield, a privacy bridge to Aztec, also launched. It allows users to transfer assets privately while proving a unique human is behind each transfer and that funds have passed sanctions checks, as verified by a May 2026 audit. The SDK offers three core verification techniques: Proof of Innocence (sanctions screening against 23 sources), Proof of Personhood (simpler verification via Human Passport), and Proof of Clean Hands (higher-assurance zero-knowledge government ID checks). This allows apps to authenticate users and transactions without exposing personal data. Designed for Aztec builders, the SDK lets developers add programmable privacy to decentralized apps, eliminating the need to create their own verification and ZK infrastructure. Shield demonstrates its practical use for private bridges, but the SDK aims to enable a wider ecosystem of private, accountable financial apps and services. The launch addresses growing demand for infrastructure that balances privacy and accountability. The SDK avoids traditional identity databases, storing encrypted data off-chain, screening at both entry and exit points, and including a gated disclosure mechanism for legal requests. human.tech's products, including the Clean SDK, focus on using zero-knowledge technology to enable verifiable personhood and privacy in digital systems.

TheNewsCrypto14 min fa

human.tech Launches Clean SDK for Privacy-First Web3 Apps

TheNewsCrypto14 min fa

Unlocking $100 Million in Liquidity? Pump.fun's New Policy Tests the 5-Minute Pump Technique

Pump.fun, a popular meme coin launchpad, has introduced a new standard mechanism called BOOST. It aims to address a significant capital efficiency issue: when a newly launched token graduates from its initial bonding curve to a liquidity pool (LP), roughly 20% of its liquidity becomes permanently locked as "dead liquidity," estimated to waste over $100 million annually. Instead of locking these funds permanently, BOOST repurposes them. Upon a token's migration, approximately 20% of the settlement funds (e.g., 17.6 SOL or ~$2516 USDC) are used to buy back the token on the open market over a 5-minute period via a Time-Weighted Average Price (TWAP) mechanism. All purchased tokens are immediately burned. This creates a brief, systematic buy pressure immediately after migration, potentially generating a short-term price surge ("pump") while permanently reducing the token's circulating supply. The goal is to enhance the immediate post-launch trading experience, potentially increasing trader retention and sustainable protocol revenue, which funds ongoing token buybacks. However, concerns exist that this artificial 5-minute boost could lower the barrier for launching low-quality tokens and lead to steeper price crashes once the buy pressure stops, if followed by large sell-offs. The feature automatically applies to tokens migrating after July 21, 2024, but not to previously migrated tokens or those launched via the Mayhem AI Agent lab.

marsbit21 min fa

Unlocking $100 Million in Liquidity? Pump.fun's New Policy Tests the 5-Minute Pump Technique

marsbit21 min fa

Podcast Notes | Conversation with GSR Asset Management Head: To Determine if This Crypto Rally is Real, Just Watch the Lending Rates on Aave

Podcast Summary: Dialogue with GSR's Head of Asset Management: To Determine if This Crypto Rally is Real, Just Check Lending Rates on Aave Andy Baehr, Managing Director of Asset Management at GSR, discusses the current crypto market, characterizing it as stuck in a state of "ambivalence" with short-lived, unsustainable rallies. He outlines a simple framework: the market moves between "ambivalence" and "conviction" (sustained upward momentum). Currently, every rally resembles a single-stage rocket booster that quickly fizzles out. Baehr identifies three key signals to watch: 1) DeFi lending rates, 2) the potential passage of the CLARITY Act, and 3) the market forming a consensus on the "Fed hawkish peak." He emphasizes that the most immediate indicator for the sustainability of the recent CPI-triggered rally is the USDC borrowing rate on Aave, currently around 3.75%—close to U.S. Treasury yields. The absence of a credit spread indicates low leverage demand and a lack of market energy. He explains that a healthy, sustained rally requires layered buying pressure. Last year's rally progressed from an ETH short squeeze to crypto-native trader influx and finally to ETF inflows. Currently, this structure is missing. Other potential structural buyers like Digital Asset Treasury (DAT) companies are absent, and ETF flows have proven transient. Baehr notes that while small-cap crypto tokens outperformed large caps in Q2—a potential sign of capitation in major assets—capital is also flowing to more exciting opportunities like AI stocks and tech IPOs, leaving crypto sidelined. Regarding DeFi, he highlights that platforms like Aave provide a clear, real-time signal of leverage demand through their supply/demand-driven interest rates. A significant, sustained rate increase would signal genuine market conviction. He also observes the quiet emergence of fixed-income-like products and vaults in DeFi. On regulation, the probability of the CLARITY Act passing before the August 7th deadline has dropped linearly from 75% to below 40% on Polymarket. Baehr suggests its passage would be treated as a bullish surprise, a potent driver for price movement. However, political hurdles, including ethical clause debates and disclosures about the First Family's crypto profits, remain significant obstacles. Ultimately, the market awaits clarity on the Fed's terminal rate under Chair Warsh. Until the "Fed Solstice"—the point where the market collectively understands the peak of hawkish policy—sustained conviction will be difficult to achieve.

marsbit52 min fa

Podcast Notes | Conversation with GSR Asset Management Head: To Determine if This Crypto Rally is Real, Just Watch the Lending Rates on Aave

marsbit52 min fa

Trading

Spot
活动图片