Venice Token [VVV] surges 14% – Why THIS is the next KEY hurdle

ambcryptoPubblicato 2026-03-26Pubblicato ultima volta 2026-03-26

Introduzione

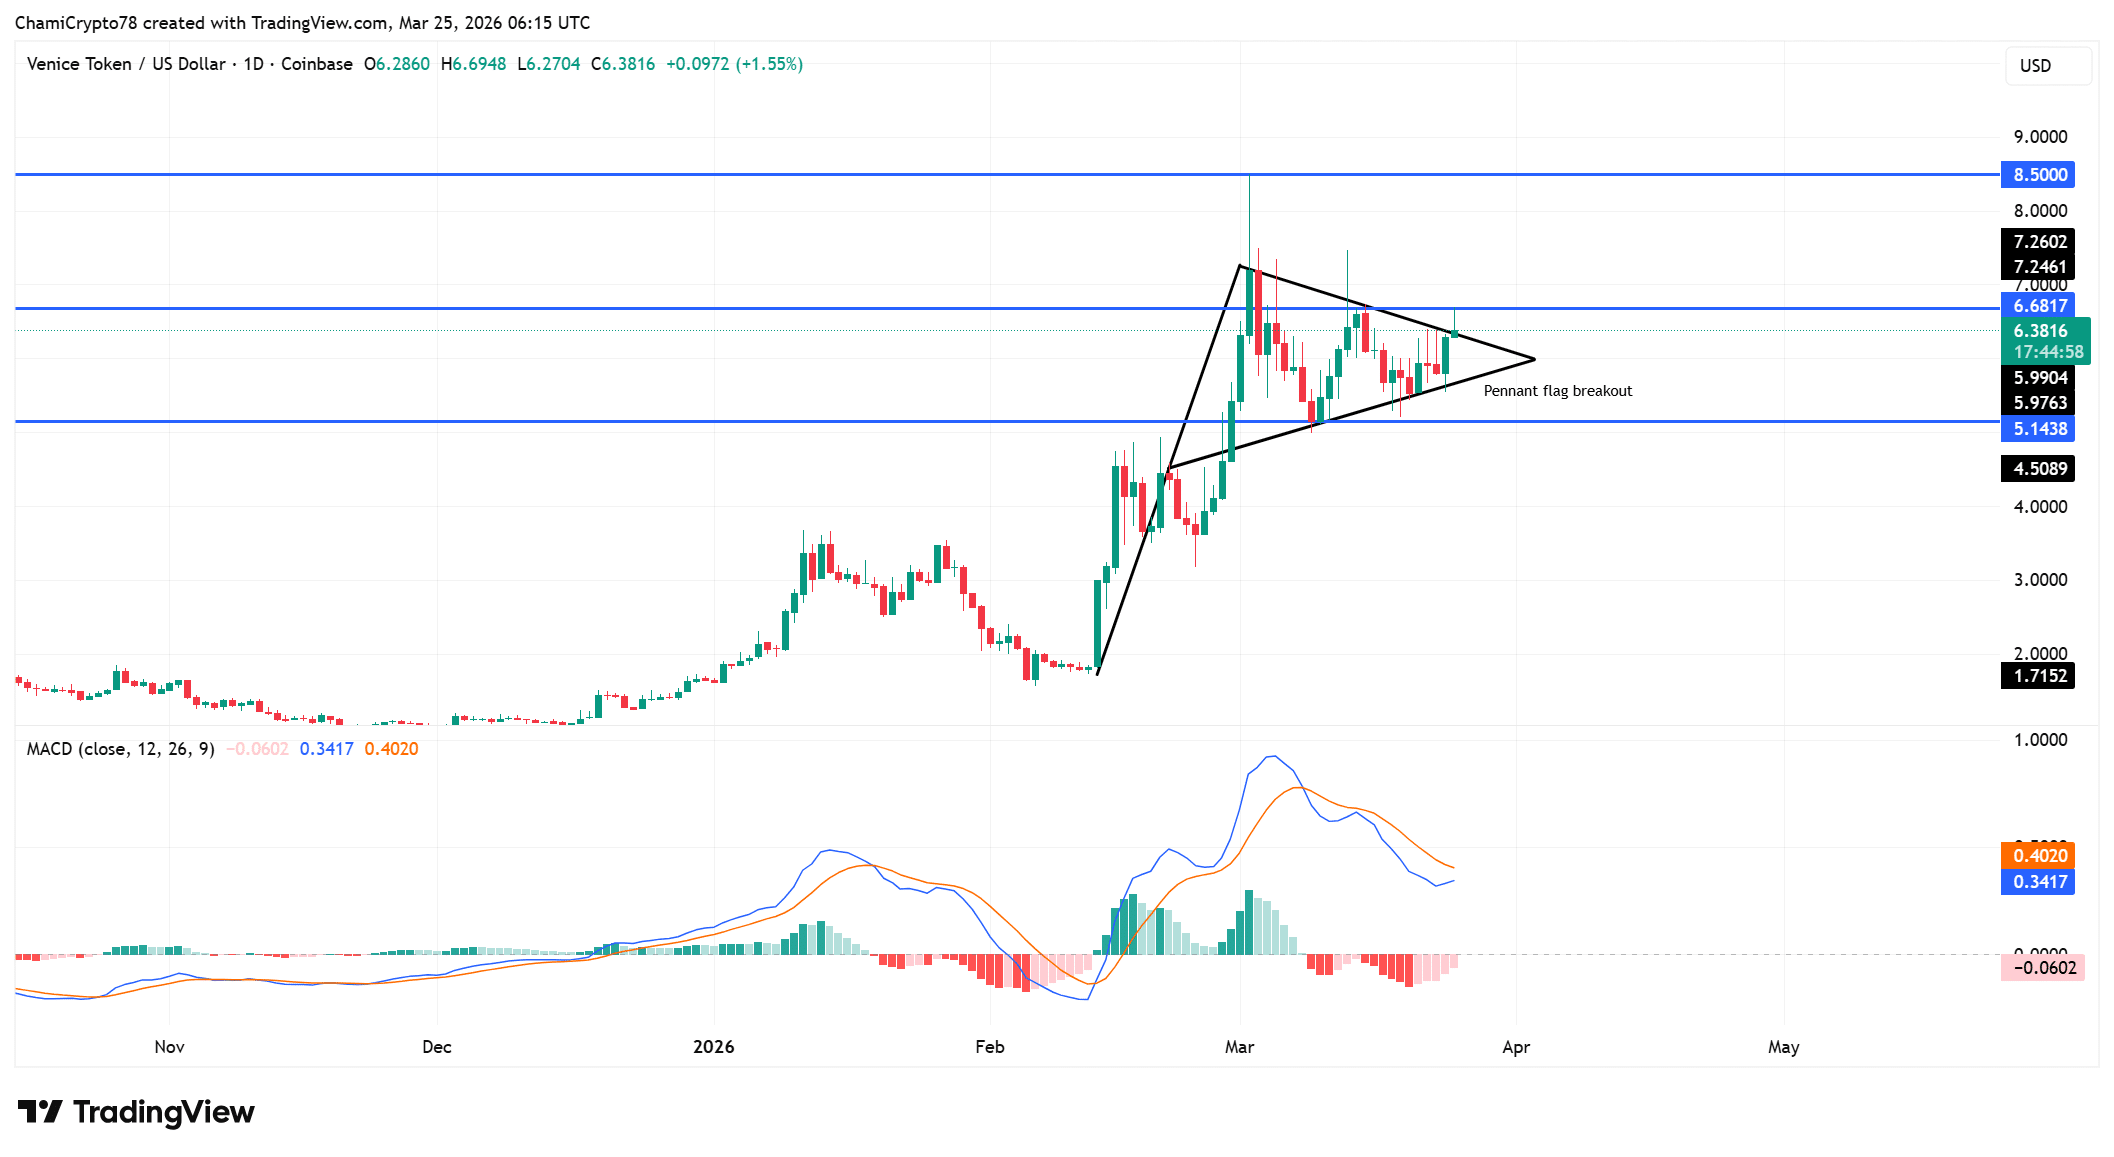
Venice Token (VVV) surged 14.37% to $6.40, supported by a 26.54% increase in trading volume, indicating strong spot market demand. The price broke out of a pennant pattern, shifting the market structure from consolidation to expansion, with immediate resistance at $6.68 and a potential target near $8.50. Key support now lies at $5.14. However, the MACD shows weakening bullish momentum with a negative histogram, suggesting a divergence between price action and underlying strength. Additionally, persistent sell pressure in Spot CVD indicates aggressive selling, though buyers appear to be absorbing it. Open Interest rose 18.74%, reflecting leveraged positioning that could fuel volatility. The rally's sustainability depends on holding above $5.14; a break below could quickly reverse gains.

Venice Token [VVV] has surged 14.37% to $6.40 as trading volume climbs 26.54% to $23.12M, signaling strong demand expansion across the spot market.

This expansion shows that price is not drifting upward but rather advancing through strong spot demand.

As participation increases, the rally reflects conviction instead of low-liquidity spikes. The VVV price increase toward $6.40 highlights alignment between demand and price action.

However, volume expansion at this stage also suggests that traders are reacting to the breakout rather than anticipating it.

As a result, this phase often defines whether continuation can hold or begin to fade under pressure.

VVV breaks free as structure shifts upward

Price has broken out of the pennant flag, ending the prior compression phase and shifting structure toward expansion.

The breakout places immediate resistance at $6.68, while a broader target forms near $8.50 if continuation holds.

Besides, the former consolidation region around $5.14 now acts as a key support base. This transition reflects a shift from indecision into directional control.

However, price now approaches resistance zones where sellers may respond. As a result, holding above the breakout zone remains critical.

If price maintains this structure, the breakout could extend, but failure to hold support would quickly weaken the setup.

The MACD structure shows that bullish strength has not fully aligned with price action.

The indicator has not crossed above the signal line, which limits confirmation of sustained upside pressure.

Additionally, the histogram has turned negative, reflecting weakening strength after the breakout.

This divergence highlights a gap between structural expansion and internal strength. However, price continues holding above key levels, suggesting that buyers still defend the move.

As a result, the current setup reflects early-stage expansion rather than fully confirmed continuation.
Source: TradingView

CVD divergence exposes underlying sell pressure

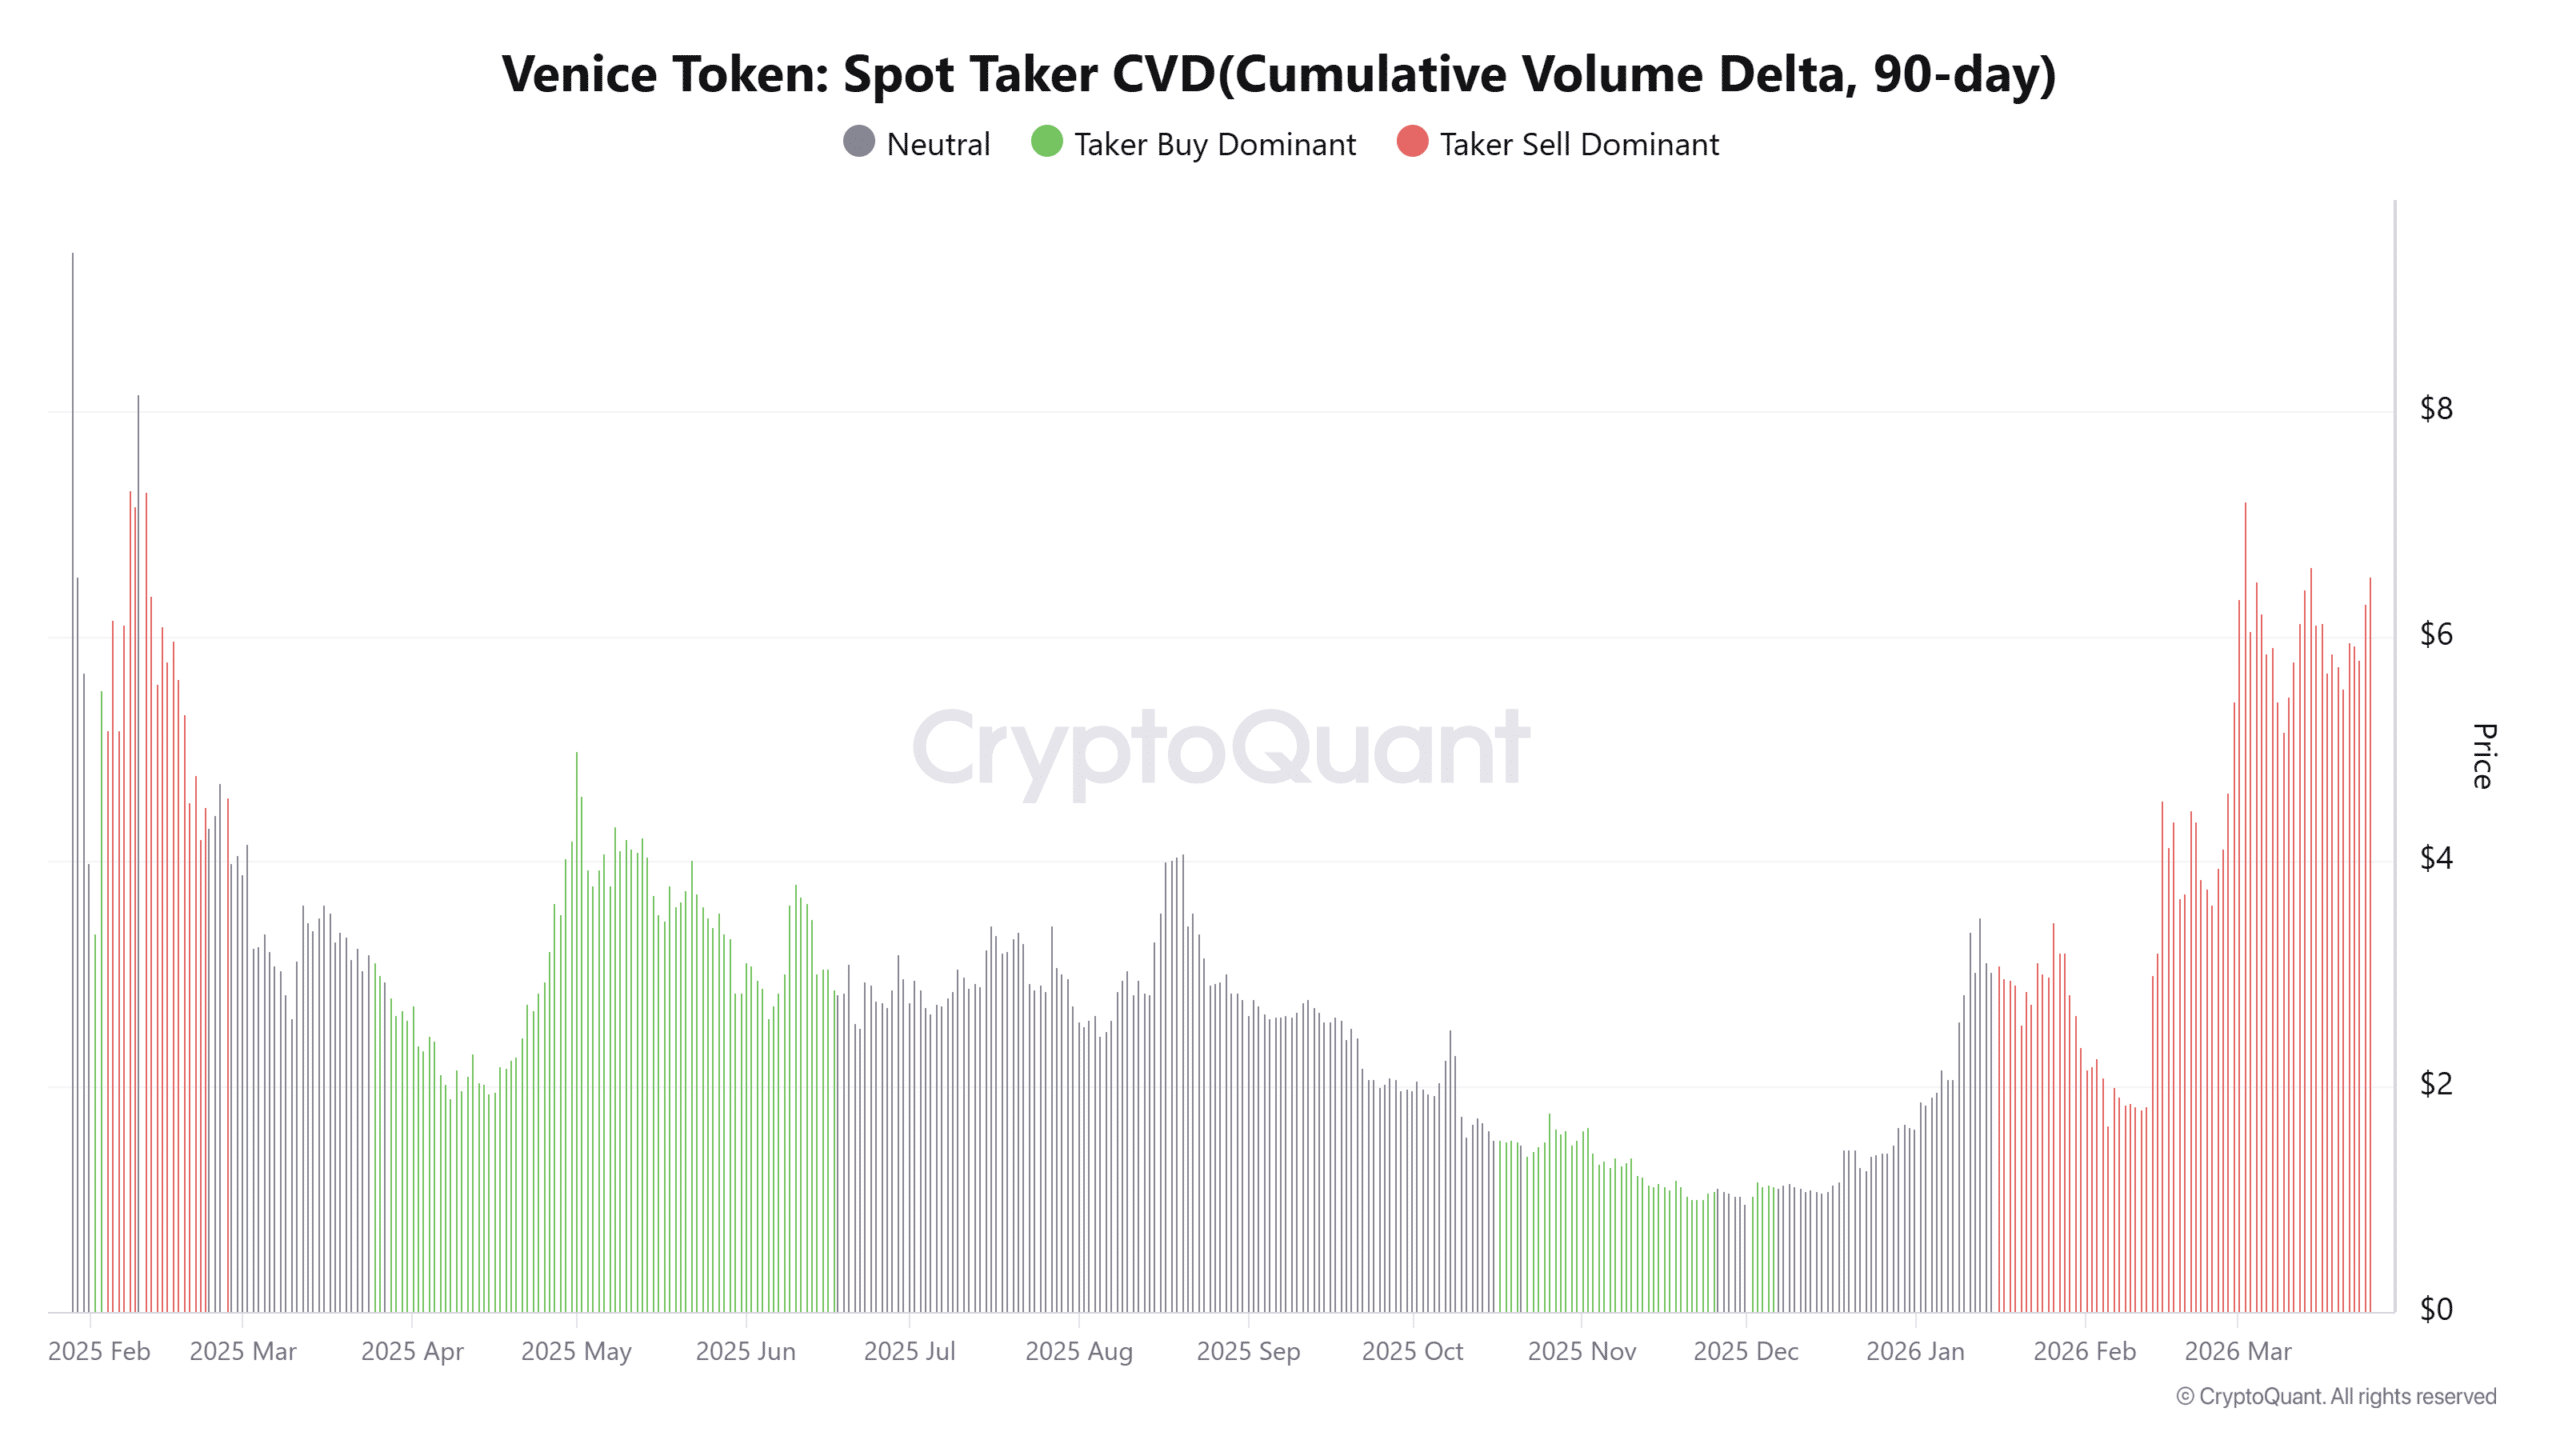
Spot Taker CVD remains sell-dominant over the past 90 days, revealing persistent aggressive selling beneath the rally.

This structure indicates that market participants continue executing sell orders even as price rises.

However, price has not declined, which suggests that larger buyers may be absorbing this supply.

This divergence highlights a key imbalance between visible selling and hidden demand. As a result, the rally depends on continued absorption to sustain upward movement.

If selling pressure intensifies without matching demand, the structure could weaken. However, as long as price holds, this absorption continues supporting the current trend.
Source: CryptoQuant

Open interest rise shows leveraged buildup into VVV breakout

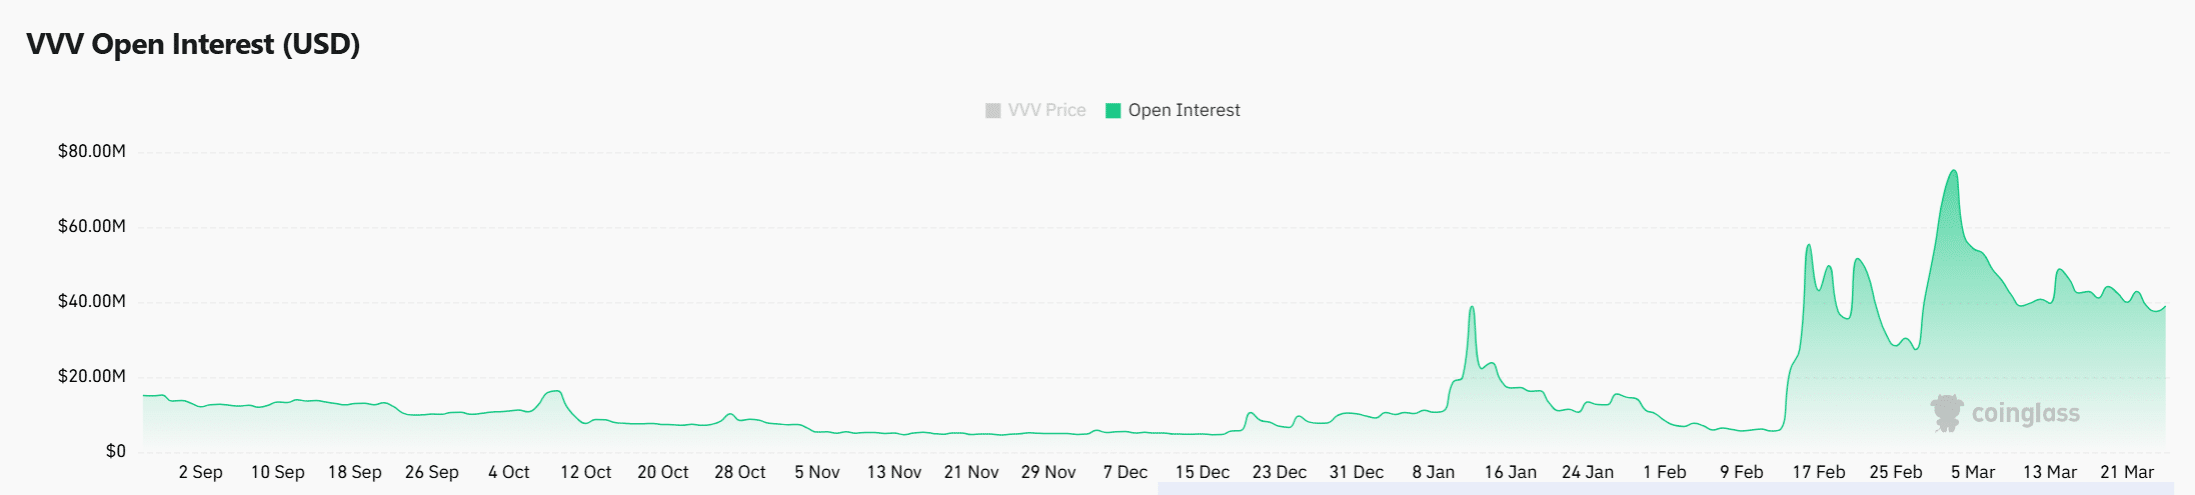
Open interest has increased by 18.74% to $43.21M, reflecting growing participation in derivatives markets.

This rise shows that traders are positioning aggressively as price breaks out of consolidation. However, leveraged positioning introduces volatility, especially near resistance zones.

As positions build, the market becomes sensitive to rapid price movements in either direction. This setup often leads to sharp expansions once liquidity gets triggered.

At the same time, rising open interest without strong confirmation from other indicators increases risk.

If price continues higher, these positions could fuel continuation, but any reversal would quickly unwind these leveraged trades.
Source: CoinGlass


VVV has broken out with strong volume support, which strengthens its bullish structure. However, weakening MACD signals and persistent sell pressure create underlying tension.

The rally can sustain if buyers continue absorbing supply and hold above $5.14. If that support fails, the breakout would likely weaken quickly under pressure.


Final Summary

  • VVV surged 14% to $6.40, backed by a 26% jump in Spot Volume. Breakout above the pennant shifted the structure from consolidation to expansion.
  • Open Interest rose 18%, signaling aggressive leveraged positioning. Rising leverage increases the risk of sharp moves, especially near resistance


Domande pertinenti

QWhat is the current price of Venice Token (VVV) and by what percentage has it surged?

AThe current price of Venice Token (VVV) is $6.40, and it has surged by 14.37%.

QWhat key resistance level does the article identify for VVV after its breakout?

AThe article identifies $6.68 as the immediate resistance level for VVV after its breakout.

QAccording to the MACD indicator, what divergence suggests a lack of full confirmation for the upward price movement?

AThe MACD has not crossed above the signal line, and the histogram has turned negative, indicating a divergence between the price expansion and the underlying bullish strength.

QWhat does the persistent sell-dominant Spot Taker CVD indicate about the market activity?

AThe persistent sell-dominant Spot Taker CVD indicates that there is aggressive selling pressure happening beneath the rally, which is being absorbed by larger buyers to sustain the price increase.

QWhy does the rise in Open Interest introduce increased risk for VVV price movement?

AThe 18.74% rise in Open Interest to $43.21M shows that traders are using significant leverage. This introduces volatility and the risk of sharp price movements in either direction, as these leveraged positions could quickly unwind if the price reverses.

Letture associate

a16z: From Companies to DAOs, DUNA May Become the Next Generation Organizational Form

This article, "From Companies to DAOs: How DUNA Could Become the Next Organizational Form," traces the 500-year evolution of business collaboration. It begins with medieval structures like the *commenda* and Florentine *compagnia*, which exposed partners to personal risk. The modern corporation, exemplified by the Dutch East India Company (VOC), was a revolutionary leap, enabling large-scale, capital-intensive ventures by offering limited liability and reducing coordination costs. However, corporations introduced new challenges like principal-agent problems and bureaucratic overhead. The piece argues that software and internet-native protocols are now reducing these traditional overheads. Decentralized Autonomous Organizations (DAOs) emerged as a new model for coordination without centralized management. Yet, DAOs face a significant legal vacuum: they lack legal recognition, leaving members exposed to unlimited personal liability, and their tokens are vulnerable to being classified as securities under unclear regulations (e.g., the Howey Test). This has forced projects into suboptimal workarounds like offshore foundations. The article identifies the Decentralized Unincorporated Nonprofit Association (DUNA) as a potential solution. Recently legalized in states like Wyoming, the DUNA provides a legal wrapper for decentralized networks. It grants key protections—legal personality, limited liability, and perpetual existence—to a group without imposing a traditional hierarchical management structure. This allows token-holder communities to govern, hold assets, and contract as a single legal entity, aligning with their decentralized nature. While DUNA doesn't solve all governance challenges or magically resolve securities law questions, it represents a crucial step. It fills the legal recognition gap, offering a native legal form for internet-scale, decentralized collaboration and extending the separation of personal risk from organizational venture into a new domain.

marsbit24 min fa

a16z: From Companies to DAOs, DUNA May Become the Next Generation Organizational Form

marsbit24 min fa

2026 Mid-Year Report On-Chain RWA: Tokenized Stock Market Cap Doubles in a Year, But 90% of Rights Are Hollow Shells

The 2026 Mid-Year Report on On-Chain RWA highlights a significant growth in tokenized stock market capitalization, which nearly doubled from $951 million in March to $1.89 billion by July. However, the report reveals a fundamental contradiction in this "layer 2.5" ecosystem: products with the strongest legal foundation (like regulated U.S. infrastructure) lack liquidity and distribution, while freely tradable offshored wrapper products often lack substantive ownership rights. The increase is driven largely by a few products (SECZ, FGRS, STRCx) and platforms (Ondo, xStocks, Securitize collectively hold over 85% share). While distributed value across networks like Ethereum, Solana, and BNB Chain has grown, the market remains fragmented. Products referencing the same underlying asset (e.g., Apple stock) are distinct legal liabilities with different intermediaries and jurisdictional rules, offering varying degrees of legal claim. The report cautions that headline numbers are misleading, as they reflect changes in distributed token value—driven by issuance, conversions, and price movements—not pure investor inflows. True "canonical shares" with legal ownership, wide wallet distribution, institutional liquidity, and independent on-chain price discovery do not yet exist at scale. Tokenized treasuries show stronger product-market fit, and ETFs may be easier to scale than single stocks. The core takeaway is a trade-off: legal certainty versus liquidity and composability.

marsbit1 h fa

2026 Mid-Year Report On-Chain RWA: Tokenized Stock Market Cap Doubles in a Year, But 90% of Rights Are Hollow Shells

marsbit1 h fa

Coldcard Hardware Wallet Hacked: 594 Bitcoin Withdrawn in 25 Minutes

The Coldcard hardware wallet has been compromised, with hackers stealing approximately 594.5 Bitcoin (~$40 million) from 500 addresses in just 25 minutes. The root cause was a critical software bug, undetected for five years, which disabled the device's secure chip for generating true random numbers. This led to the creation of private keys based on predictable data like the processor's serial number, drastically reducing cryptographic security. The attackers exploited this offline by brute-forcing possible seed phrases, finding active addresses on the public ledger, and signing transactions. Initially, Coinkite (Coldcard's maker) claimed only older models were at risk but later admitted all devices running the compromised firmware were vulnerable. CEO Rodolphe Novak (NVK) apologized but ruled out financial compensation for affected users. To secure funds, owners must urgently update their firmware to specific safe versions, generate a completely new seed phrase on the updated device, and transfer all assets to new addresses created with that new seed. While a BIP-39 passphrase can help, it does not replace this migration process. Other Coinkite products like TAPSIGNER were not affected. This incident underscores that even specialized hardware requires rigorous, independent code audits, especially for cryptographic functions. It parallels past failures, like a 2006 OpenSSL bug in Debian, and raises questions about whether automated code analysis can ever fully replace human scrutiny in critical security areas.

cryptonews.ru3 h fa

Coldcard Hardware Wallet Hacked: 594 Bitcoin Withdrawn in 25 Minutes

cryptonews.ru3 h fa

Trading

Spot
活动图片