Unexpectedly Negative! US July Retail Sales Drop 0.6% Month-over-Month, Marking the Largest Decline in Over a Year

marsbitPubblicato 2026-08-14Pubblicato ultima volta 2026-08-14

Introduzione

U.S. Retail Sales Unexpectedly Fall Sharply in July U.S. retail sales in July declined by 0.6% month-on-month, marking the largest drop since May 2025 and falling significantly short of the market expectation for a 0.1% gain. The cooling demand, driven by decreases in auto purchases and online sales, has prompted a more cautious outlook on consumer spending resilience for the second half of the year. The closely watched "control group" sales, which exclude autos, gasoline, building materials, and food services and directly feed into GDP calculations, fell 0.4%, missing expectations of a 0.3% increase. Core retail sales (excluding autos and gasoline) also fell 0.2%, against an anticipated 0.3% rise. Economists attribute the weakness to several factors: the fading boost from excess tax refunds earlier in the year, a decline in personal savings rates, and temporary disruptions. These include the shift of major promotional events like Amazon's Prime Day to June, hot weather around the July 4 holiday, and the post-World Cup spending lull. Specific categories like clothing, gasoline, and furniture saw declines. Notably, the consumption slowdown is accompanied by a shift in spending patterns across income groups. Recent data shows spending growth among low-income households has outpaced that of high-income households in recent weeks, even for discretionary goods, suggesting a potential convergence from the previous "K-shaped" economic recovery into a more uniform "C-shaped" patte...

Author: Bu Shuqing, Wall Street News

US consumer demand cooled significantly in July, with retail sales data falling far short of expectations, leading the market to adopt a more cautious stance on consumption resilience in the second half of the year.

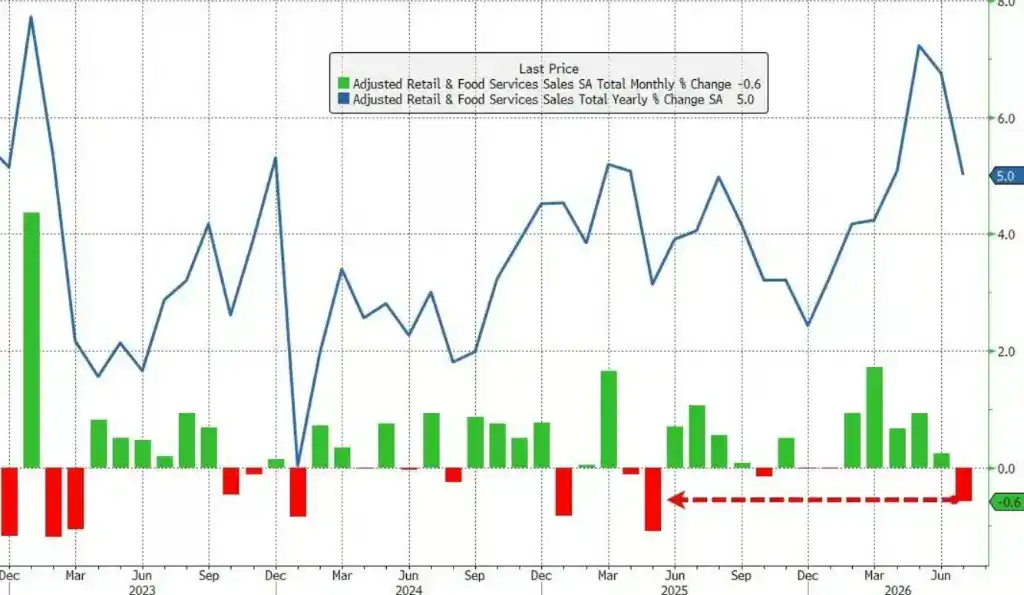
Data released by the US Census Bureau on Friday showed that the monthly retail sales volume in July fell by 0.6%, marking the largest single-month decline since May 2025 and significantly below the market expectation of a 0.1% increase. Reduced car purchases and a pullback in online retail were the main drags.
Excluding automobiles and gasoline, July retail sales fell 0.2% month-over-month, compared to an expected increase of 0.3%.

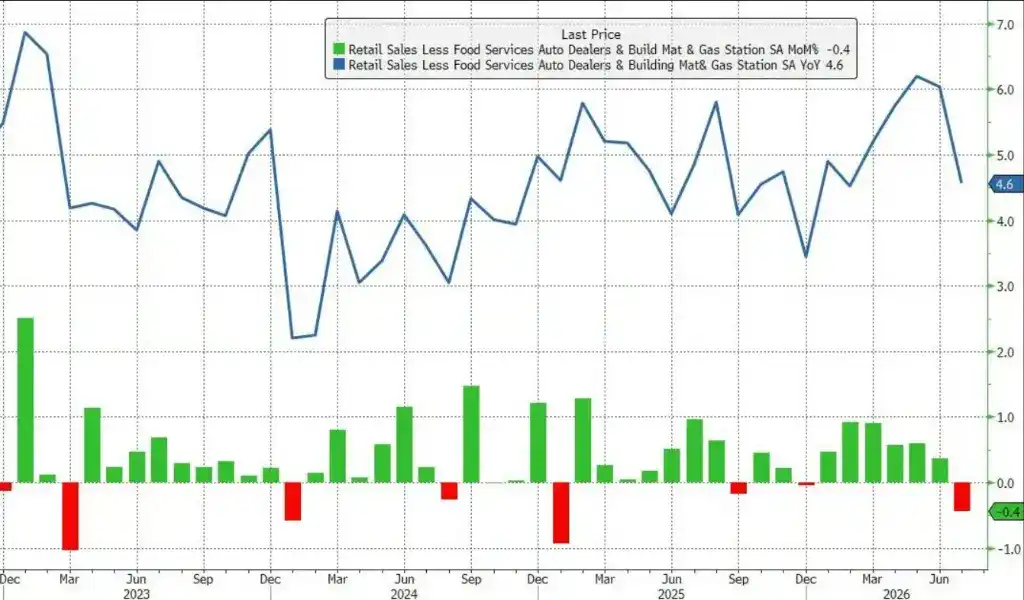
The core retail sales (the "control group" measure), which is directly related to GDP calculations and seen as a "bellwether" for consumer spending, also fell by 0.4% month-over-month, significantly missing the expected 0.3% gain.

Following the release of this data, market concerns about the outlook for US consumer spending have intensified. Economists widely pointed out that the one-time boost from excess tax refunds in the first half of 2026 has gradually faded, and with the personal savings rate falling to a four-year low in June, the sustained momentum on the consumer side is uncertain.

Analysts believe that the unusual weakness in July's data is partly due to the concentrated release of short-term disruptive factors.

As Bank of America analysts previously predicted, the timing of this year's Prime Day and related promotional events shifted forward from July to June, causing a significant forward shift in online (non-store) retail consumption, which consequently led to a notable decline in online sales for July.

Looking at the breakdown, clothing, gasoline (affected by falling oil prices), and furniture sales all recorded month-over-month declines. Furthermore, the heatwave around the US Independence Day on July 4th and the waning consumer enthusiasm after the end of the World Cup were also considered to have exerted some drag on retail activity for the month.

On a year-over-year basis, July retail sales still grew by 5.0%, with the absolute level remaining relatively robust, but the growth rate has slowed compared to previous periods.

Among all the sub-indicators, the performance of the "control group" sales data is the most closely watched by the market. This measure excludes automobiles, gasoline, building materials, and food services, and is directly used to calculate Personal Consumption Expenditures (PCE), which is then incorporated into GDP calculations, making it a key indicator for gauging the underlying momentum of consumption.

The 0.4% month-over-month decline in control group sales in July, compared to the market expectation of a 0.3% increase, represents a deviation of 0.7 percentage points. This significant miss may put downward pressure on Q3 GDP growth forecasts.
Bank of America data shows that core retail sales excluding automobiles and gasoline fell 0.2% month-over-month, also worse than the expected decline of 0.2%—in summary, all core indicators showed a significantly weaker-than-expected trend.

It's worth noting that this round of consumption cooling is not evenly distributed across income groups, reflecting subtle changes in consumption structure.

The latest Bank of America credit card spending data shows that in the four consecutive weeks ending August 1st, the year-over-year spending growth rate for low-income households has consistently been higher than that for high-income households. This marks a significant reversal from the persistent K-shaped divergence seen in recent years—where high-income group consumption was strong while low-income groups were relatively pressured.

Even within discretionary spending categories, this trend holds true and is not solely driven by gasoline price changes. Low-income groups show robust discretionary spending, while high-income groups show modest cooling. Bank of America believes this indicates that the K-shaped economic pattern is gradually converging towards a "C-shape," meaning consumption trends across income tiers are becoming more aligned.

For the market, this implies that some retail sectors that previously relied on consumption by high-income groups may face some growth pressure.


Domande pertinenti

QWhat was the headline figure for US retail sales in July, and how did it compare to expectations?

AUS retail sales in July fell by 0.6% month-over-month. This was the largest monthly decline since May 2025 and significantly missed market expectations for a 0.1% increase.

QAccording to the article, what are the two main items that dragged down the overall retail sales figure in July?

AThe two main drags on the overall retail sales figure were decreased automobile purchases and a decline in online retail sales.

QWhat is the 'control group' retail sales metric, and why is it important?

AThe 'control group' retail sales metric excludes volatile categories like automobiles, gasoline, building materials, and food services. It is directly used to calculate Personal Consumption Expenditures (PCE), which is a key component of GDP, making it a crucial indicator of underlying consumer spending momentum.

QWhat new trend in consumer spending by income group does the article mention based on Bank of America data?

AAccording to Bank of America's credit card data, consumer spending growth for low-income households has recently been higher than for high-income households. This represents a reversal of the previous 'K-shaped' divergence and suggests a convergence toward a more uniform 'C-shaped' pattern across income levels.

QWhat are some of the temporary factors cited in the article that may have contributed to the weak July retail sales data?

ASeveral temporary factors contributed to the weak data: the shift of Prime Day and related promotions from July to June, which pulled forward online spending; hot weather around the July 4th holiday; a post-World Cup decline in consumer enthusiasm; and lower gasoline prices affecting the gas station sales component.

Letture associate

Current State of Web3 Projects: 200 Projects Cease Updates Monthly, Only 70 New Ones Emerge

The article discusses a significant decline in active Web3 projects, based on data from RootData's "2026 Crypto Industry Dead Project Collection." It highlights that approximately 200 projects cease social media updates monthly, while only 70-100 new ones emerge, indicating a net loss in the active project count since mid-2025. RootData's methodology for identifying "dead" projects relies on three objective criteria: official announcements of shutdown, over six months of inactivity across key platforms (like X and Discord), or the inability to access official websites/social accounts. Over 70% of identified dead projects fall into the long-term inactivity category. Currently, RootData tracks over 20,000 crypto projects, with only about 2,200 considered active based on August social media updates. The analysis suggests the crypto industry is undergoing a deep consolidation phase. While infrastructure projects are declining among new entries (now under 10%), new projects are increasingly focused on application and distribution layers, with over 65% in categories like prediction markets, RWA cards, tokenized stocks, perpetual contracts, AI agents, and memecoins. The article concludes that this shakeout, driven by reduced VC funding, may force greater focus on sustainable business models and real user demand, potentially strengthening the ecosystem's long-term health.

marsbit1 h fa

Current State of Web3 Projects: 200 Projects Cease Updates Monthly, Only 70 New Ones Emerge

marsbit1 h fa

Trading

Spot
活动图片