Author: Xu Chao
Source: Wall Street News
A-share tech stocks have staged a strong rebound, with trading activity repeatedly hitting new highs, raising market concerns about crowding. However, the latest research report from UBS Securities offers a more reassuring judgment: although the trading volume and market cap proportion of the large tech sector have both surpassed historical highs, key indicators measuring the concentration of institutional holdings show that the current crowdedness is still significantly below historical peaks, and the duration of this tech growth style has not yet reached two years.
According to the latest UBS Securities report, as of the first quarter of 2026, the overweight ratio of public funds in the large tech sector (including electronics, communications, computers, and defense) was 9.9%, lower than the 11.6% in the third quarter of 2025 and significantly lower than the historical peak of 14.1% in the fourth quarter of 2015; it also lags far behind the historical maximum overweight ratio of 18.7% for the consumer sector.
UBS points out that it typically takes about three years for the public fund overweight ratio to cycle from a trough to a peak. Since the policy pivot in September 2024, the outperformance of this tech growth style has lasted less than two years so far.
Meanwhile, the A-share earnings recovery is accelerating, providing more solid fundamental support for the market rally.
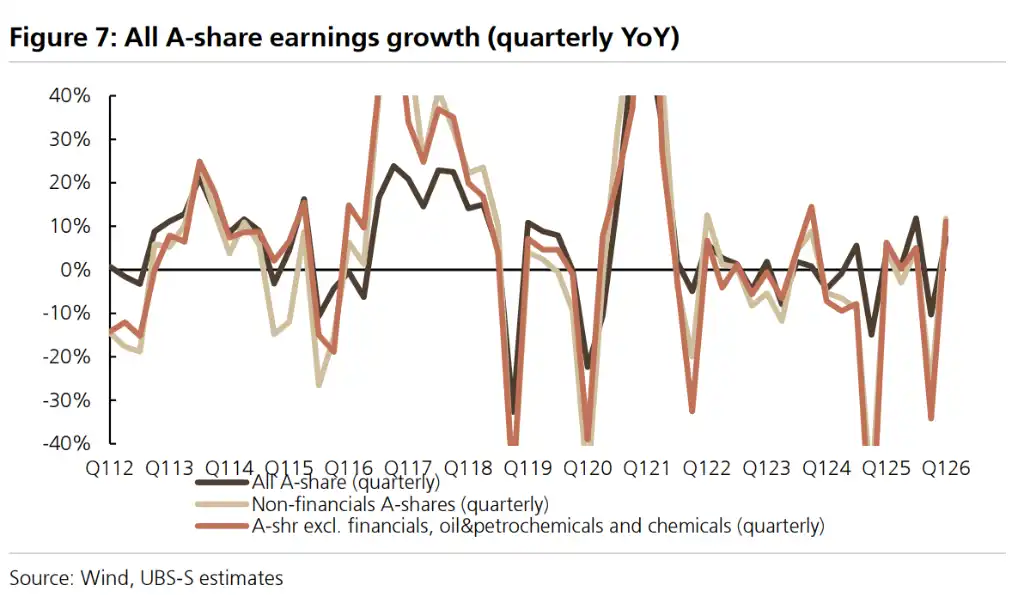
UBS expects the profit growth rate for all A-shares to rise from 3.9% in 2025 to 11% in 2026. In the first quarter of 2026, non-financial sector profits increased by 11.8% year-on-year, with both gross margin and net profit margin hitting their highest levels since 2023. Continued inflows from multiple funding channels, sustained expansion of industry-theme ETF sizes, and the recovery of private fund issuance collectively form important support for the current market micro-liquidity.
In tactical allocation, UBS leans towards growth and cyclical styles under its baseline "slow bull" scenario. At the sector level, it strongly favors electronics, communications, electrical equipment, machinery, non-ferrous metals, and chemicals, and maintains buy ratings on multiple related stocks.
Tech Overweight Ratio Still Has Room, Current Style Duration Still Short
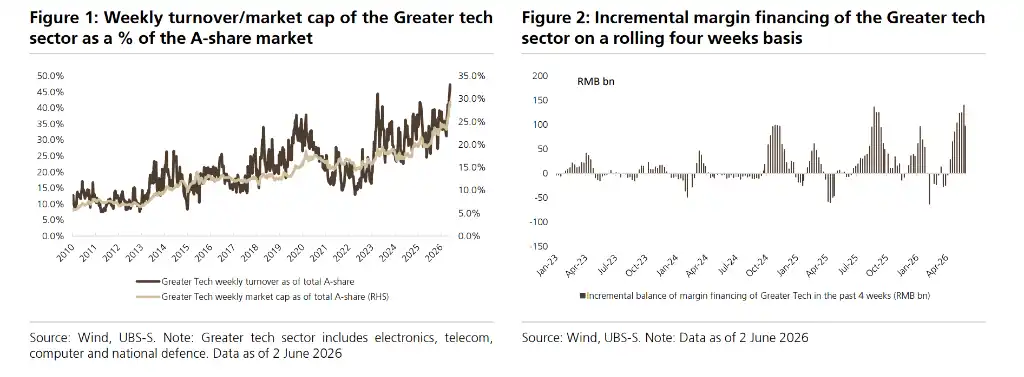
The trading heat and capital concentration in the tech sector have warmed up significantly recently.
According to UBS data, as of June 2, 2026, the weekly trading volume of the large tech sector accounted for 45.5% of total A-share trading volume, and its market cap accounted for 28.6% of the total market. Both metrics are at historical highs. Since the Iran-US ceasefire on April 8, which repaired risk appetite, the STAR 50 and ChiNext indices have surged 35.5% and 30.4% cumulatively, significantly outperforming the 11.0% gain of the Wind All-A Index and the 9.8% gain of the CSI 300 Index over the same period.
However, UBS believes that using trading heat and short-term gains to judge crowdedness has limitations, and the public fund overweight ratio is a more core indicator for measuring institutional positioning concentration. From this perspective, the current overweight ratio of the large tech sector is not only lower than its own historical peak but also far behind levels seen at historical peaks for the consumer sector, such as 22.8% in the third quarter of 2010 and 21.0% in the third quarter of 2012.
UBS reviewed the historical patterns of five major style rotations in A-shares since 2014:
- From 2014 to 2015, leveraged funds drove sharp market fluctuations.
- From 2017 to 2019, foreign inflows fueled the "blue-chip stock" rally.
- From 2019 to 2021, public funds chased profit-compounding companies, forming a positive feedback loop.
- From 2022 to before the policy pivot in 2024, insurance capital and the "national team" drove defensive sectors to outperform.
- After the policy pivot in 2024, margin financing, ETFs, and private funds have propelled the outperformance of small-cap and growth styles.
The study found that each style typically lasts about three years from formation to rotation — the high fundamental growth of a single sector rarely lasts more than three years, and there is a natural ceiling to fund concentration. Pressure from redemptions after narrowing outperformance transmits to stock prices and triggers a trend reversal.
However, signals from some sub-sectors are already worth noting. The overweight ratio for the electronics sector has reached 6.6%, exceeding the previous high of 5.4% in the third quarter of 2020. The overweight ratio for the communications sector has refreshed its record high since 2010 for three consecutive quarters, reaching 4.0%. UBS stated it will continue to monitor changes in related indicators.
Earnings Recovery Accelerates, Solidifying Market Rally Foundation
UBS expects the profit growth rate for all A-shares to rise to 11% in 2026 and points out that multiple top-down and bottom-up indicators confirm the acceleration of the earnings improvement trend.
Based on Q1 2026 earnings data, the year-on-year profit growth rate for non-financial A-shares surged from 0.8% in 2025 to 11.8%; excluding oil, petrochemicals, and basic chemicals, the growth rate reached 12.3%. The profit growth rate for the STAR Market in Q1 was as high as 204.7%, and the ChiNext Market reached 22.7%, both significantly outperforming the main board's 5.5%. Gross margin and net profit margin increased by 0.6 and 0.3 percentage points year-on-year, respectively, both hitting their highest levels since 2023, indicating that margin pressure for downstream companies remains manageable despite high oil prices.
On the macro level, April PPI rose 2.8% year-on-year, and CPI rose 1.2%. UBS expects inflation to rise further in the coming months. Since non-financial A-share revenue growth is highly correlated with nominal GDP and PPI trends, rising inflation will directly drive faster expansion on the revenue side.
Bottom-up data also confirms the upward profit trend.
In the first four months of this year, profits for industrial enterprises above designated size grew 18.2% year-on-year, with profits in computer, communication, and electronic equipment manufacturing soaring 107.7% year-on-year; profits in non-ferrous metal mining, mining, and coal washing sectors grew 94.9%, 26.0%, and 21.0% year-on-year, respectively. Regarding profit expectations, earnings growth expectations for the IT, raw materials, real estate, and energy sectors over the past six months have all been revised upward by more than 20 percentage points. The trajectory of these upward revisions is highly similar to past earnings upcycle years like 2017, 2019, and 2021.
From a medium-term perspective, an increasing share of overseas business is another important support for margin expansion. The proportion of overseas revenue for non-financial A-shares has steadily increased from 9.5% in 2010 to 18.7% in 2025. Furthermore, the gross margin of overseas business has consistently been higher than that of domestic business, with the gap widening further in 2025. UBS believes that the continued advancement of "anti-involution" policies and the implementation of supportive policies will also drive further sector margin recovery over the medium term.
Tactical Allocation: Emphasis on Growth and Cyclicals, Six Sectors Overweighted
At the style allocation level, under its baseline "slow bull" scenario, UBS favors growth styles. The backdrop of rising PPI and industrial profits supports cyclical styles. Sustained ample liquidity and high market turnover favor small-cap styles.
However, the continued expansion of industry-theme ETF sizes is providing additional capital support to leading companies. UBS expects the relative performance of large-cap versus small-cap styles to be more balanced in the second half of the year compared to 2025.
At the sector level, UBS is overweight six areas: Electronics (benefiting from semiconductor inventory cycle recovery and AI innovation), Communications (driven by AI computing demand and widespread adoption of industrial internet, fueling profit growth for sub-sector leaders), Machinery (automation equipment and industrial robotics benefiting from domestic capital expenditure recovery and import substitution), Non-ferrous Metals (rising copper and aluminum prices, lithium sector demand recovery), Chemicals (advancement of anti-involution and accelerated exit of overseas capacity accelerating bottom formation), and Electrical Equipment (policy support and AI data center power demand driving energy storage development).