‘TACO’ Is Outdated, Wall Street Embraces ‘NACHO’ Trading

marsbitPubblicato 2026-05-09Pubblicato ultima volta 2026-05-09

Introduzione

The Wall Street trading meme "TACO" (Trump Always Chickens Out) is being replaced by "NACHO" (Not A Chance Hormuz Opens), signaling a major shift in market expectations. TACO bets anticipated de-escalation from political figures, but this pattern broke on March 23rd when a Trump social media post claiming progress with Iran was denied by Tehran, causing a sharp but temporary market reversal. Since then, markets have adopted a NACHO mindset, betting the Strait of Hormuz will remain closed for an extended period. This view is reflected in three key markets. First, war risk insurance premiums for vessels transiting the strait have skyrocketed. Second, the oil futures curve shows a steep backwardation, with near-term prices far exceeding long-dated contracts, indicating expectations for a prolonged but not permanent supply crunch. Third, Federal Reserve rate cut expectations for 2026 have been priced out to zero due to persistent oil-price inflation. While the S&P 500 continues hitting record highs, the market internally reflects NACHO's impact. The energy sector ETF (XLE) has vastly outperformed the transportation sector ETF (IYT), as high oil prices directly benefit producers but squeeze transport and logistics companies' margins. The NACHO trade has a concrete deadline. Analysts warn global commercial oil inventories could reach critical "operational pressure" levels by early June. If the strait remains closed into September, OECD stocks may fall below the operational floor...

On Wall Street, ‘TACO trading’ is out of style, and everyone is now discussing a new trading pattern—‘NACHO’.

Since the U.S.-Israel airstrike on Iran on February 28th, the Strait of Hormuz has remained closed. Oil prices are now up over 50% from pre-war levels, and the market's expectation for Federal Reserve rate cuts in 2026 has been compressed from 2 cuts pre-war to the current 0 cuts. Yet, during the same period, the S&P 500 has hit record highs, rallying for six consecutive weeks—its longest winning streak since 2024.

Wall Street has given this seemingly contradictory market state a name: NACHO, short for ‘Not A Chance Hormuz Opens’. It's the opposite of TACO (Trump Always Chickens Out). TACO bets on ‘people backing down’—that Trump would retreat at critical moments. NACHO bets on ‘things getting stuck’—that this time, the Strait of Hormuz cannot be reopened with just one Truth Social post.

eToro market analyst Zavier Wong described this shift: ‘For most of the crisis, every ceasefire headline caused oil prices to plunge sharply. Traders kept betting on a solution that never arrived. NACHO means the market acknowledges that high oil prices are not a one-time shock; they are the current market environment itself.’

Two Diverging Lines in Early April

March 23rd was the tipping point where the TACO pattern failed. That morning, Trump announced on Truth Social that he had held ‘very good constructive talks’ with Iran and ordered the Pentagon to halt strikes on Iranian energy facilities for five days. S&P 500 futures rebounded nearly 4% from lows within minutes, instantly adding $1.7 trillion in market value. Brent crude fell from $109 intraday to $92.

Then, Iranian officials denied the talks took place. According to Iranian state media, a ‘senior security official’ called it a market manipulation tactic, stating no dialogue ever occurred. The gains were halved within two hours, with the S&P closing only +1.15% and Brent rebounding to $99.94.

That was the first time in 14 months that Trump's ‘backing down’ no longer moved the market effectively. The reason isn't complicated: backing down in the TACO pattern was one-sided, deliverable with a single post. The retreat on March 23rd required Iran's cooperation. When the counterparty didn't cooperate, the retreat turned into a lie.

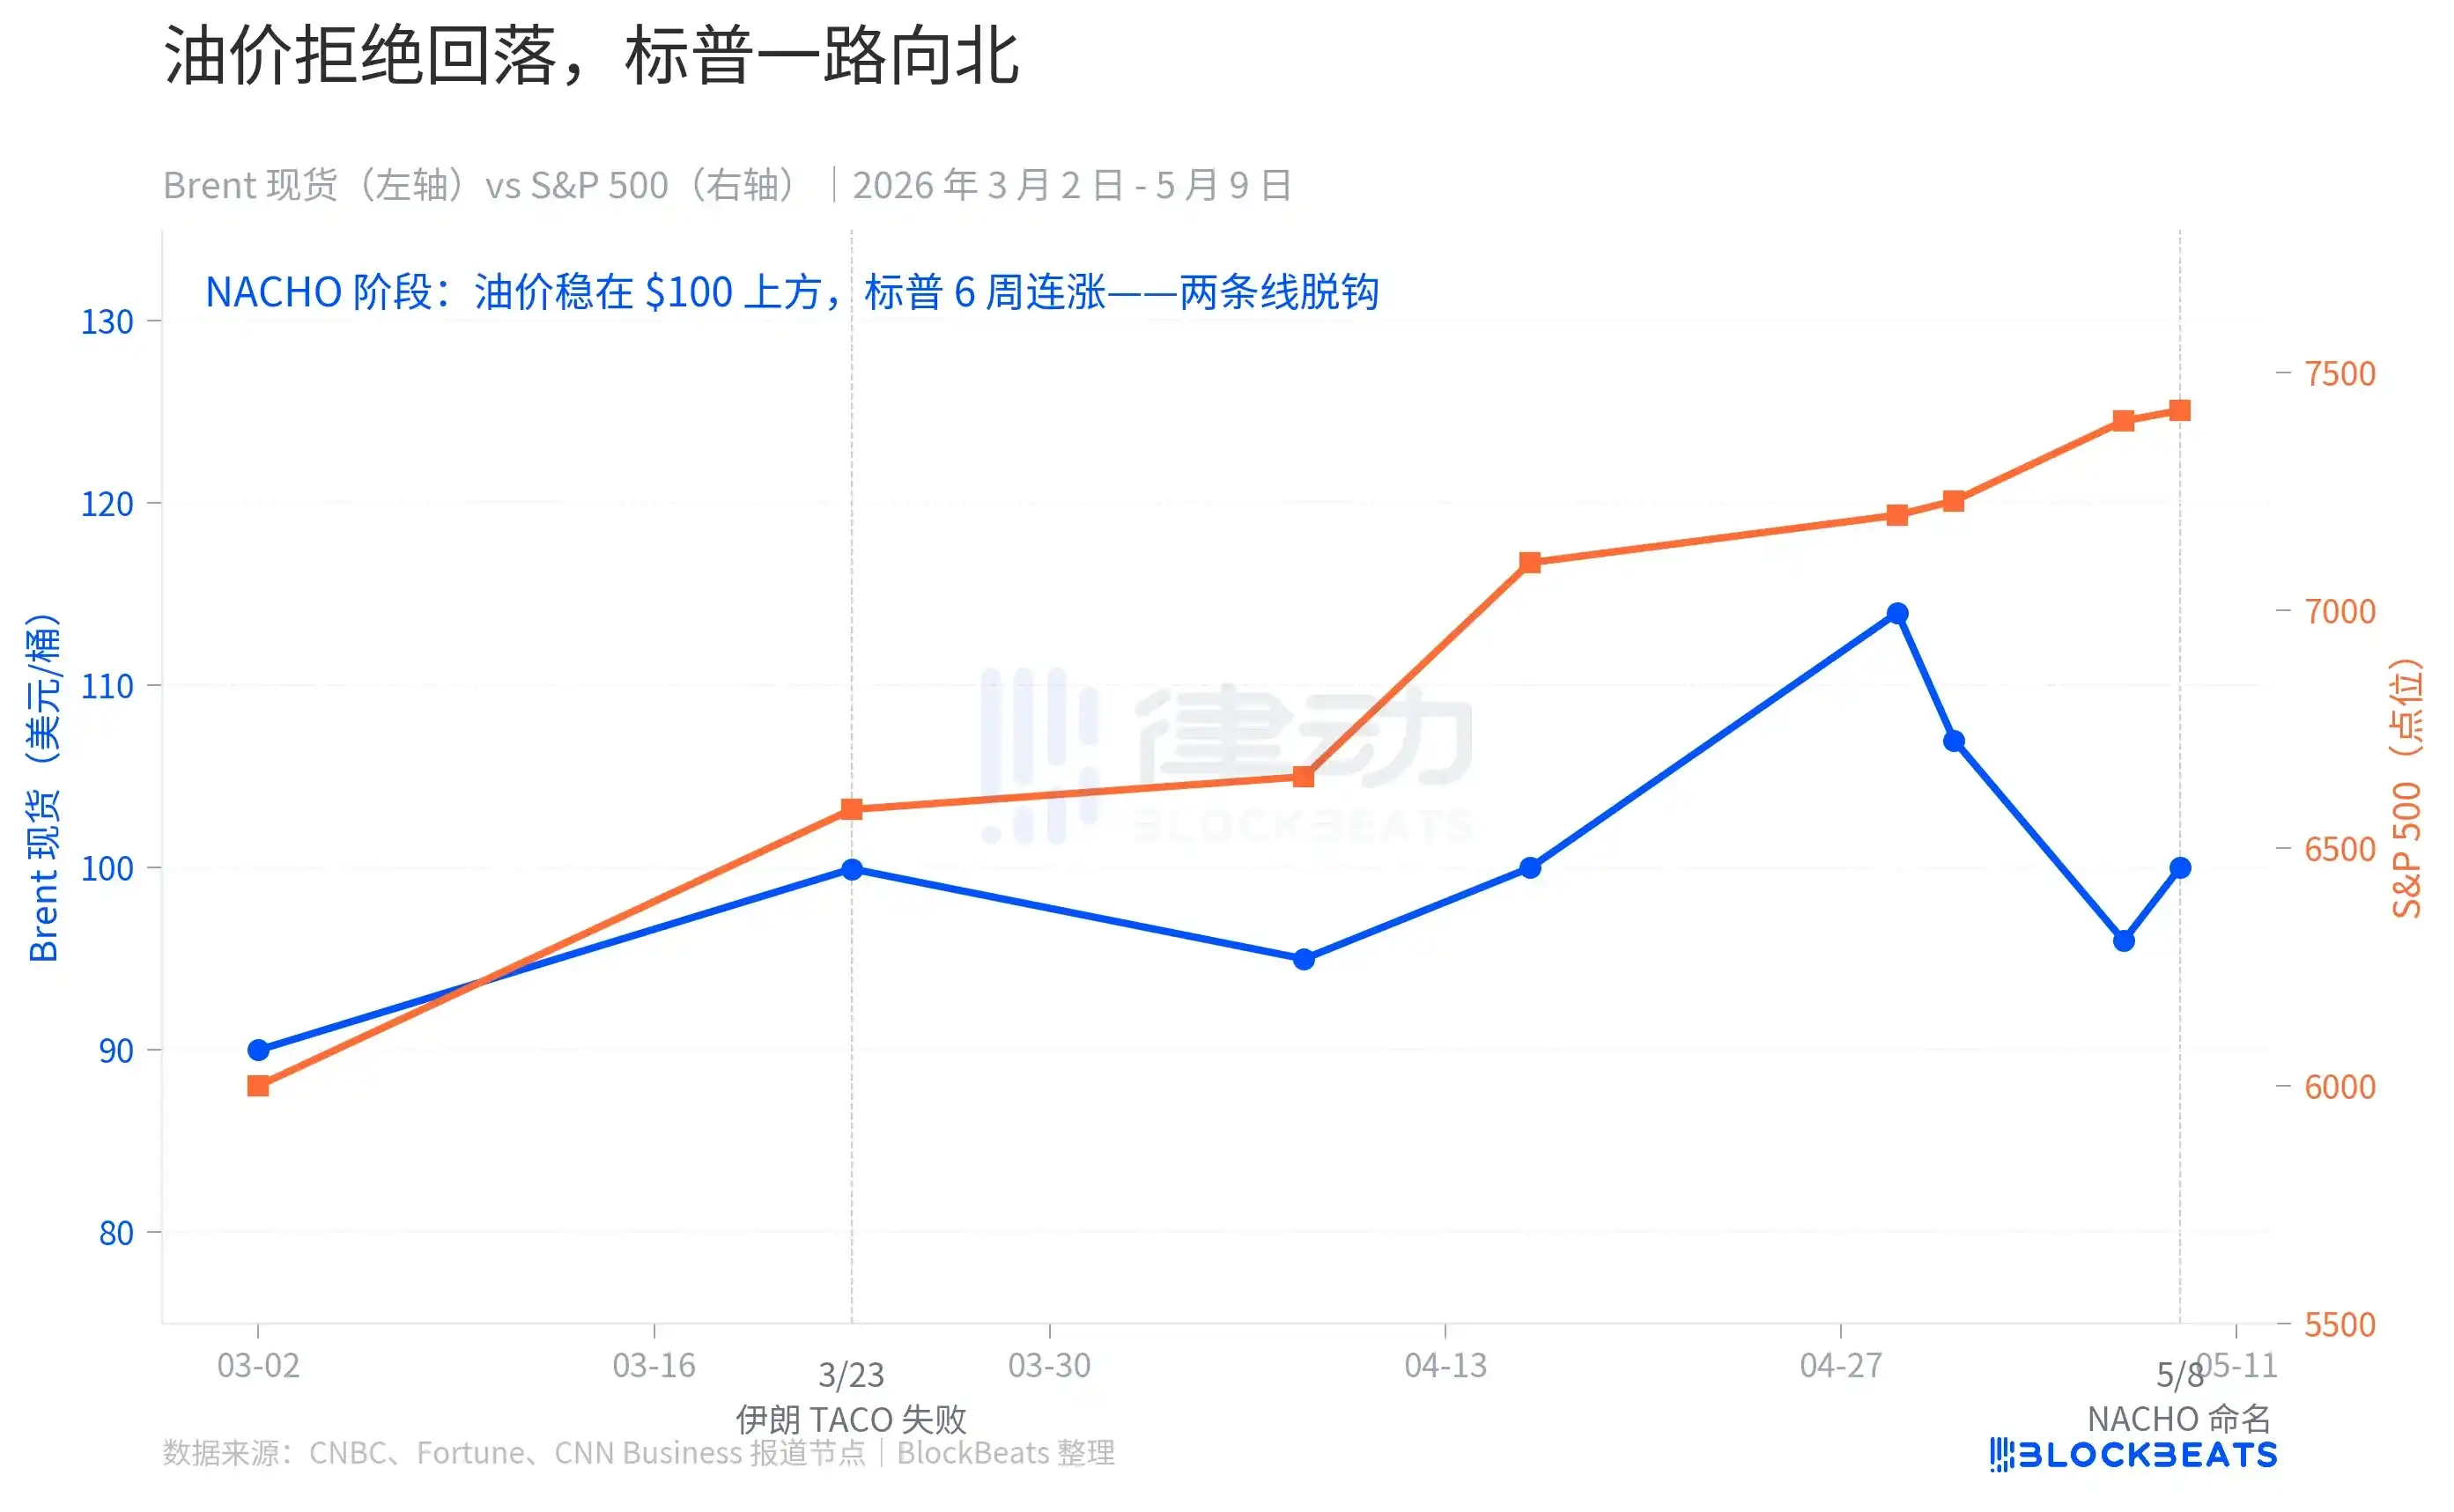
From that day on, market behavior fundamentally changed. Brent crude never fell back to the pre-war level of $67 in the following six weeks, with its May average price still maintained at $109.57. In between, there were U.S.-Iran ceasefire agreements on April 7th and 8th, a brief return of oil prices to ‘initial war levels’ on April 17th, and news on May 7th that the U.S. and Iran were close to a deal. None of these ‘ceasefire headlines’ brought oil prices back to the baseline.

But the S&P headed north. It rose 10% in April alone, its strongest month since November 2020, setting 7 intraday all-time highs during the period. On May 1st, it broke 7,230 points intraday, closing at 7,398 points on May 7th.

The two lines completely decoupled in early April. In the TACO era, they moved together: threats came, oil and the S&P fell; backing down came, oil and the S&P rebounded. In the NACHO era, they speak two different languages: oil prices say ‘Hormuz is shut for good,’ while the S&P says ‘it's none of my business.’

Three Markets, Three Reactions

NACHO is not just talk; it's the same bet placed with real money across three separate derivative markets.

The first layer is insurance. According to historical data from the Strauss Center, war risk insurance rates for the Strait of Hormuz once soared to 3.5% of hull value during the 2003 U.S. invasion of Iraq, reaching 7.5% at the peak of the ‘Tanker War’ in the 1984 Iran-Iraq War after the attack on the Yanbu Pride tanker. The baseline before this crisis was 0.125% to 0.25%. By early May, this rate had entered the 1% range, with some policies surging to 3%–8%.

Converted to the insurance cost for a single Very Large Crude Carrier (VLCC) per transit, the fee has jumped from about $250,000 pre-war to the current $800,000 to $8 million. An insurer's job is to price risk. The practical implication of this layer is: if insurers simply won't provide coverage, shipowners won't risk uninsured transit. The ‘physical reopening’ and ‘de facto navigation’ of the Strait are two different things.

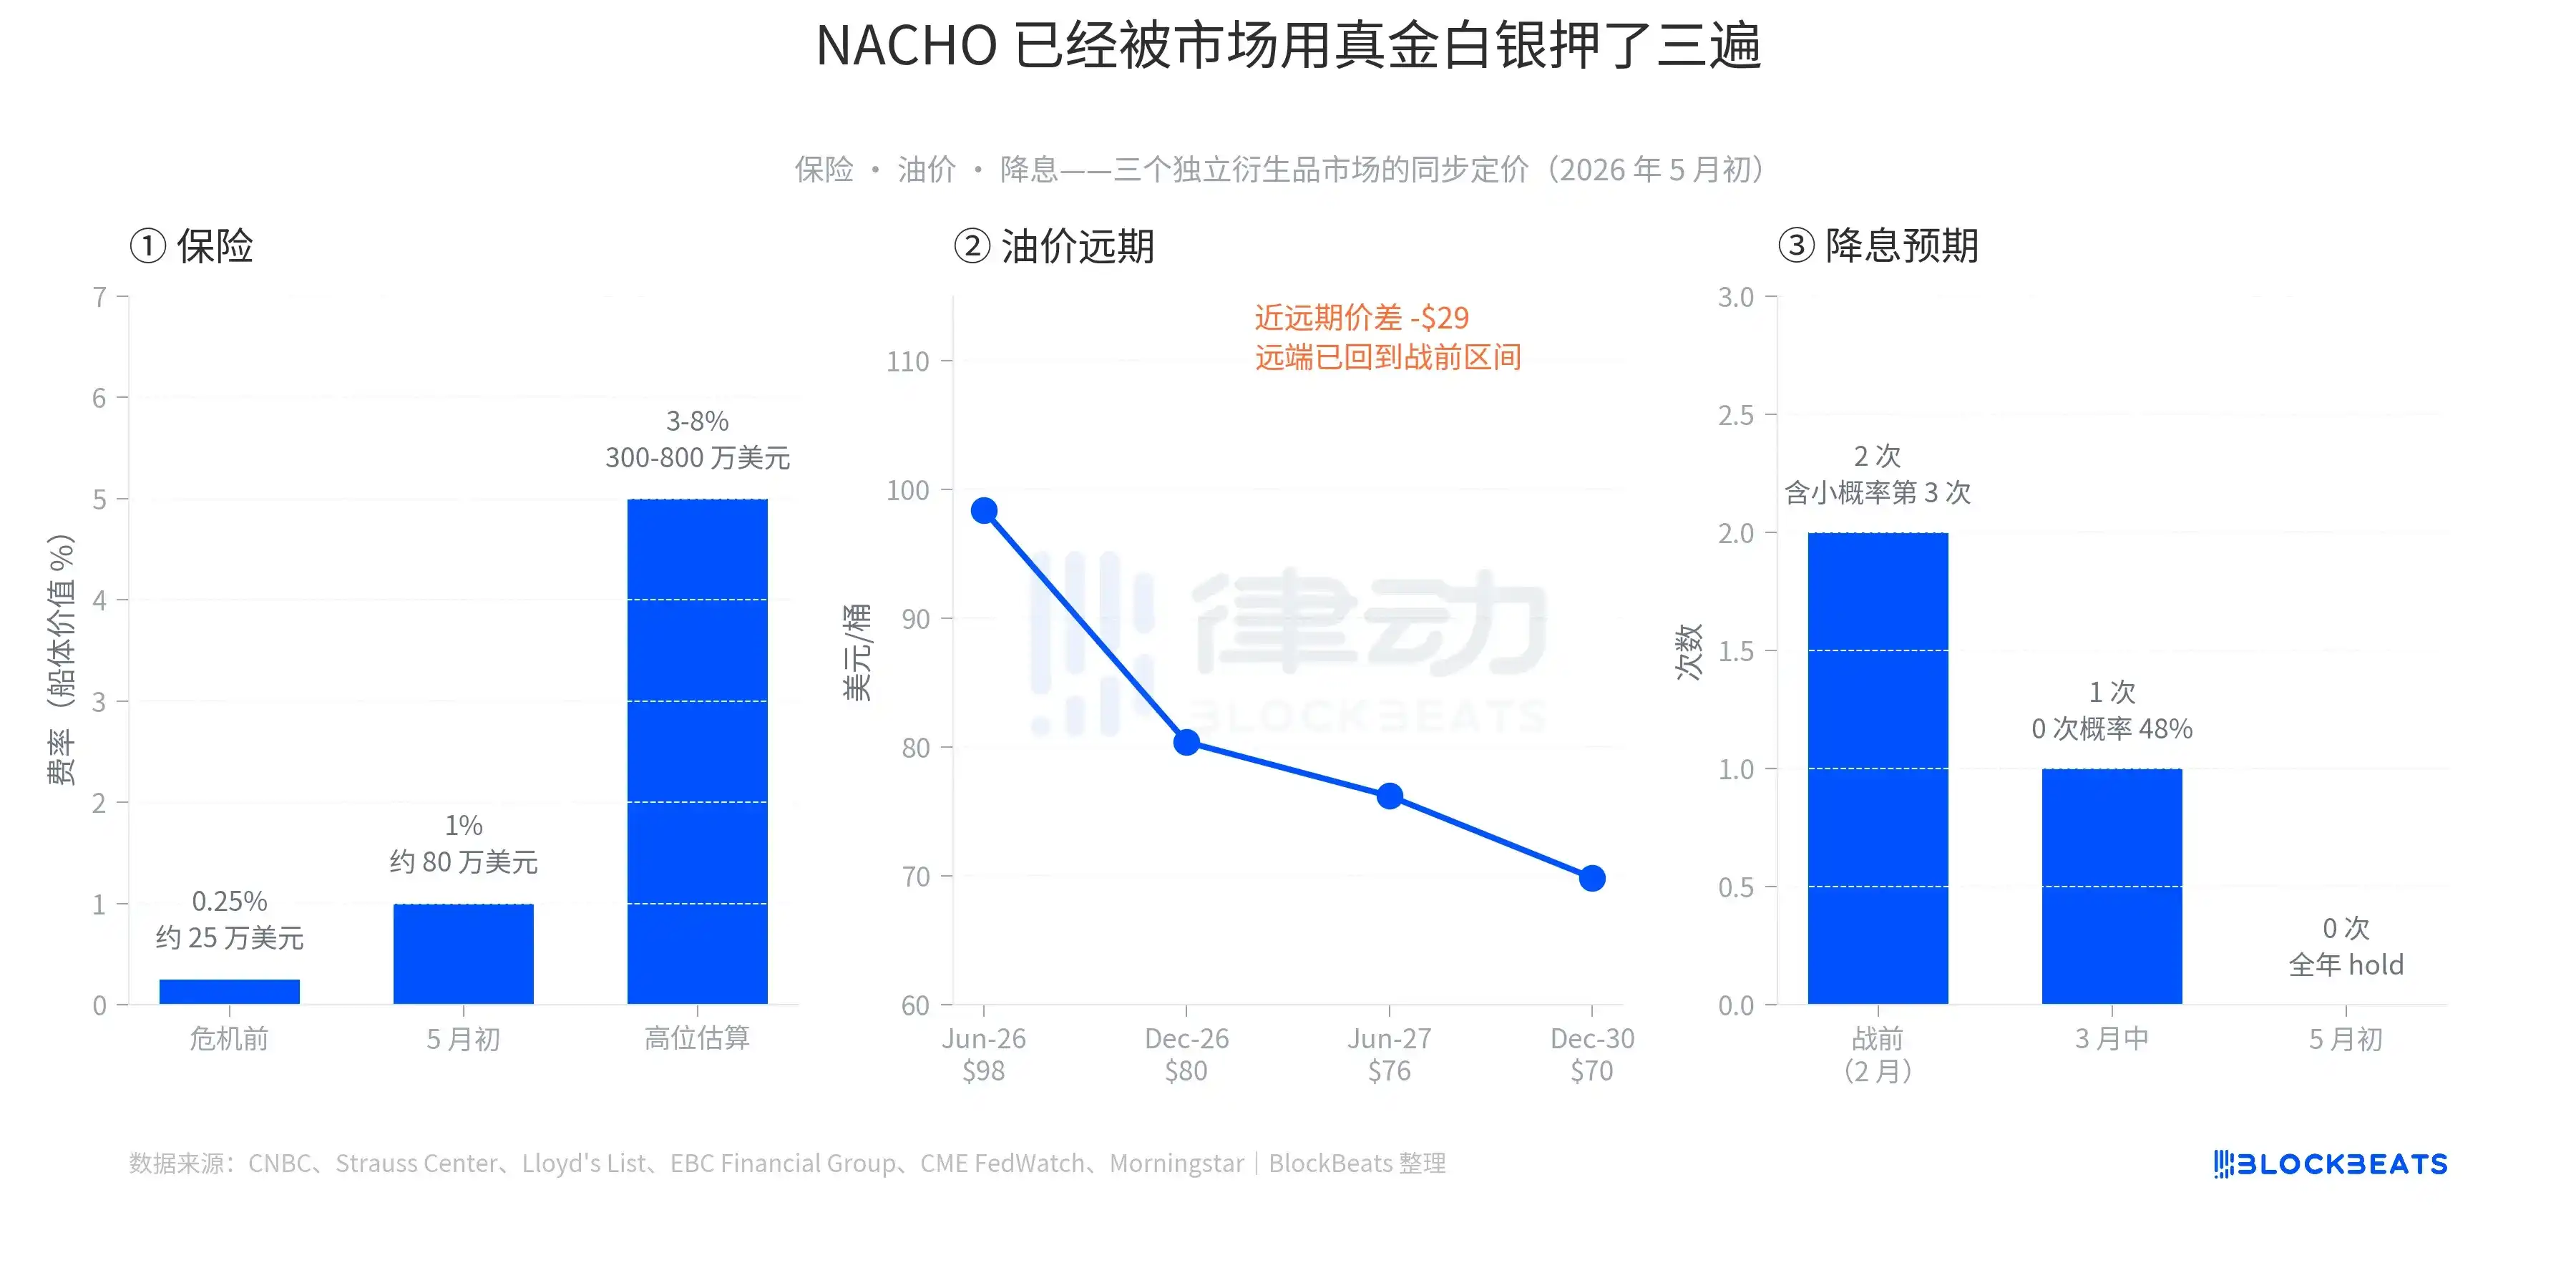
The second layer is oil prices. Early May data shows the Brent Jun-26 contract at $98.41, Dec-26 at $80.39, Jun-27 at $76.20, Dec-30 at $69.85. The spread between the front month and Dec-30 is about $28.5, one of the steepest backwardation (near-term price higher than long-term) structures in the past five years. This curve tells a very specific story: the market believes spot supply is tight but will eventually ease, with long-term prices returning to the pre-war $60–$70 range. In other words, high oil prices are not the final state but a bounded window. However, this window is long enough that traders won't bet on it ending suddenly.

The third layer is rate cuts. In early February 2026, the market expected the Fed to cut rates twice that year, with a small chance of a third cut. By mid-March, as oil prices surged, this was compressed to 1 cut, with a 48% probability of 0 cuts. On April 29th, the Fed held rates at 3.50%–3.75%. By May 6th, the CME FedWatch tool showed a 70% probability of another hold at the June meeting. For the entirety of 2026, the market had already priced in 0 rate cuts. Hedge fund legend Paul Tudor Jones even said in a May 7th CNBC interview, ‘Not even Volcker could get the Fed to cut rates now.’

All three layers have left their mark in the derivative markets—it's not just narrative; it's real money.

A Differentiated Market

The second, less obvious detail of NACHO is that it has already created differentiated pricing within the broader market.

As of the May 7th close, the Energy Sector ETF (XLE, State Street's Energy Select Sector Fund) was up 31.63% year-to-date, the only major sector in positive territory for 2026. Over the same period, the S&P 500 rose about 24%. The Transportation Sector ETF (IYT, iShares U.S. Transportation ETF) gained only 8.79% year-to-date, underperforming the broader market by over 15 percentage points.

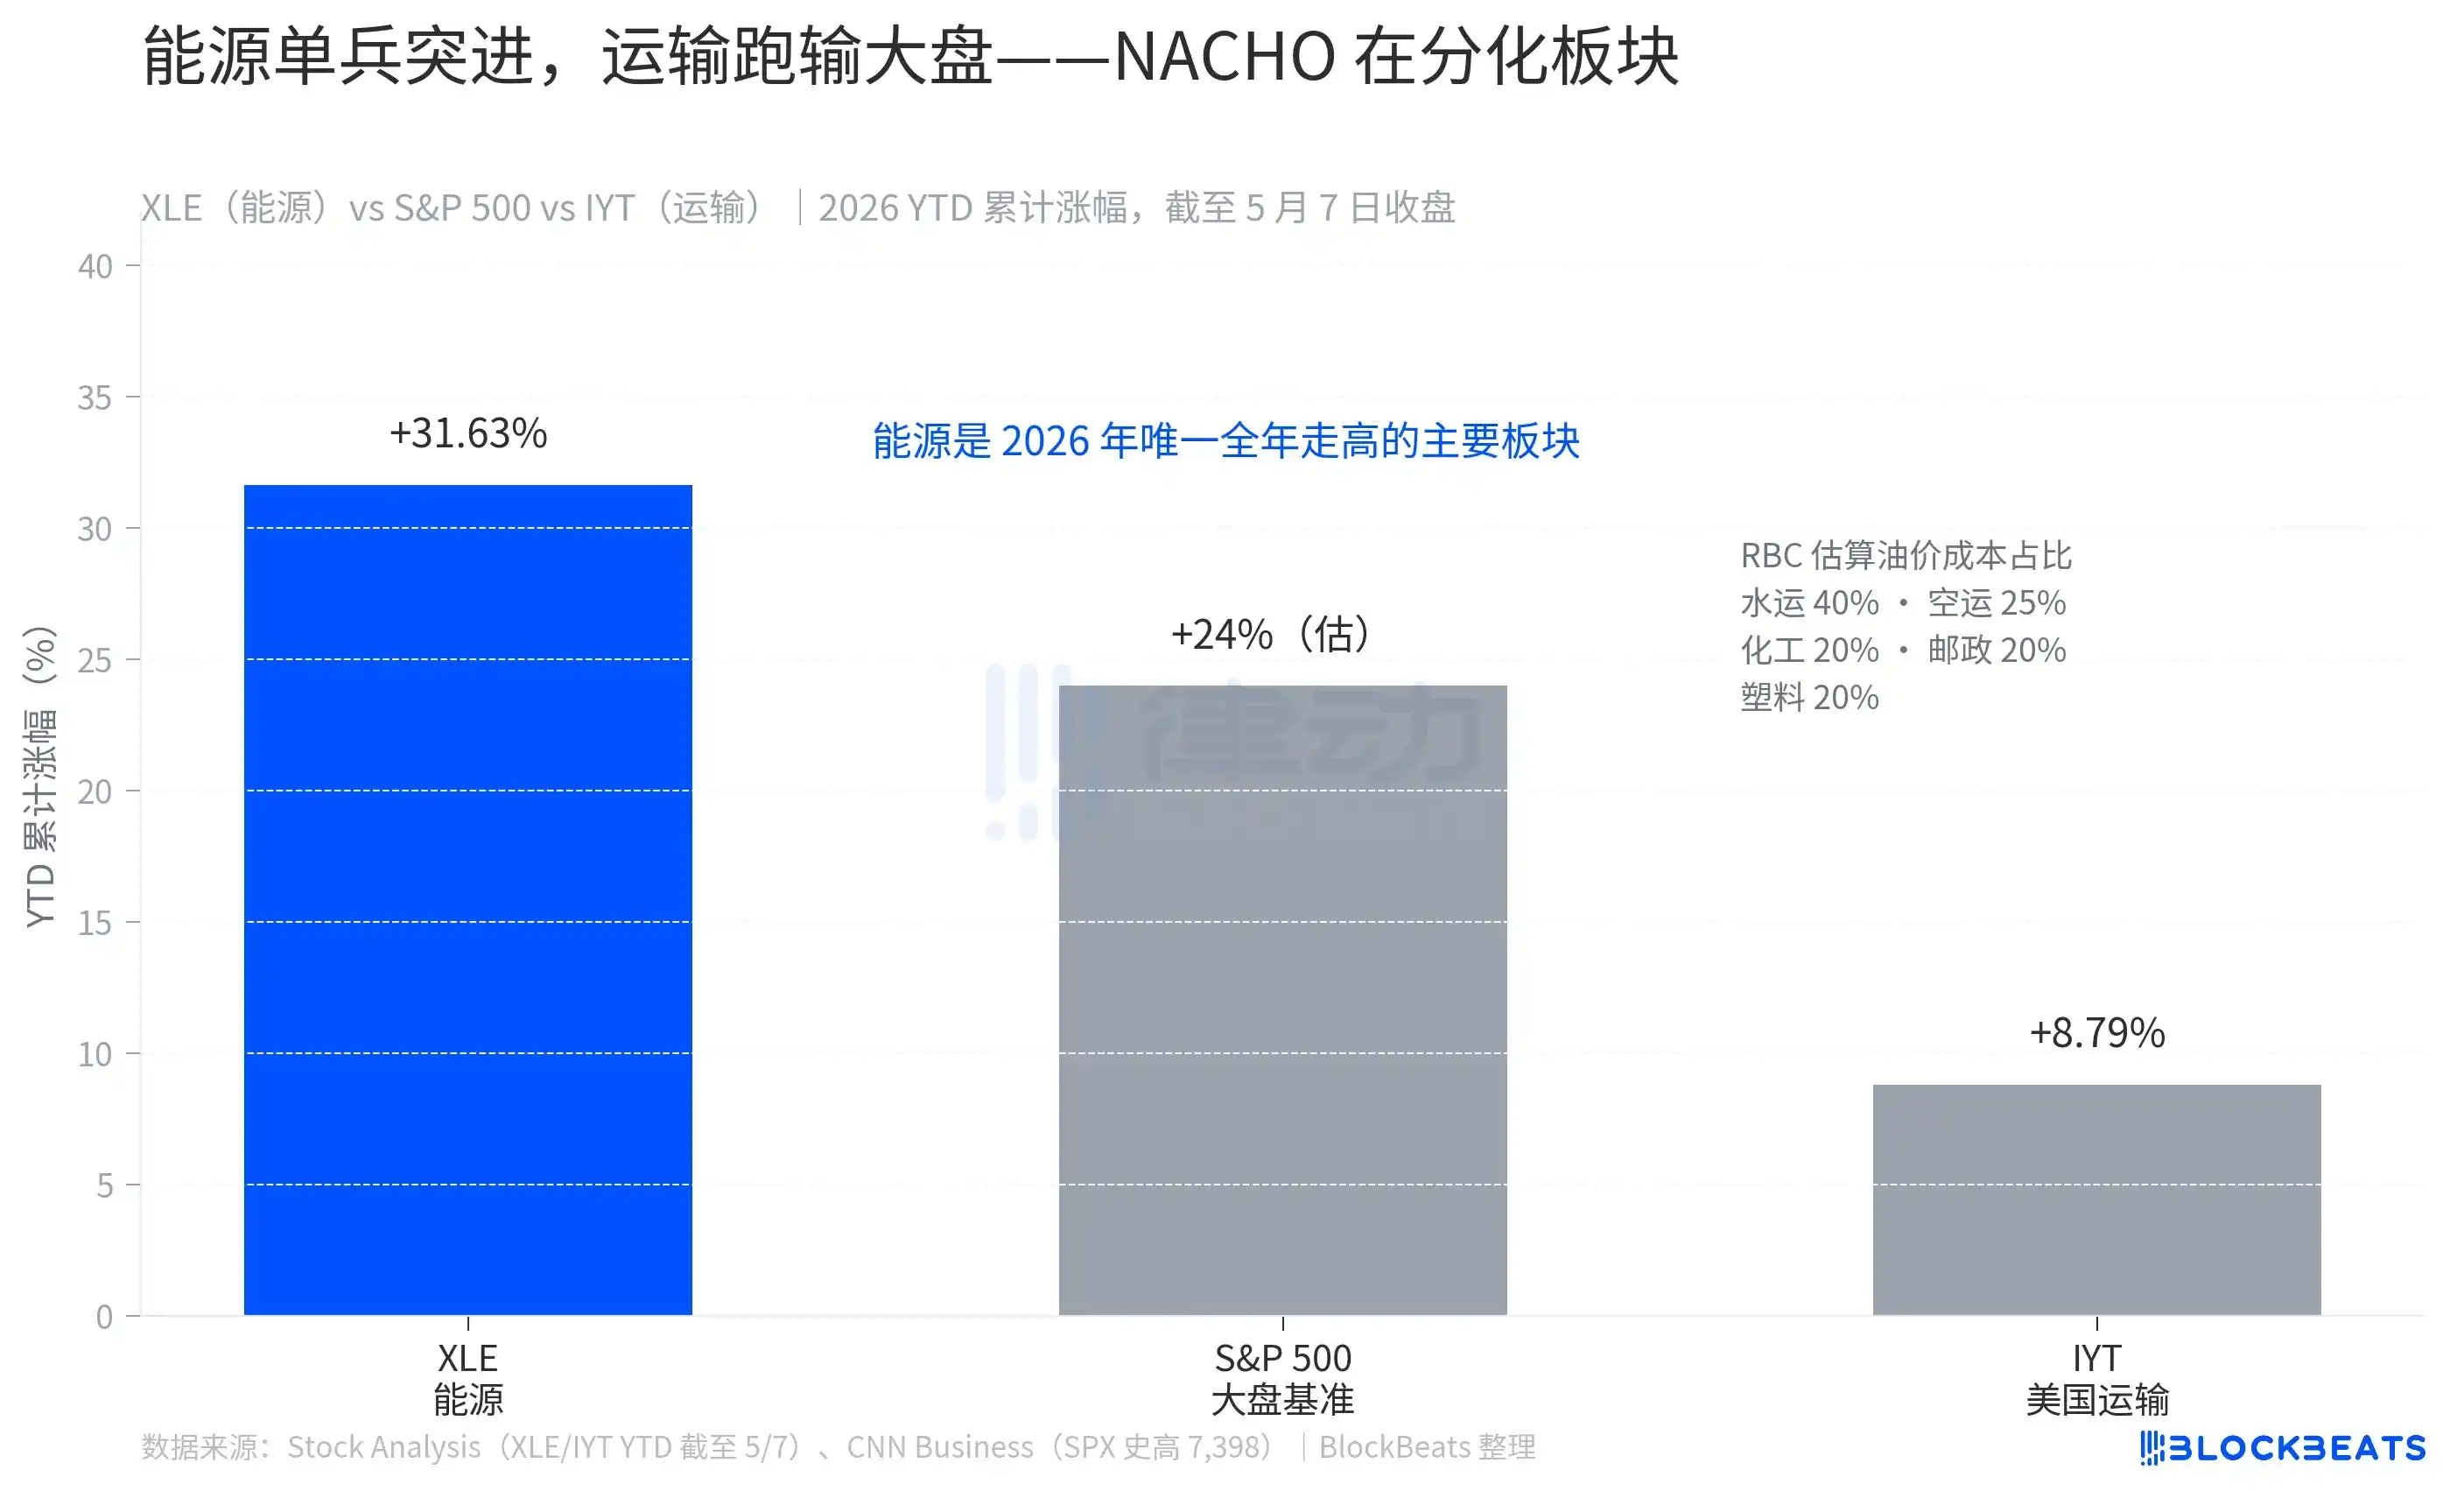
This gap is not random. According to RBC Capital Markets estimates, fuel costs constitute 40% of operating costs for the water transport industry, 25% for air transport, and 20% each for chemicals, postal/courier services, and rubber/plastics. If fuel is a major item on your cost sheet, NACHO hits you directly in the face.

XLE's 31.63% gain is not a short-term bounce; it's the result of 8 weeks of sustained outperformance. IYT's 8.79% gain isn't weakness; it's rising with the broader market while having its returns split by oil prices. The market has clearly told readers how NACHO calculates the odds—just look at how much the transportation ETF is underperforming the market.

But NACHO is not an indefinite bet; it has a very specific deadline: June 1st.

According to estimates from JPMorgan's commodity research team, global commercial crude oil inventories were around 8.4 billion barrels at the beginning of 2026, but only about 800 million barrels of that was ‘practically usable.’ The rest consisted of pipeline fill, tank bottom inventories, minimum terminal storage—the parts necessary to keep the system running daily. Since the crisis began, 280 million barrels have been drawn down, leaving roughly 520 million barrels of usable inventory. JPMorgan's exact words were, ‘Commercial inventories are expected to approach operational stress levels by early June.’

‘Operational stress level’ is a concrete physical concept. JPMorgan explains, ‘The system doesn't collapse because oil disappears; it collapses because the flow network no longer has sufficient working inventory.’ Once this line is breached, the only choices for companies and governments are to either squeeze the minimum inventory needed to maintain operations (which damages the infrastructure itself) or wait for new supply. If Hormuz remains closed until September, OECD commercial inventories could fall to the so-called ‘operational floor.’ According to a Fortune report, European jet fuel inventories are projected to fall below the 23-day supply threshold in June—a key industry warning line.

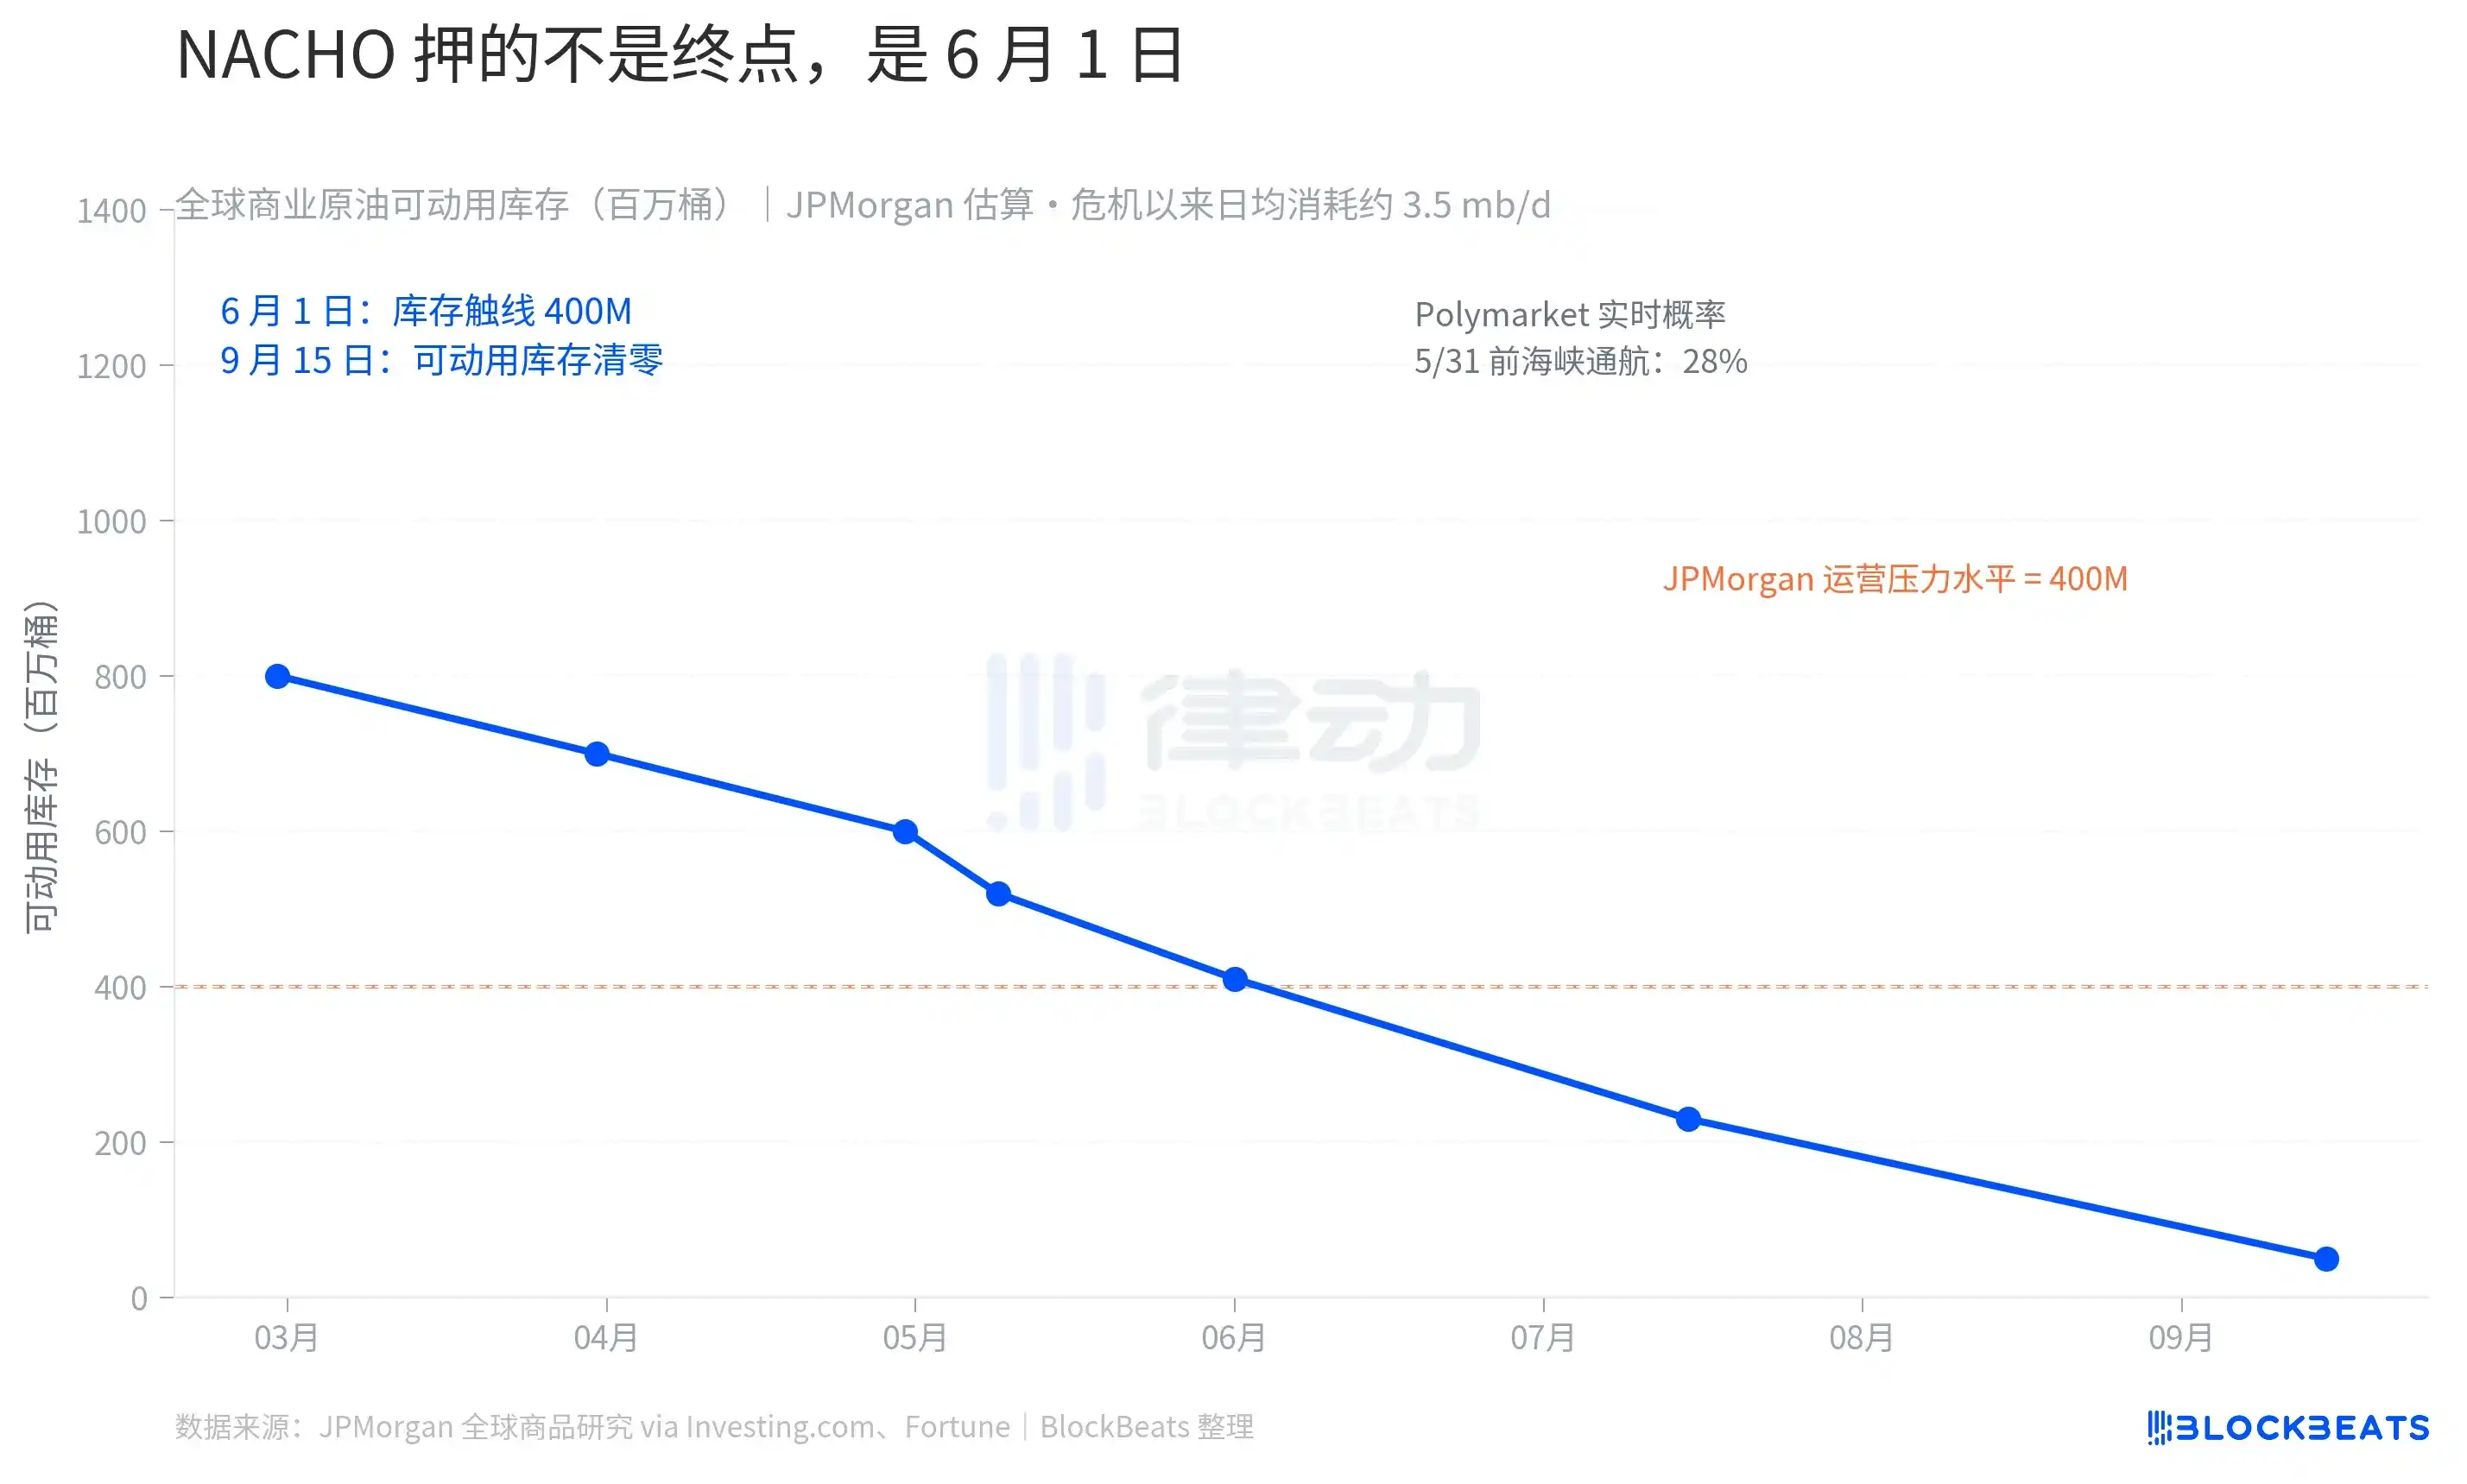
Prediction market odds are synchronized with the physical clock. According to Polymarket data from May 9th, the probability of ‘the Strait of Hormuz resuming normal traffic before May 31st’ is 28%, with only a 2% probability before May 15th. Active positions worth $9.92 million on that market are betting that NACHO won't fail at least within May.

The market is no longer trading Trump's next Truth Social post; it's trading the early-June inventory data for the Strait of Hormuz.

Domande pertinenti

QWhat does the acronym NACHO stand for, and what market view does it represent?

ANACHO stands for 'Not A Chance Hormuz Opens'. It represents a market view that the situation in the Strait of Hormuz is a prolonged, intractable crisis ('things will get stuck'), and the strait has no chance of reopening anytime soon, as opposed to betting on a political de-escalation.

QWhat event marked the failure of the TACO trading narrative and the shift towards NACHO?

AThe turning point was on March 23. Trump announced on Truth Social a 'very good constructive dialogue' with Iran and ordered a 5-day pause on strikes. The market initially rallied (TACO style), but when Iran officially denied any dialogue occurred, the gains were halved. This was the first time in 14 months that Trump 'backing down' failed to sustainably move the market, proving that a one-sided retreat was ineffective when the opponent doesn't cooperate.

QHow has the NACHO view manifested in the oil futures market structure?

AThe NACHO view is reflected in a steeply inverted (backwardated) oil futures curve. For example, near-month contracts (Jun-26) trade around $98, while Dec-30 contracts trade around $70. This large ~$28 spread signals the market believes current supply is tight and will remain so for a significant window, but the high prices are not permanent, and the situation is expected to eventually normalize in the long term.

QWhat is the significance of the performance gap between the Energy (XLE) and Transportation (IYT) sector ETFs in the context of NACHO?

AThe performance gap (XLE up ~31% vs. IYT up only ~8.8%) demonstrates the market's differentiated pricing under NACHO. High oil prices directly benefit energy producers (XLE) but act as a major cost headwind for transportation and other fuel-intensive industries (IYT). This divergence shows the market is not just betting on a general crisis, but is precisely calculating which sectors win and lose from sustained high oil prices.

QWhat is the key physical/economic deadline mentioned in the article that gives the NACHO trade a specific timeframe?

AThe key deadline is around June 1st. According to JPMorgan estimates, global commercial crude inventories are projected to approach 'operational pressure levels' by early June. Once this critical line is crossed, the physical oil distribution network risks seizing up. Markets are thus betting the NACHO situation (strait closure) will hold at least until this inventory buffer is nearly exhausted, shifting focus from political headlines to hard inventory data.

Letture associate

When AI Traffic Surpasses Humans, How Do You Prove You're Human?

As AI-generated web traffic now surpasses human activity, the internet's foundational business models—built on human attention, browsing, and advertising—face severe disruption. AI agents crawl websites at immense scale without generating ad revenue, while AI summaries divert traffic from original content sites. In response, over 2.5 million sites are blocking AI crawlers, and protections like Cloudflare's "honeypot" traps have emerged, though advanced AI can bypass these. The collapse of traditional CAPTCHAs, which assumed machines were weaker than humans, has led to a shift toward behavioral biometrics for human verification. Companies like IBM and BioCatch now analyze unique human patterns—cursor movements, typing rhythms, keystroke dynamics, and even cognitive delays like the Stroop effect—to distinguish real users from bots. These biometric signatures are difficult to fake or alter, offering a new layer of security but raising significant privacy concerns. Two competing visions for a reliable human verification system are emerging. One, exemplified by Sam Altman’s World (formerly Worldcoin), uses centralized iris scanning to generate unique credentials, though it faces bans and criticism over unauthorized data collection. The other employs cryptographic zero-knowledge proofs, allowing users to prove they are human without revealing identity or biometric data, as advocated by Vitalik Buterin. However, decentralized approaches risk exploitation through identity renting in economically unequal regions. The central dilemma is between a scalable but privacy-invasive centralized system that permanently controls users' biometric data, and a privacy-preserving cryptographic system vulnerable to real-world economic manipulation. The author expresses a preference for the cryptographic path, arguing that despite its flaws, it avoids the irreversible biometric surveillance inherent in centralized alternatives.

Foresight News2 min fa

When AI Traffic Surpasses Humans, How Do You Prove You're Human?

Foresight News2 min fa

Crypto Primary Market Investment and Financing Forward-Looking Weekly Report | Stablecoin Regulation Nears Implementation, ETF Funds Continue to Withdraw, Capital Begins Betting on Payment and Cash Flow

Crypto Market Weekly Report (Jun 1-7, 2026): Capital Shifts Focus to Payments & Cash Flow Market data indicates a significant divergence: while traditional institutional funds continue exiting via BTC and ETH ETFs (recording net outflows of $1.72B and $168M this week, respectively), stablecoin supply continues growing. This suggests capital is shifting from speculative asset allocation toward defensive positioning within on-chain liquidity, awaiting new, concrete opportunities. This trend is reflected in venture capital focus. Weekly fundraising fell 27% to $302M, with investments concentrating on infrastructure with tangible revenue potential: 1. **Stablecoin Infrastructure (28% of funding):** Projects like M0 Protocol ($35M raise) are gaining attention as regulatory clarity (e.g., the GENIUS Act) nears, shifting the focus from legitimacy to building payment and settlement networks. 2. **AI Agent Infrastructure (26%):** Investments are moving from conceptual AI Agents towards the execution and economic layers required for a functional "Agent economy." Key raises include OpenRouter ($40M) and Halliday ($20M). 3. **Real World Assets (RWA) (18%):** The search for on-chain yield and cash flow drives continued interest in RWA platforms like Ondo Finance. Security threats are evolving from smart contract exploits toward key management failures, permission control issues, and regulatory execution risks (e.g., court-ordered asset freezes). **Key Takeaways:** The investment thesis is shifting from narrative-driven bets to revenue and cash-flow-generating protocols. Future attention should be on the progression of stablecoin regulations, the commercial validation of AI Agent economies, and the performance of high-revenue protocols like derivatives platforms.

marsbit9 min fa

Crypto Primary Market Investment and Financing Forward-Looking Weekly Report | Stablecoin Regulation Nears Implementation, ETF Funds Continue to Withdraw, Capital Begins Betting on Payment and Cash Flow

marsbit9 min fa

Buy an NFT First to Get a Ticket? The Largest World Cup Ticket Slump in History

"Ticketing Woes for 2026 World Cup: NFT 'Right-to-Buy' and High Prices Dampen Sales" Despite anticipation for the 2026 FIFA World Cup, with 48 teams and 104 matches across North America, the tournament faces significant unsold tickets, with approximately 180,000 group-stage tickets still available for resale just before kick-off. This unexpected shortfall is attributed to FIFA's controversial new ticketing strategy, which includes an NFT-based "Right-to-Buy" (RTB) system and opaque, dynamic pricing. FIFA introduced RTBs as digital collectibles (NFTs) sold on its FIFA Collect platform. An RTB grants the holder only the right to purchase a ticket for a specific match later, not the ticket itself. This two-step process, criticized for selling "scarcity" first, saw RTBs priced from tens to hundreds of dollars, generating millions in revenue for FIFA. With many tickets remaining available on official channels, the value of these prepaid purchase rights is now being questioned. Compounding the issue are ticket prices, reported to be 2 to 4 times higher than the 2022 Qatar World Cup, and up to 7 times more for marquee matches. FIFA employed dynamic pricing, common in U.S. sports, but lacked transparency on seat availability and exact locations during sales, frustrating global fans facing high travel costs. This has drawn scrutiny from regulators in New York and New Jersey. FIFA's official resale platform also drew criticism for imposing high fees—roughly 10% on sellers and 17% on buyers, allowing FIFA to profit further from secondary market transactions. While FIFA President Gianni Infantino states over 6 million tickets have been sold, the situation highlights a potential disconnect between fan enthusiasm and willingness to pay under an aggressive commercial model.

marsbit17 min fa

Buy an NFT First to Get a Ticket? The Largest World Cup Ticket Slump in History

marsbit17 min fa

Trading

Spot
Futures
活动图片