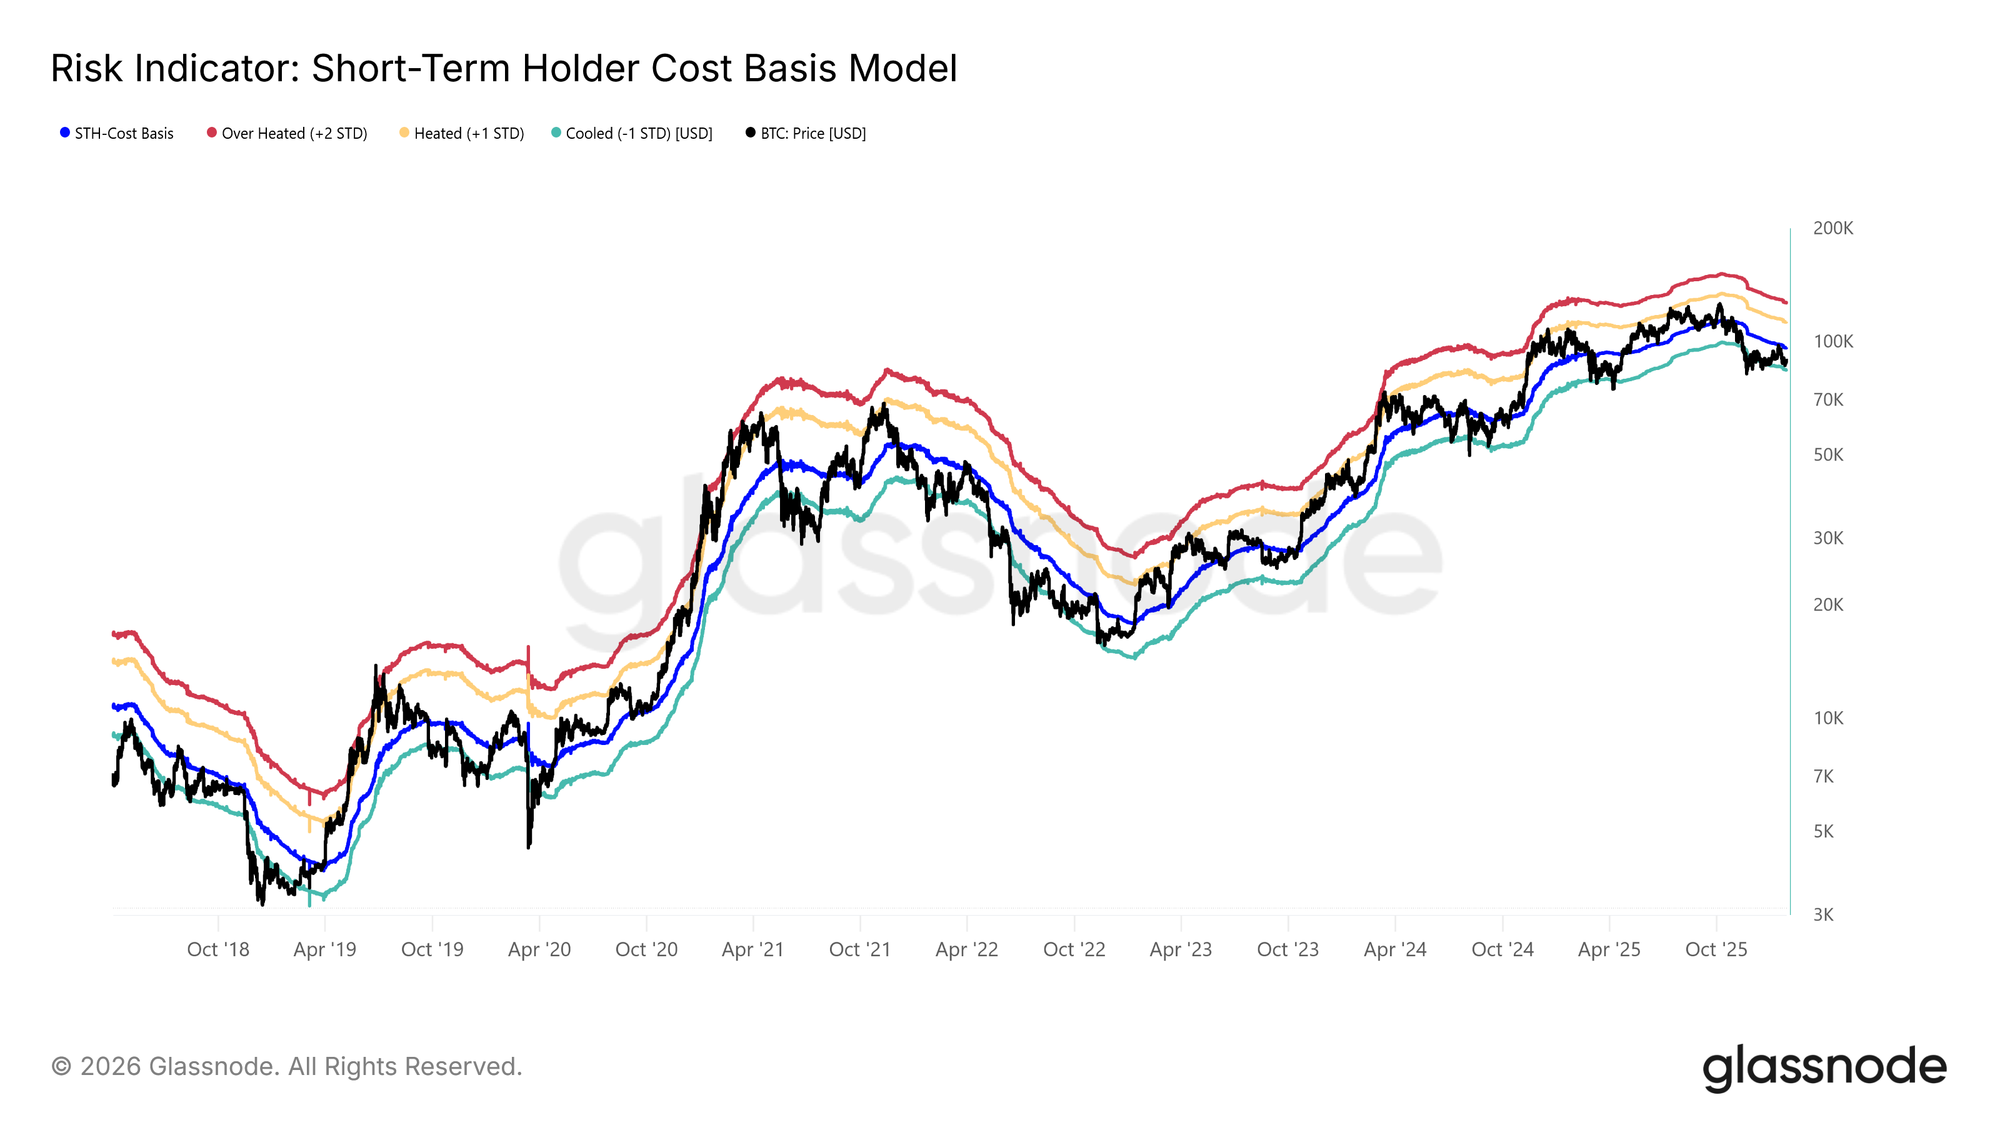
Following the spot price’s failure to sustain its advance toward the Short-Term Holder Cost Basis, the market has slipped back into a shallow pullback.
Trading below this key bull–bear threshold, now at $96.5k, once again closely resembles the market structures observed in Q1 2022 and Q2 2018.
As shown in the chart below, the lower bound of the compressing range (−1 standard deviation) currently sits at $83.4k. This level represents a critical near-term support, and a failure to hold could open the door for a deeper correction toward the True Market Mean at $80.7k.
Sensitivity Near Support
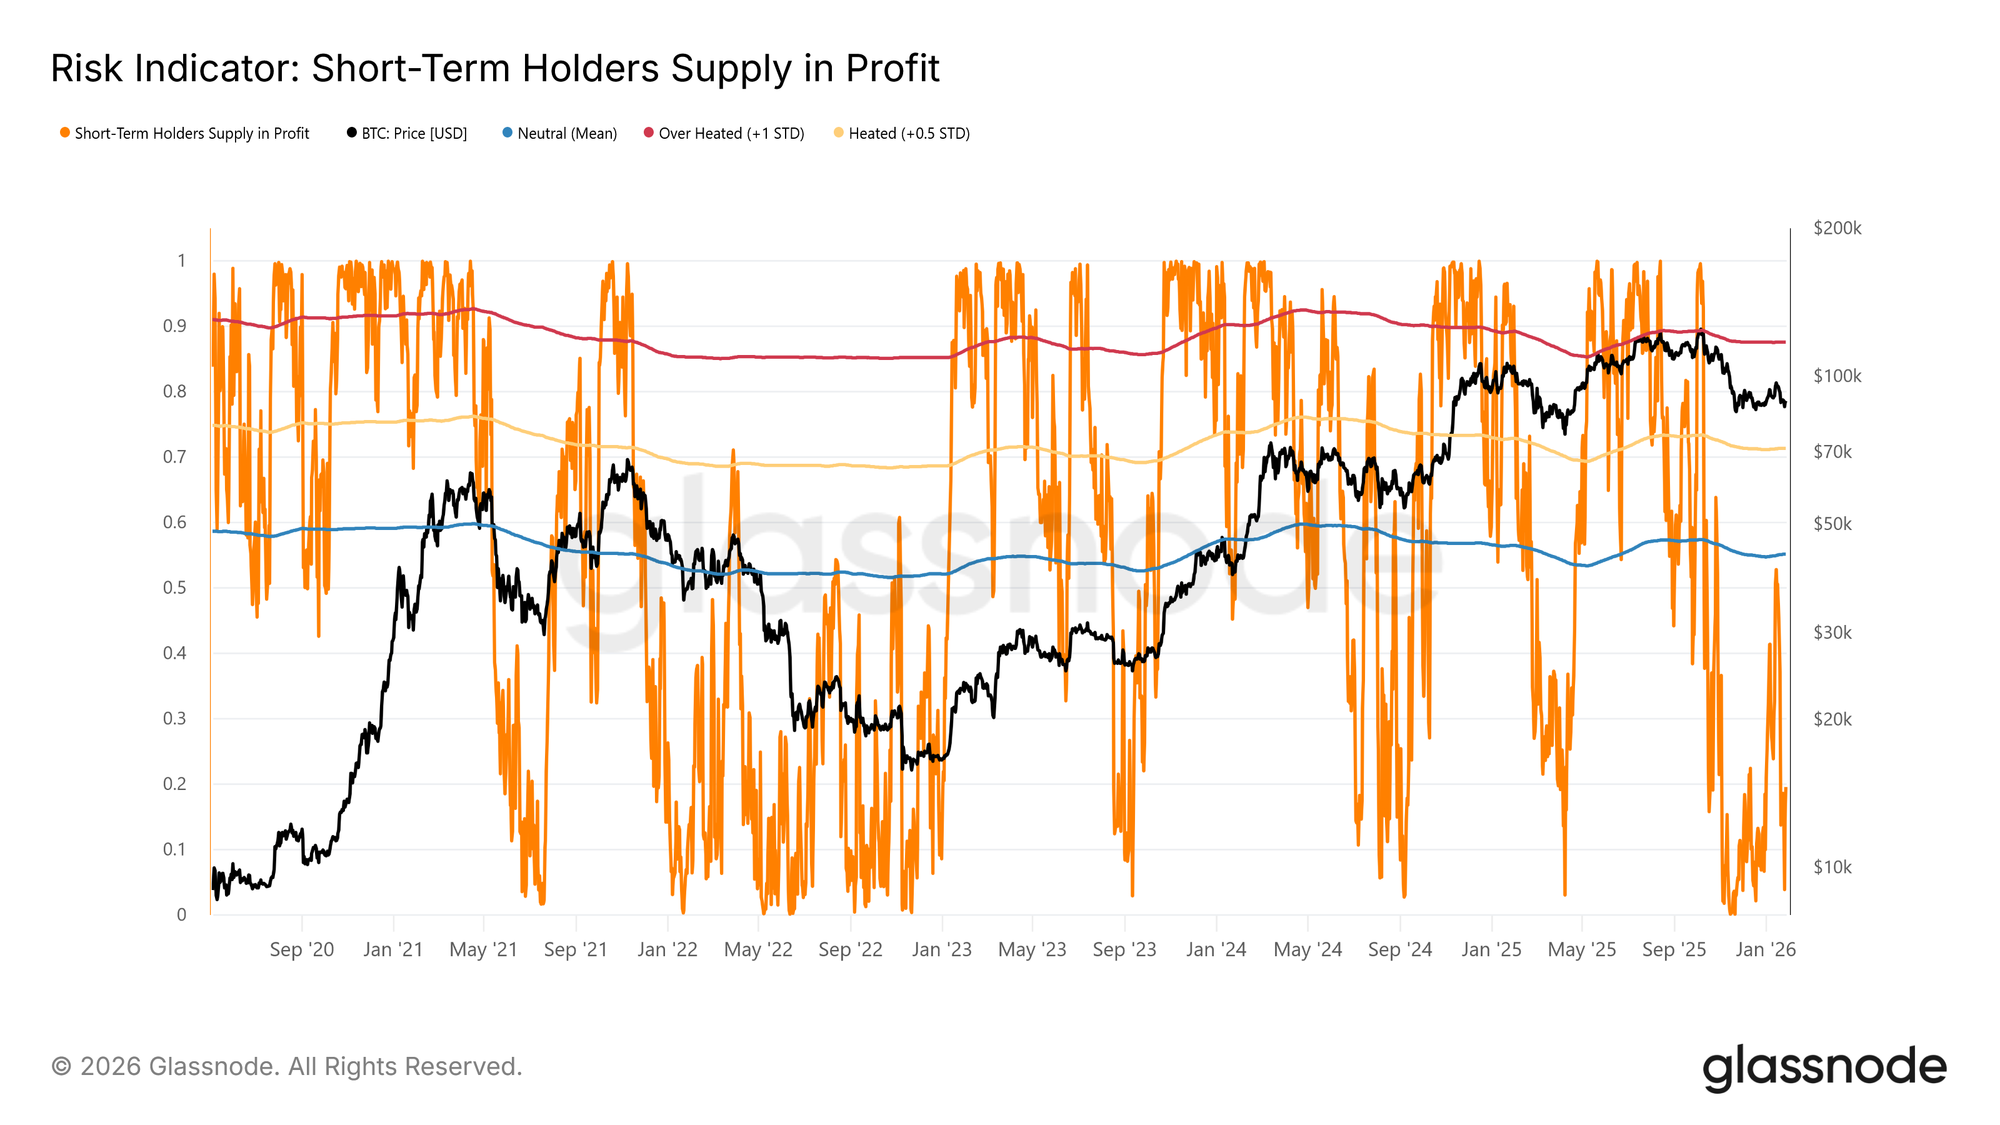
The sensitivity of the market to the highlighted lower band of the Short-Term Holder Cost Basis model and the True Market Mean stems from the substantial share of recently acquired supply now held at a loss. Under such conditions, the short-term holder cohort, which has historically shown high price sensitivity, is more prone to capitulate at a loss, adding incremental pressure to the sell side.
As a result, these price levels represent a last line of defence before the market risks transitioning into a deeper bearish regime, similar to the 2022–2023 bear market.
Currently, the percentage of Short-Term Holder supply held at a loss has fallen to 19.5%, remaining well below the neutral threshold of 55%. This suggests that while downside sensitivity persists, widespread short-term holder capitulation has not yet materialized.
Liquidity Holds the Key
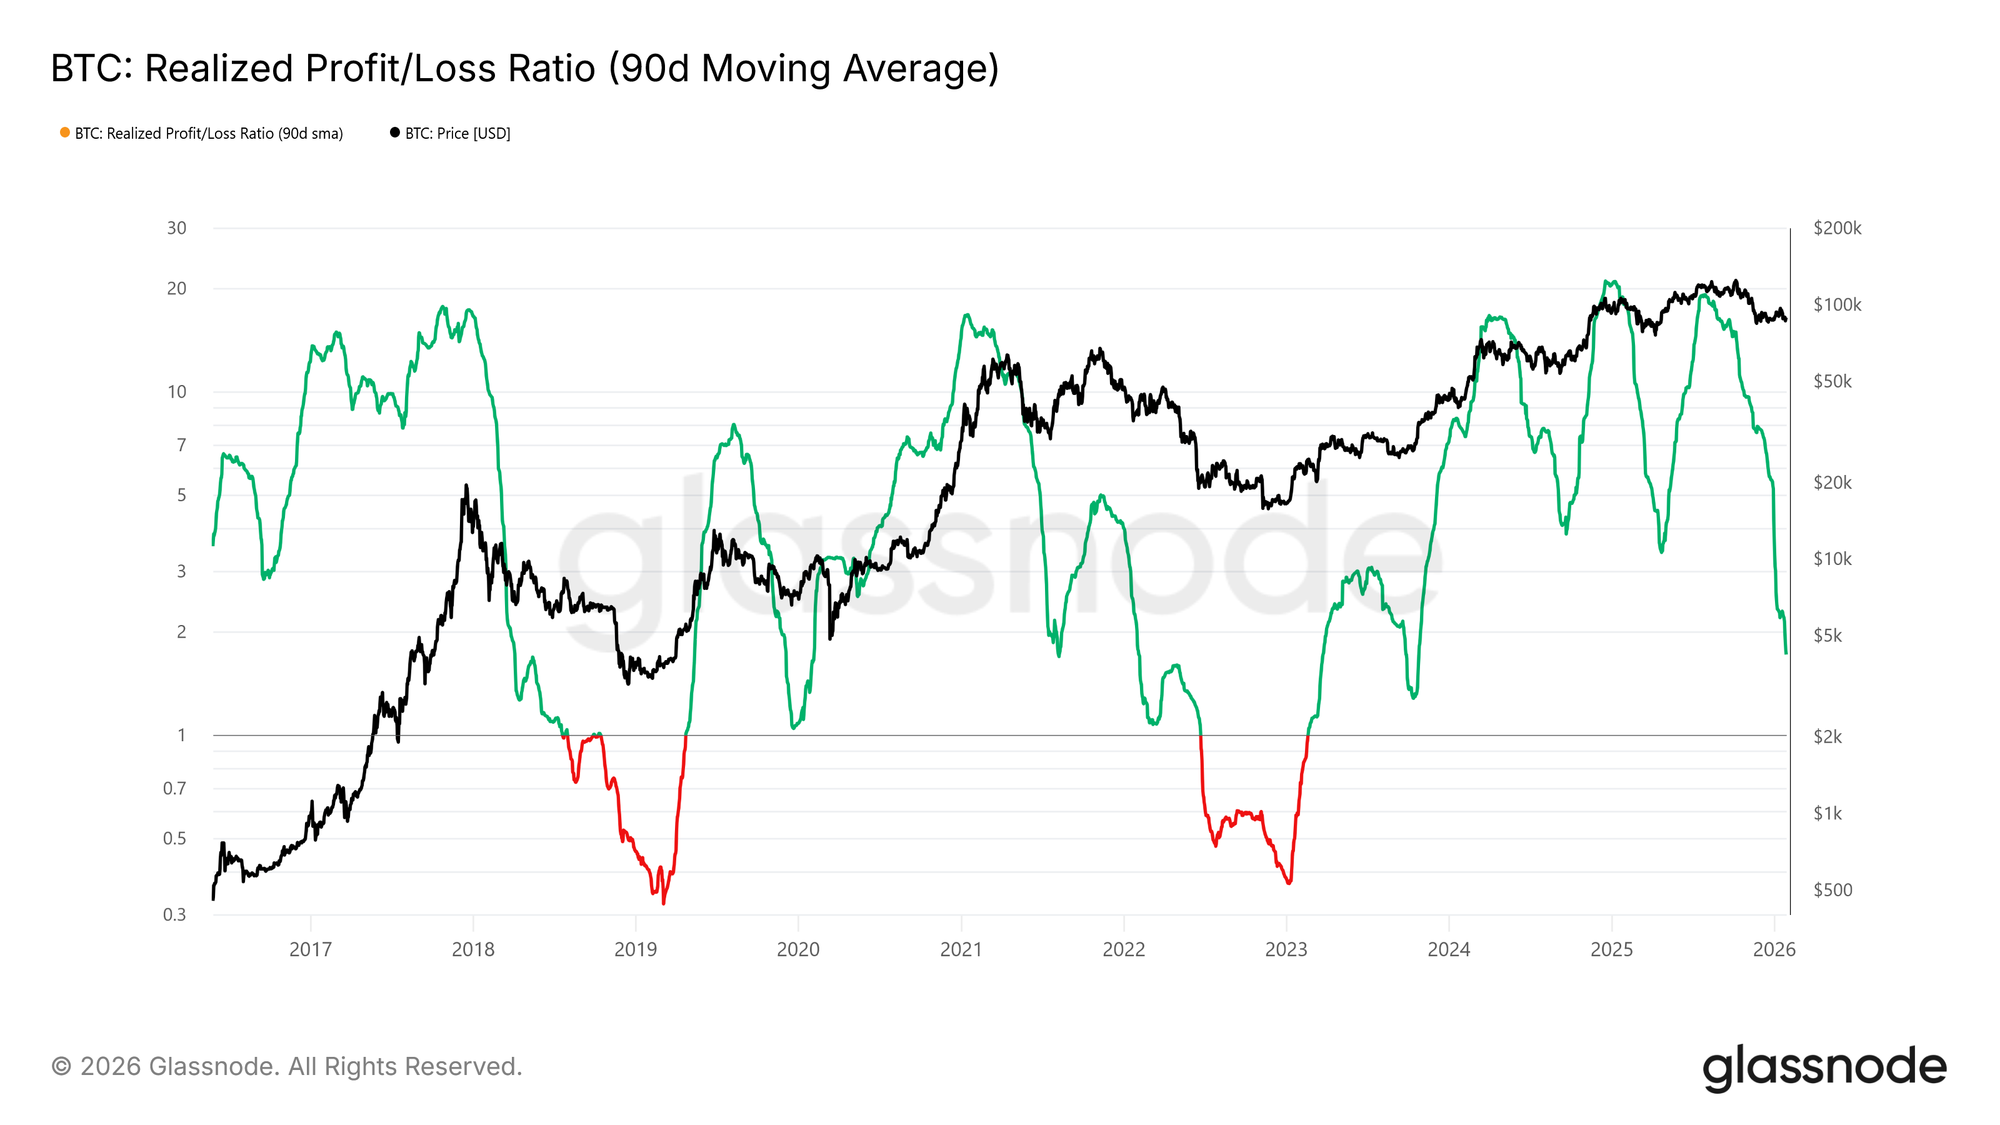
Given the importance of holding the stressed support range between $80.7k and $83.4k, attention now shifts squarely to liquidity conditions. Any meaningful transition back toward a sustained rally should objectively be reflected in liquidity-sensitive indicators such as the Realized Profit/Loss Ratio (90D-SMA).
Historically, transitions into strong upside phases, including mid-cycle recoveries over the past two years, have required this metric to rise and hold above roughly 5. Such a move would signal a renewed influx of liquidity and capital rotation back into the market.
Supply Under Pressure
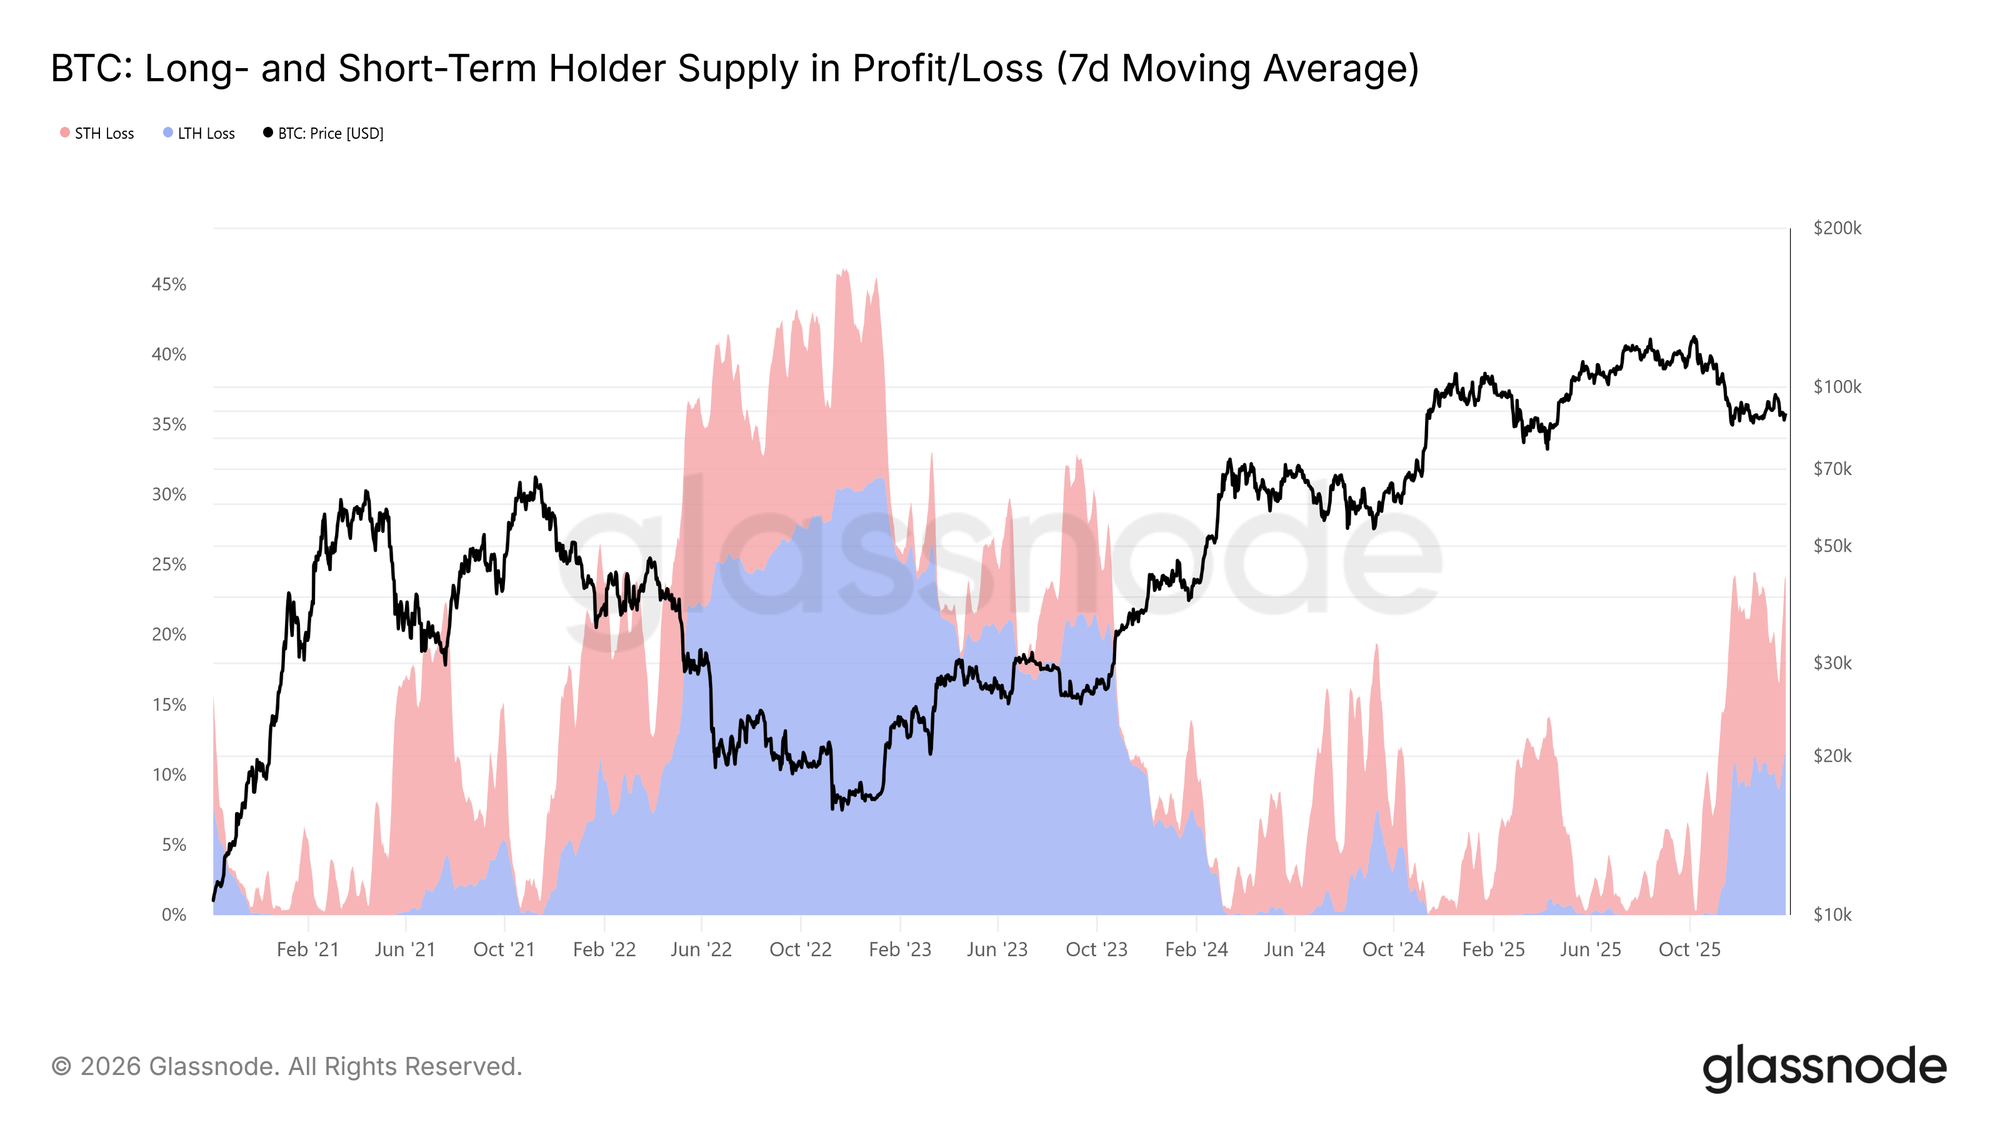
Another core on-chain indicator shaping the mid-term market structure is the Long- and Short-Term Holder Supply in Profit/Loss. This metric shows that more than 22 percent of the circulating supply is currently held at a loss, a condition comparable to the market states observed in Q1 2022 and Q2 2018. In those periods, the share of long-term holder supply in loss rose over time as top-buyer supply matured and investors chose to hold coins acquired during prior rallies.
These resilient holders are now facing growing time and price discount pressure. Should price fail to hold the highlighted support levels, namely the −1 standard deviation band of the Short-Term Holder Cost Basis model and the True Market Mean, this pressure could trigger renewed loss realization from long-term holders, adding to mid-term downside risk.
Off-Chain Insights
Spot ETF Outflows Soften
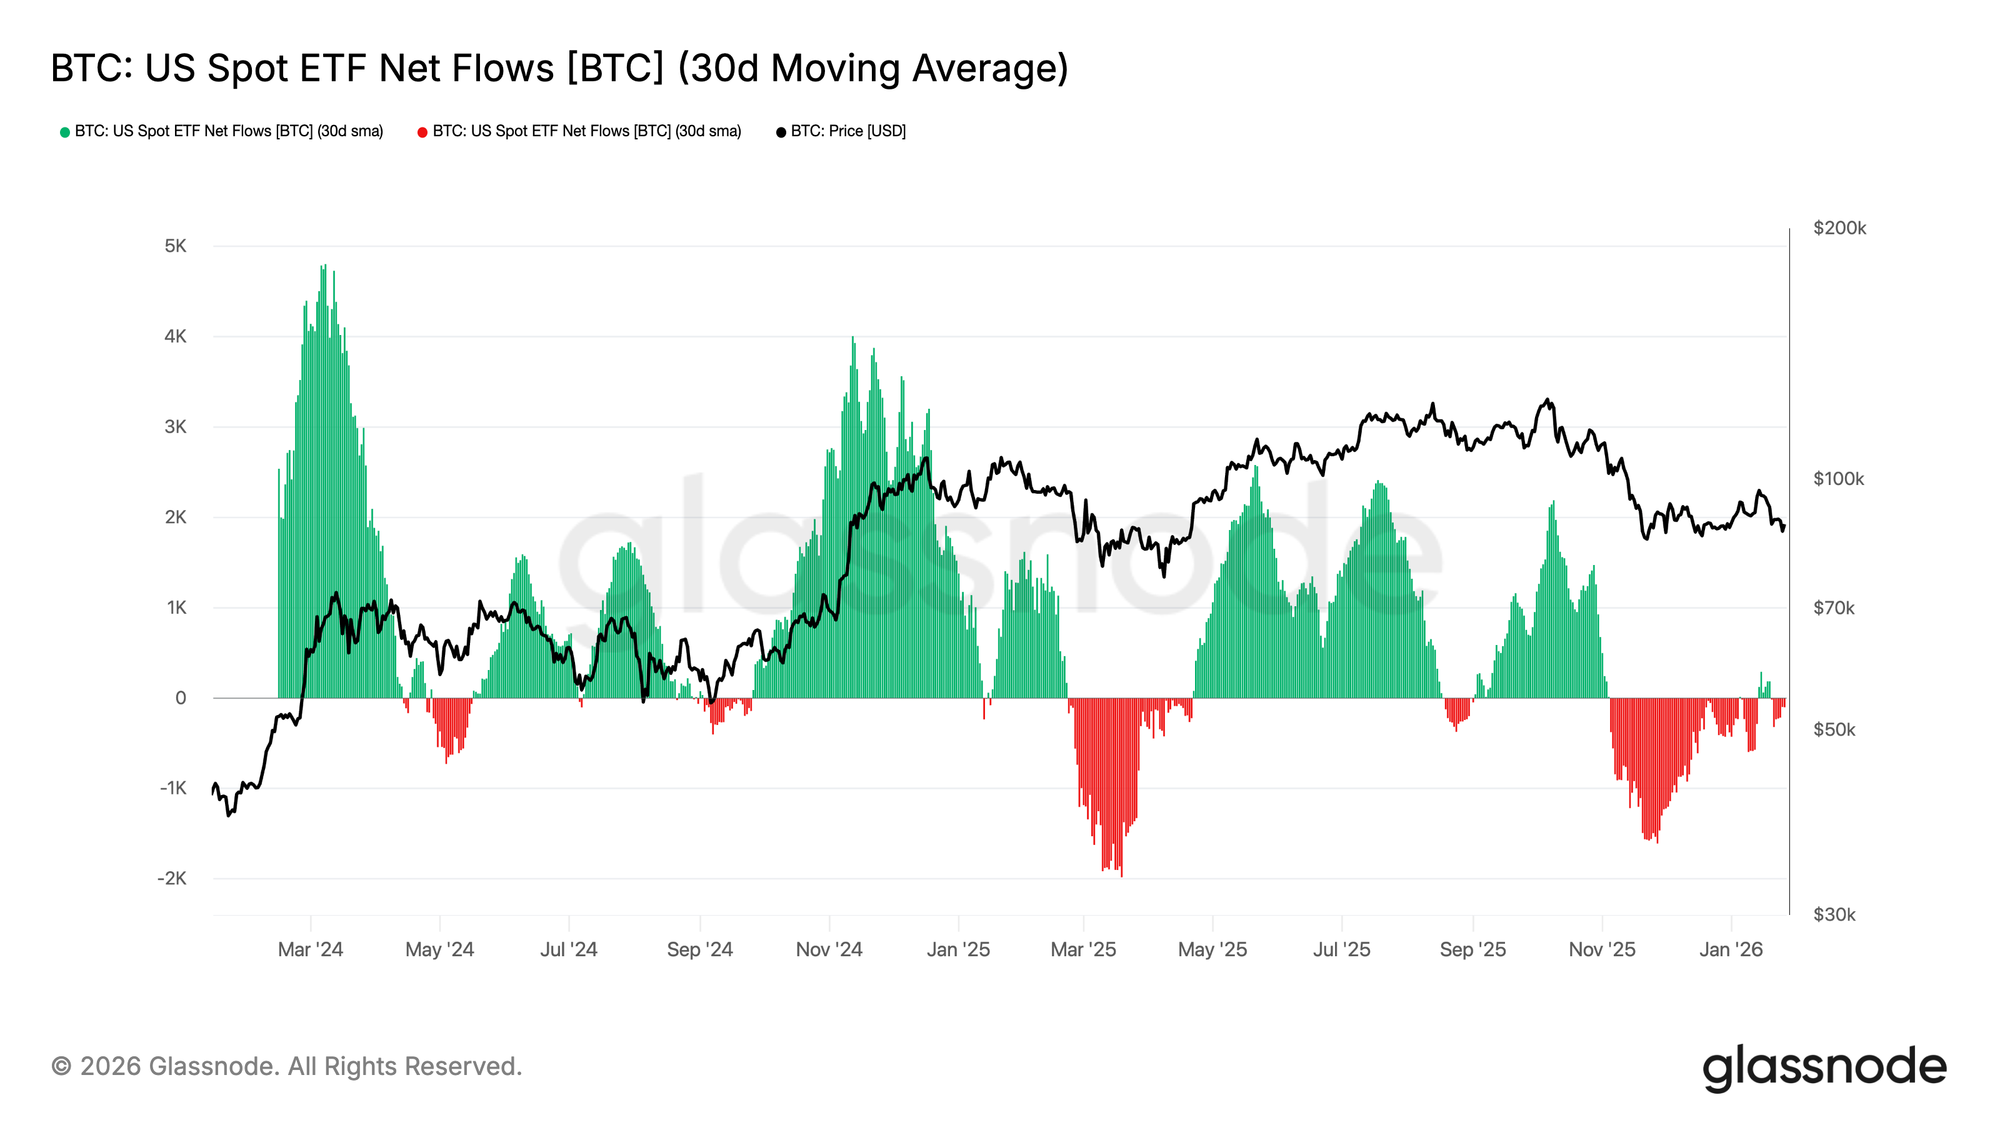
US Spot Bitcoin ETF net flows have shifted back toward equilibrium, with the 30-day moving average hovering near the zero line after an extended period of sustained outflows. This marks a meaningful cooling in sell-side pressure, as the structural bid from ETFs begins to stabilise.
Notably, the recent rebound has been modest relative to prior accumulation waves seen in early-2024 and late-2024, signalling that institutional demand remains cautious rather than aggressively risk-on. With BTC price holding in a higher range despite weaker inflow momentum, the market appears to be leaning more on spot holder conviction than fresh ETF-driven demand.
If flows can re-accelerate into consistent positive territory, it would strengthen the case for renewed trend continuation. However, failure to reclaim persistent inflows leaves BTC vulnerable to further consolidation, as the market lacks the external liquidity impulse that previously powered expansion phases.
Spot Flows Persist
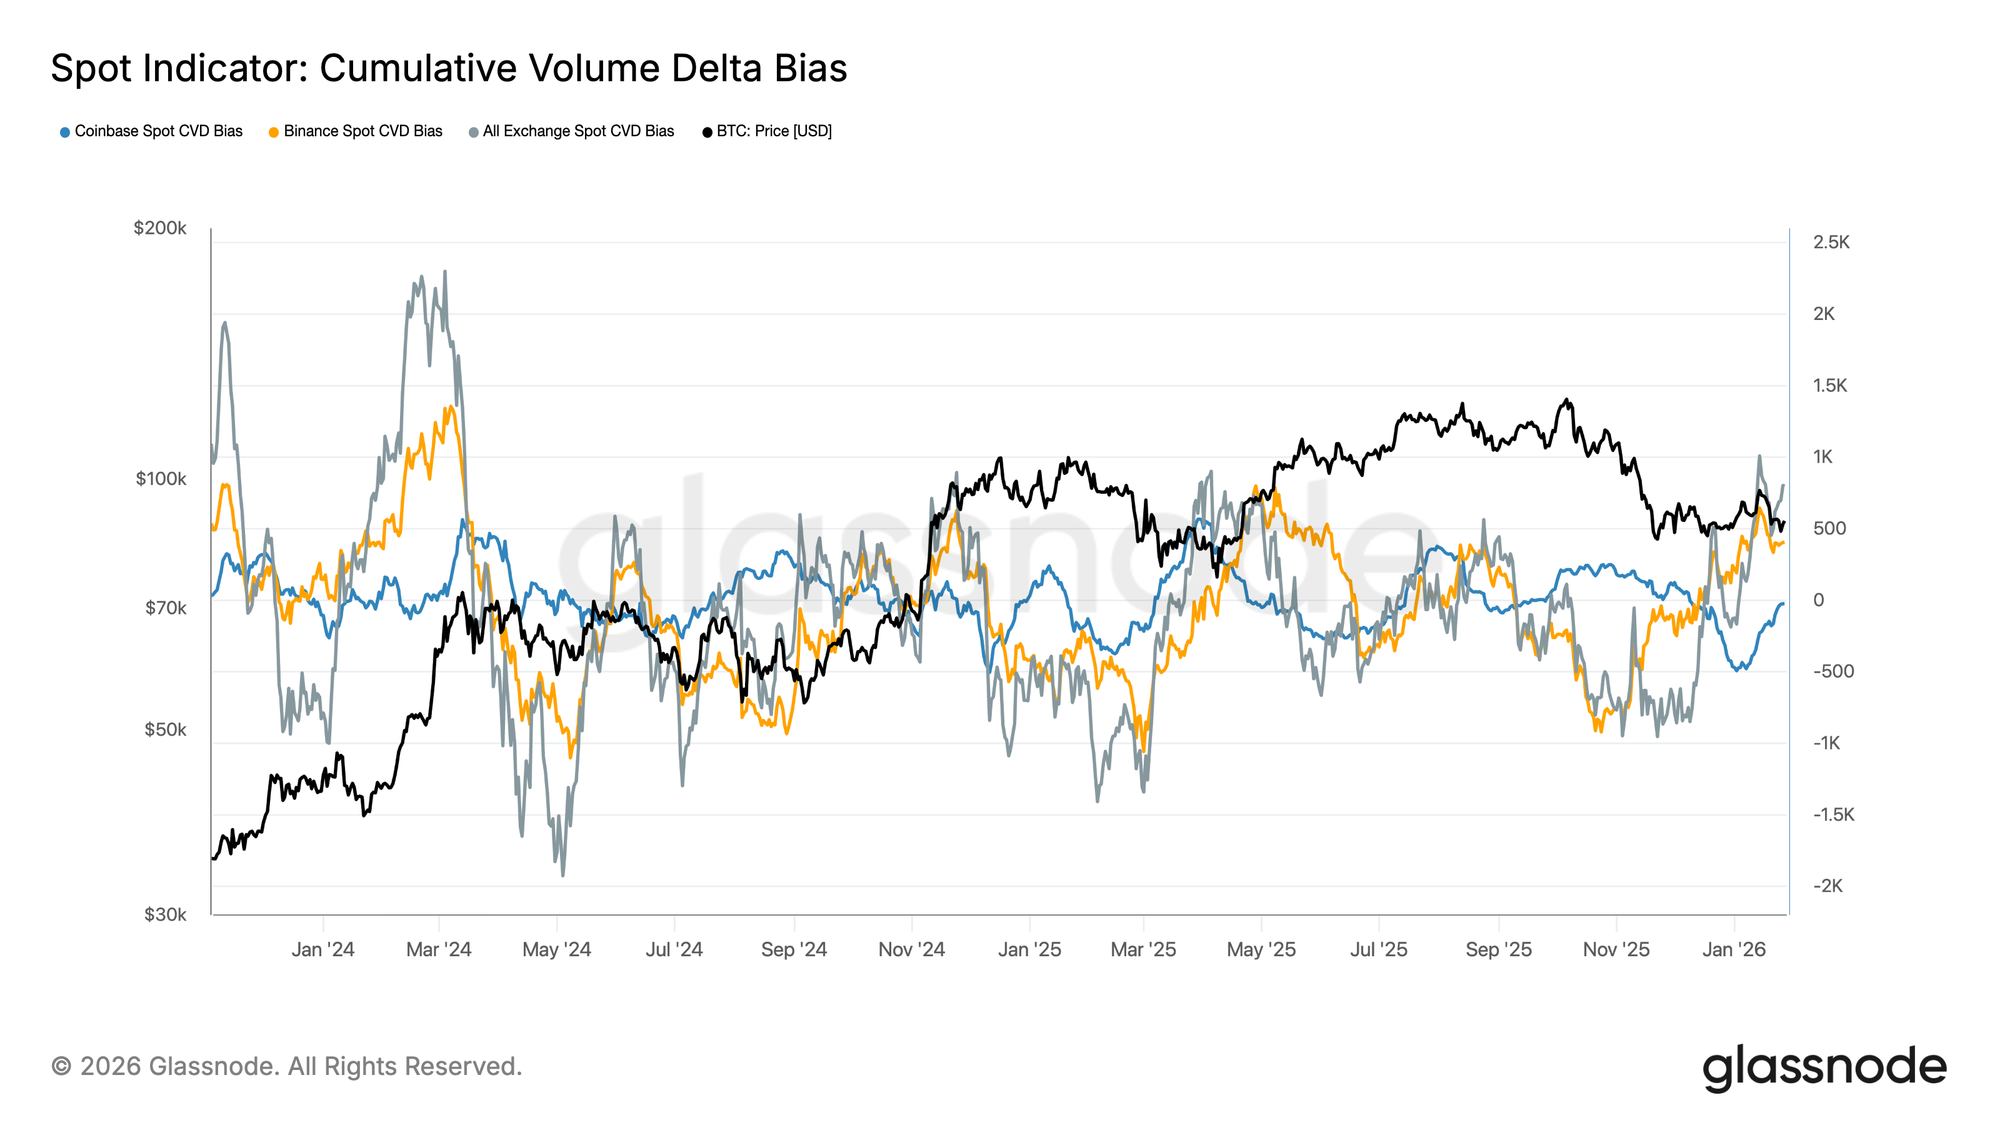
Spot CVD bias is turning higher across major venues, signalling a renewed tilt toward market buy pressure after an extended period of muted demand. Binance has led the rebound, recovering sharply from deep negative territory, while the aggregate (all-exchange) bias is also pushing back into positive territory.
Coinbase, however, remains comparatively range-bound, suggesting US-led spot demand has been steadier but less aggressive than offshore flows. This divergence points to a market where marginal bid strength is returning, but is still being driven more by global risk appetite than a decisive US spot impulse.
If this buy-side dominance persists, it would support further price stabilisation and a potential push higher. However, the market has repeatedly struggled to sustain positive CVD trends through this cycle, meaning follow-through will be key to confirming a durable shift in spot demand conditions.
Perpetual Futures Still Quiet
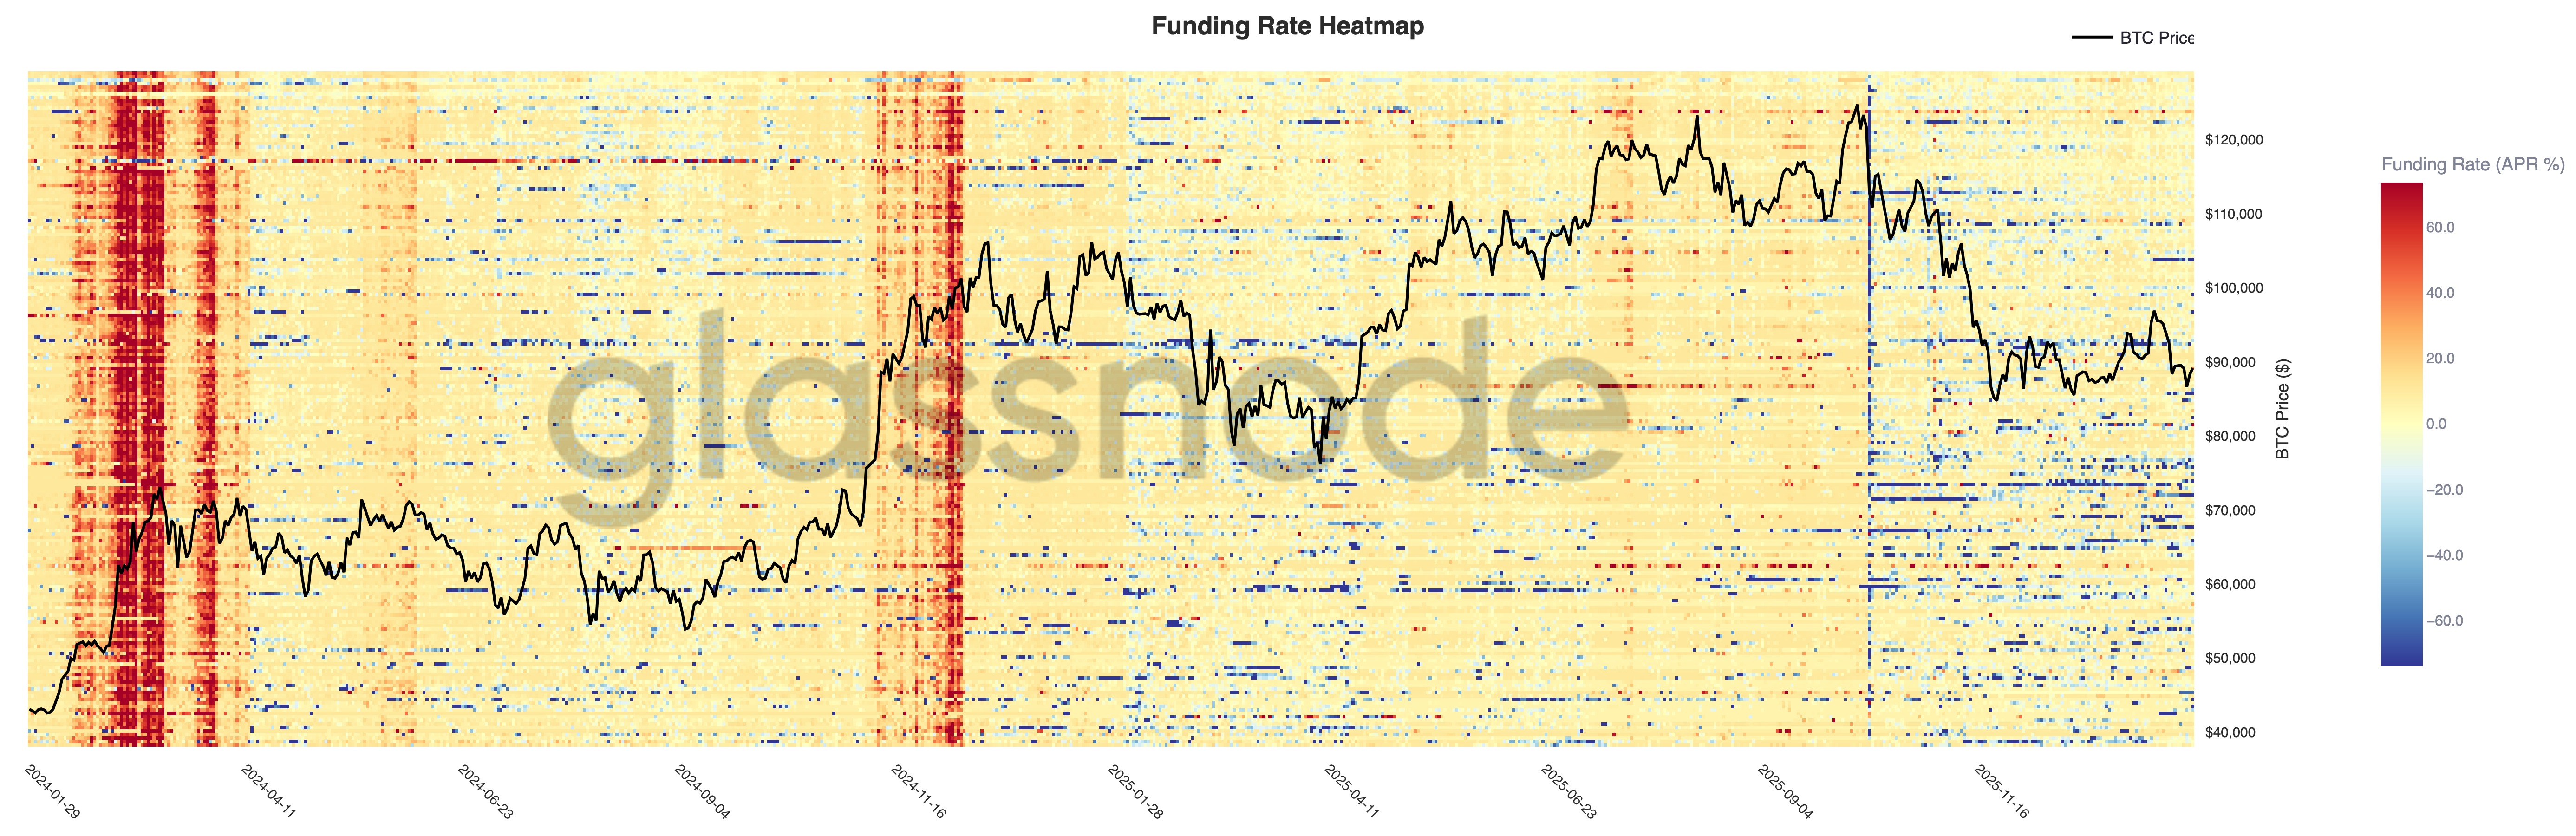
Perpetual funding conditions remain largely muted across venues, with the majority of the surface sitting close to neutral despite elevated price volatility. This suggests leverage has been washed out and positioning is now more balanced, with neither longs nor shorts consistently paying a meaningful premium to maintain exposure.
Notably, brief pockets of elevated positive funding still appear during local rallies, reflecting short-lived bursts of long demand and momentum-chasing behaviour. However, these spikes have not been sustained, reinforcing the view that speculative appetite remains fragile and quick to fade.
With funding now compressed and uneven, the market is increasingly reliant on spot-driven demand to sustain trend continuation. A renewed regime of persistently positive funding would signal leverage rebuilding and a shift back toward risk-on conditions, while continued neutrality supports a slower grind and choppier consolidation.
Implied Volatility: Front End Reprices, Back End Holds
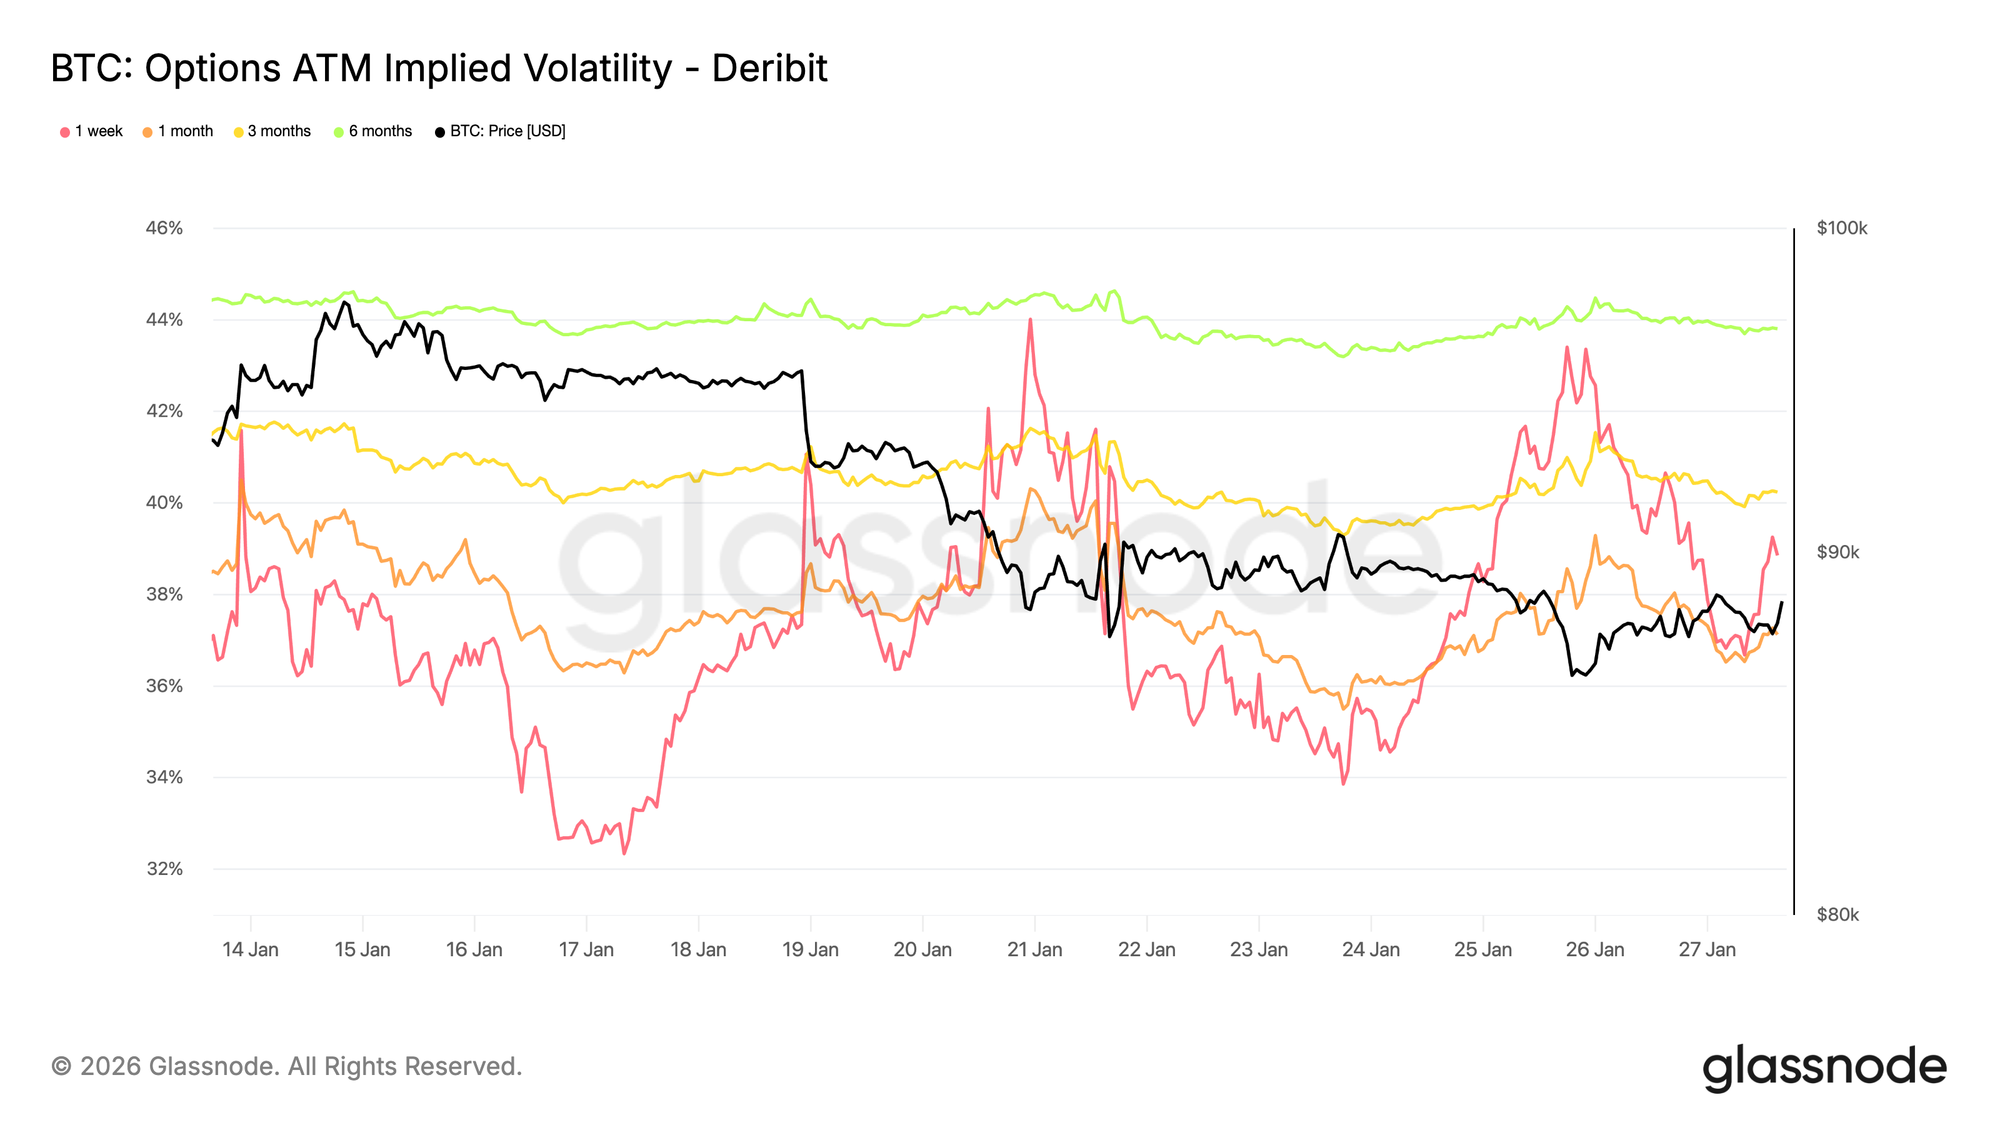
Over the weekend, short-dated ATM implied volatility repriced sharply, reflecting heightened sensitivity to the near-term risk environment rather than crypto-specific stress.
The move coincided with rising geopolitical uncertainty and broader macro risk, which typically feeds first into the front end of the volatility curve. The repricing remained concentrated in near maturities, while longer-dated volatility stayed comparatively stable.
This configuration points to a reassessment of short-term uncertainty rather than a structural shift in long-term risk expectations, suggesting a market reacting to external risk without showing signs of internal stress or dislocation.
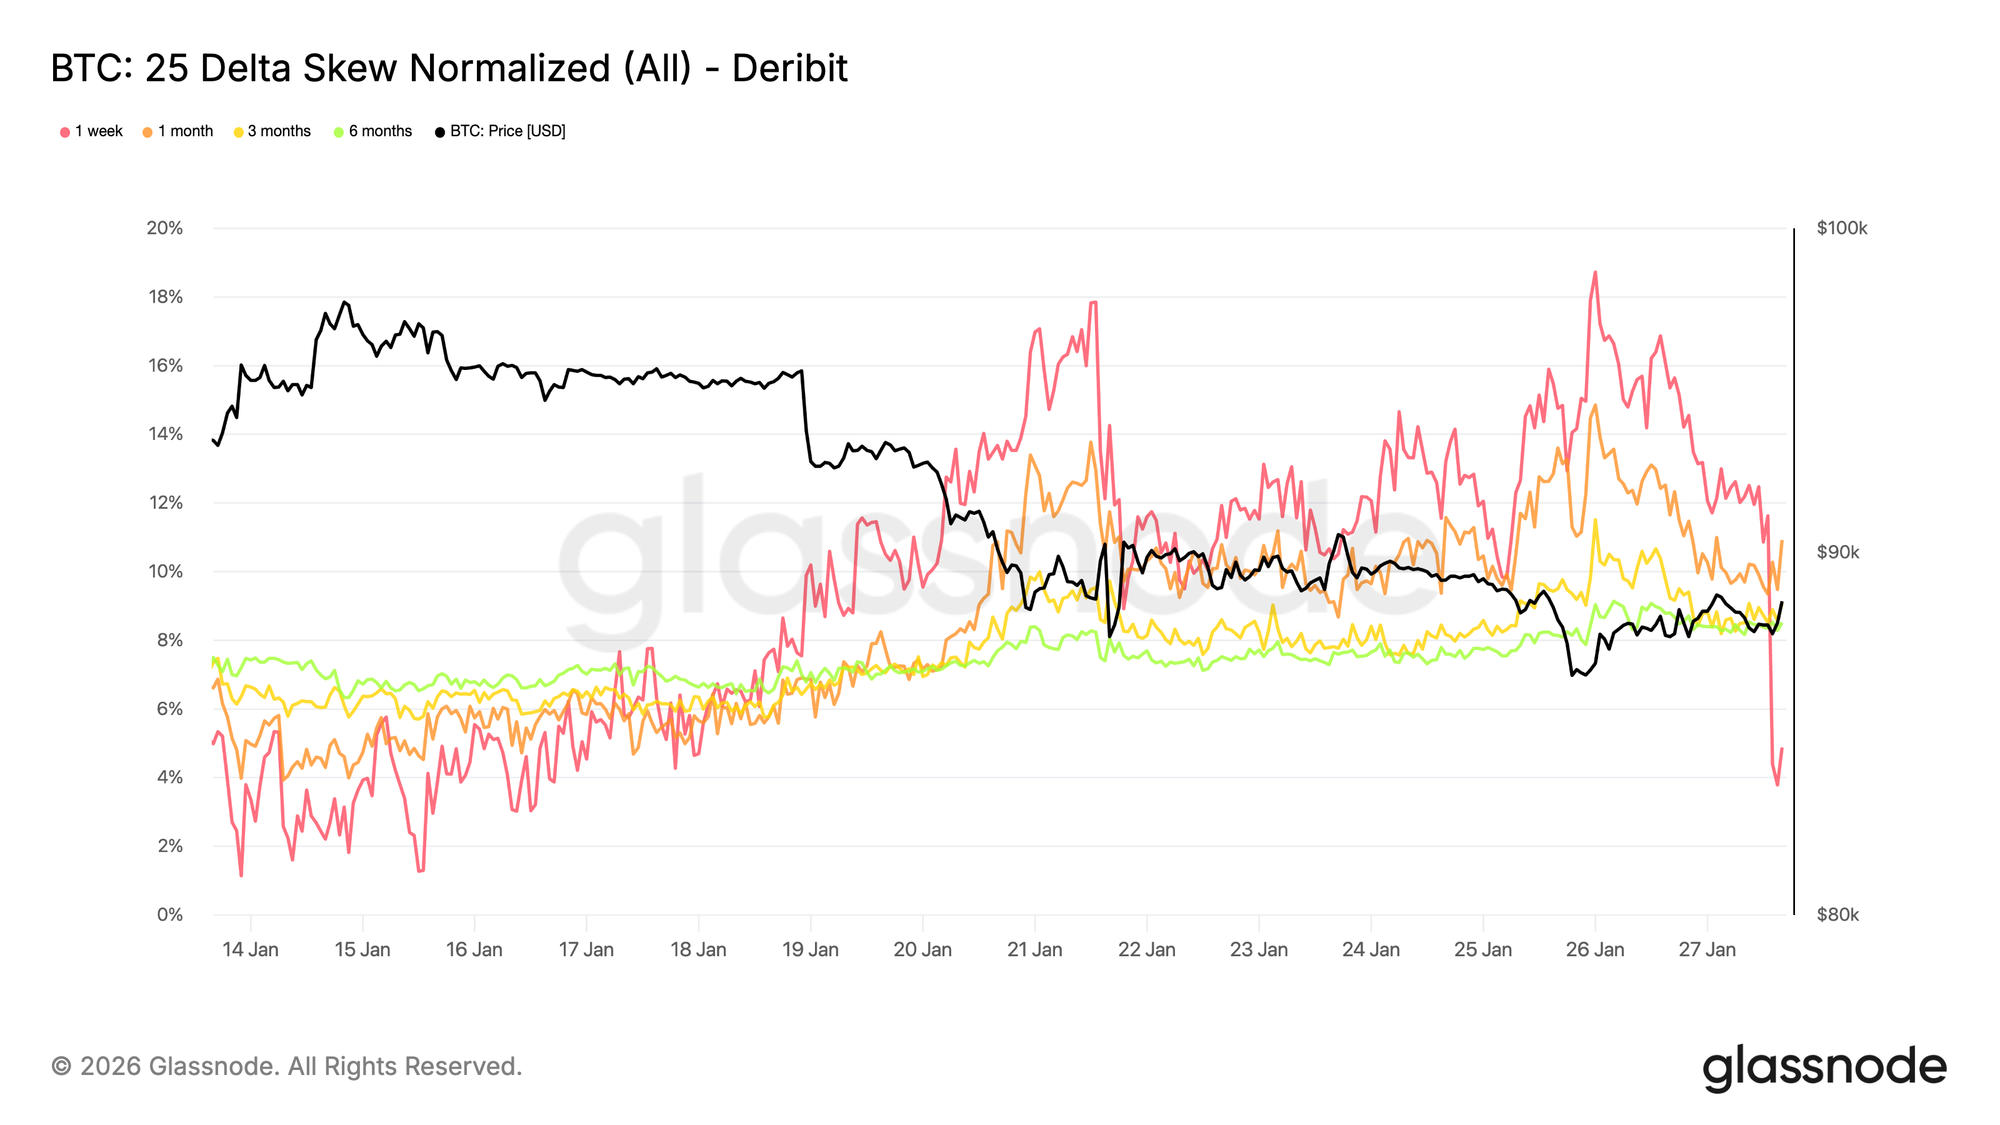
25 Delta Skew: Bearish Bias Spreads Across the Curve
As volatility adjusted, skew provides a clearer read on sentiment. The 25 delta skew has turned more bearish across maturities, reflecting increased relative demand for downside protection.
This shift suggests growing caution over the medium to long term, even as spot price action remains orderly. The adjustment has been gradual rather than abrupt, pointing to methodical hedging activity rather than panic-driven put buying.
Short-dated skew, particularly the one-week tenor, has seen larger swings, while the broader curve has shifted modestly more bearish compared to last week. This divergence highlights a market expressing caution across time horizons without signaling acute stress.
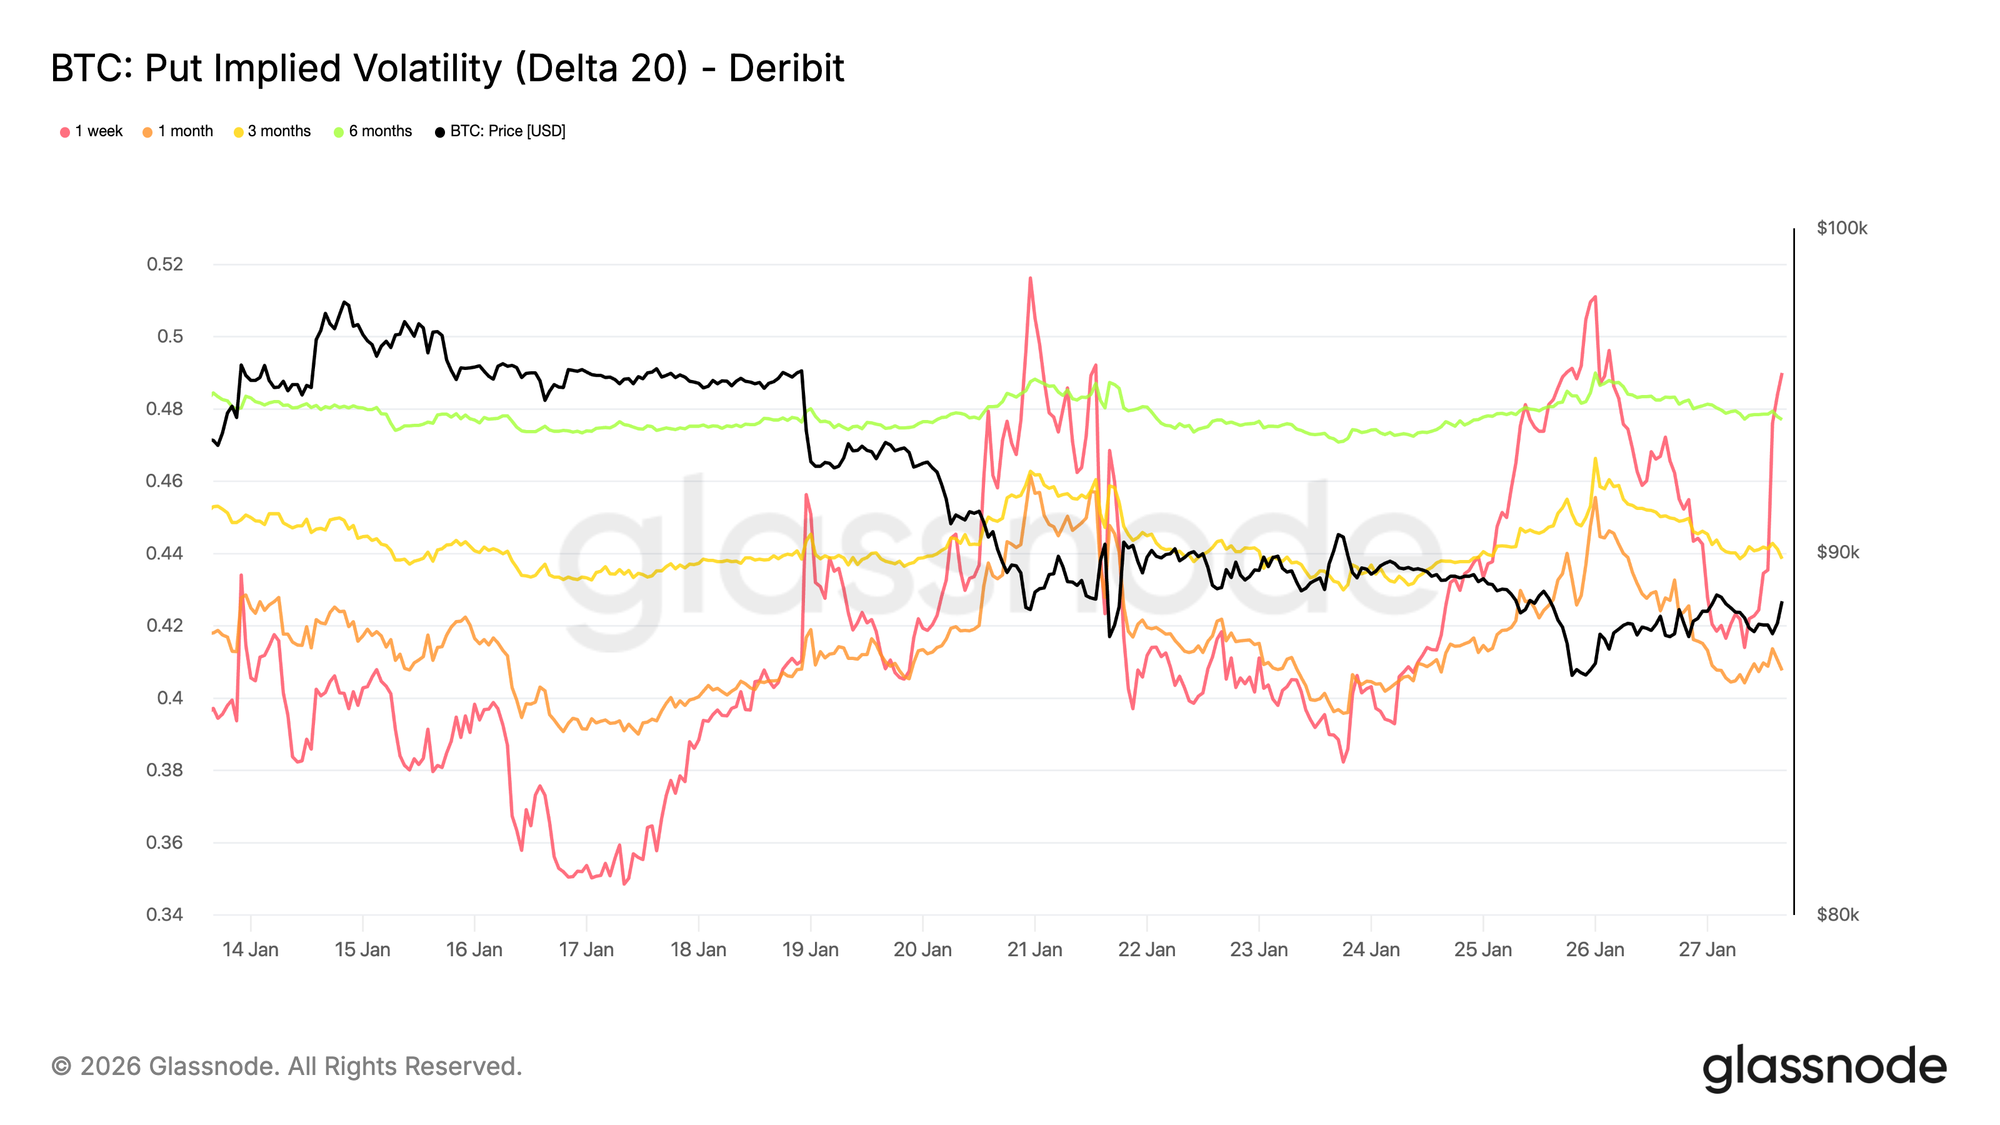
Downside Implied Volatility: Protection Without Crash Pricing
Interpolated implied volatility provides a view of volatility at a specific option delta across maturities, smoothing the surface between listed strikes. Here, the focus is on the 20 delta put, which offers a clean proxy for downside protection demand over time.
Despite the bearish skew, downside implied volatility remains relatively contained across maturities. Even looking through end-2026, the options market is pricing only modest downside scenarios.
This highlights an important nuance. Participants are willing to pay relatively more for downside protection compared to calls, but they are not assigning a high probability to severe drawdowns. In this setup, sentiment is clearly defensive, while expectations around the magnitude of downside remain anchored.
This configuration aligns with recent spot behavior, which has reflected controlled weakness rather than disorderly selling.
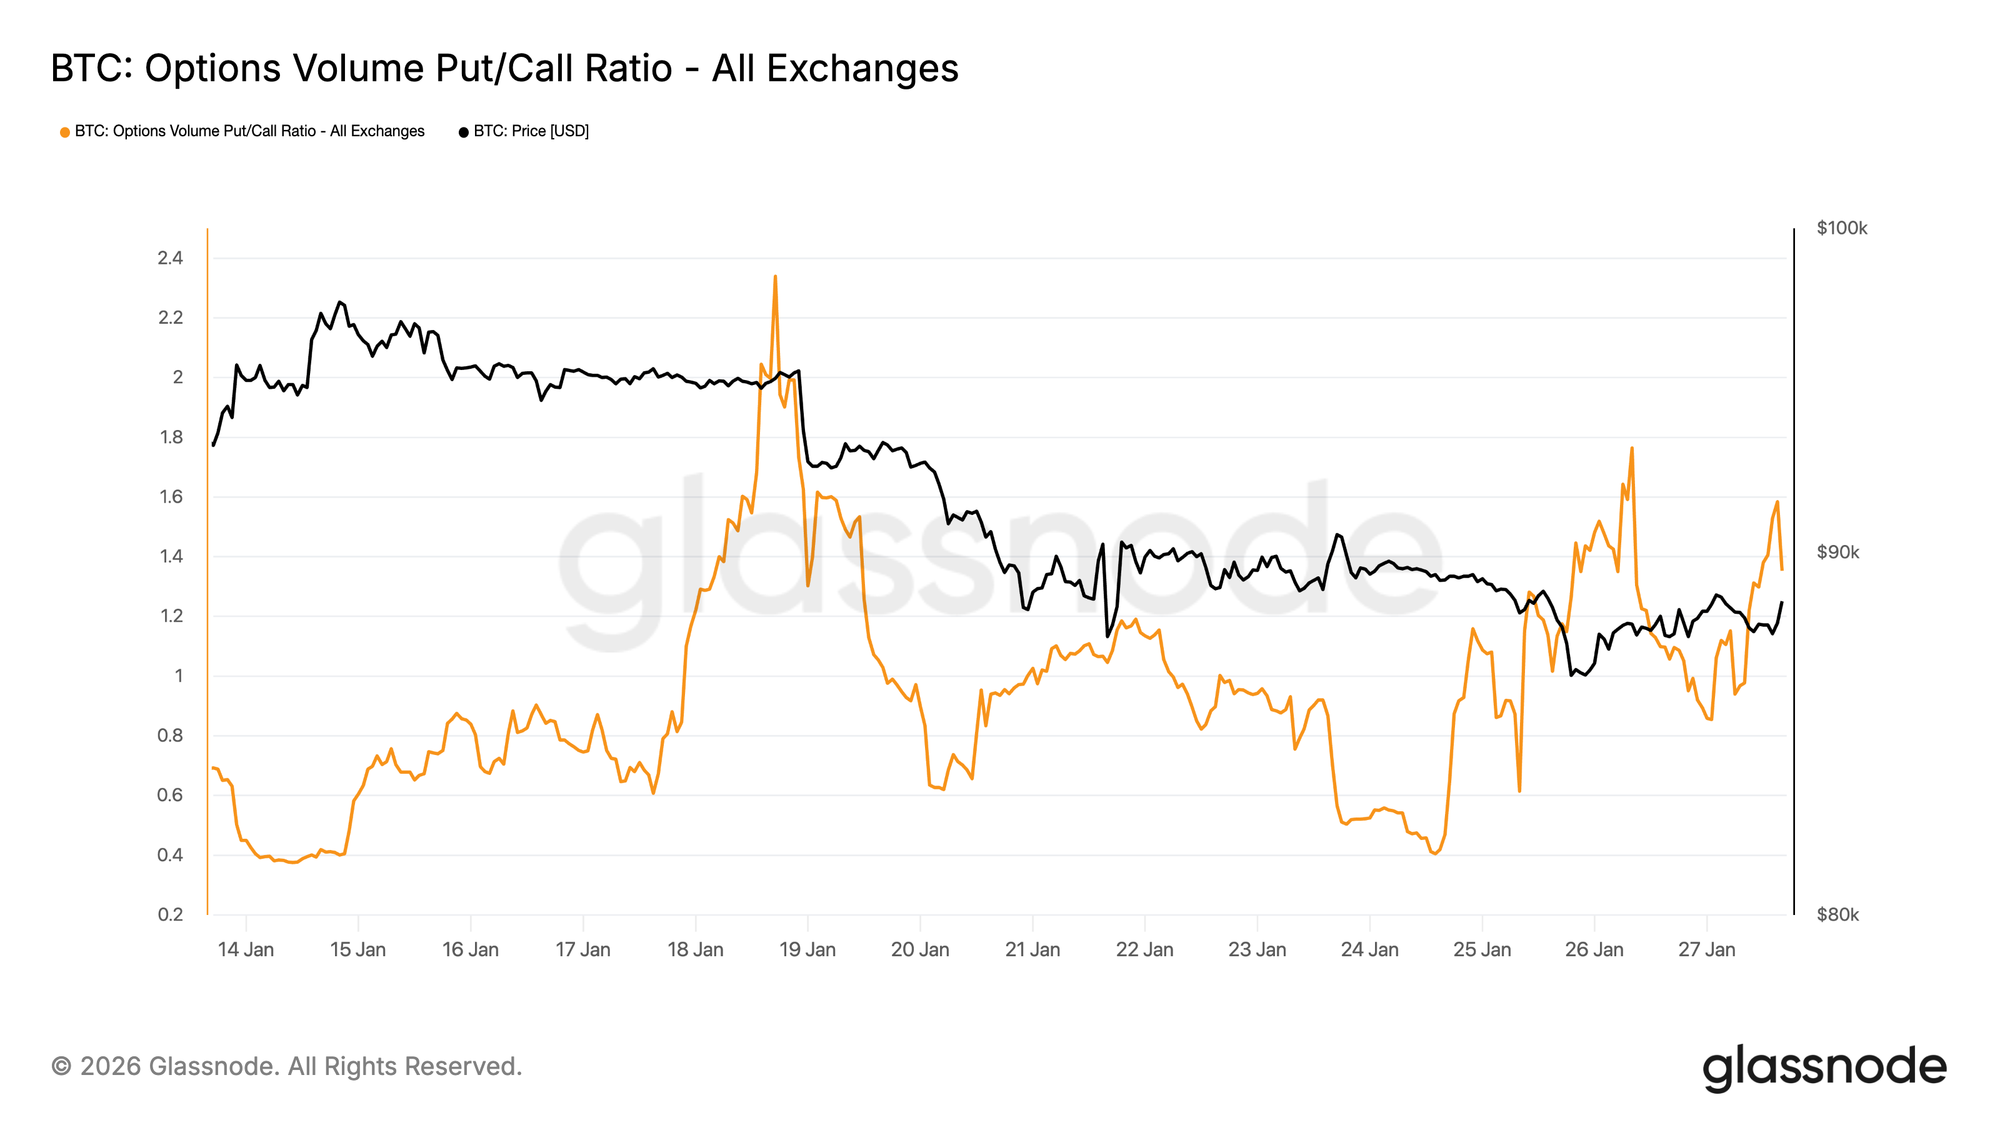
Put Volume Leads
Turning to flow, the options volume put-call ratio confirms this defensive posture. Put activity has increased relative to calls, but without the type of volume spikes typically associated with panic hedging.
Volume remains active yet orderly, suggesting traders are gradually repositioning rather than reacting emotionally to price moves. This behavior is consistent with a market that acknowledges downside risks while drifting lower in a controlled manner, echoing the cautious tone already visible in skew.
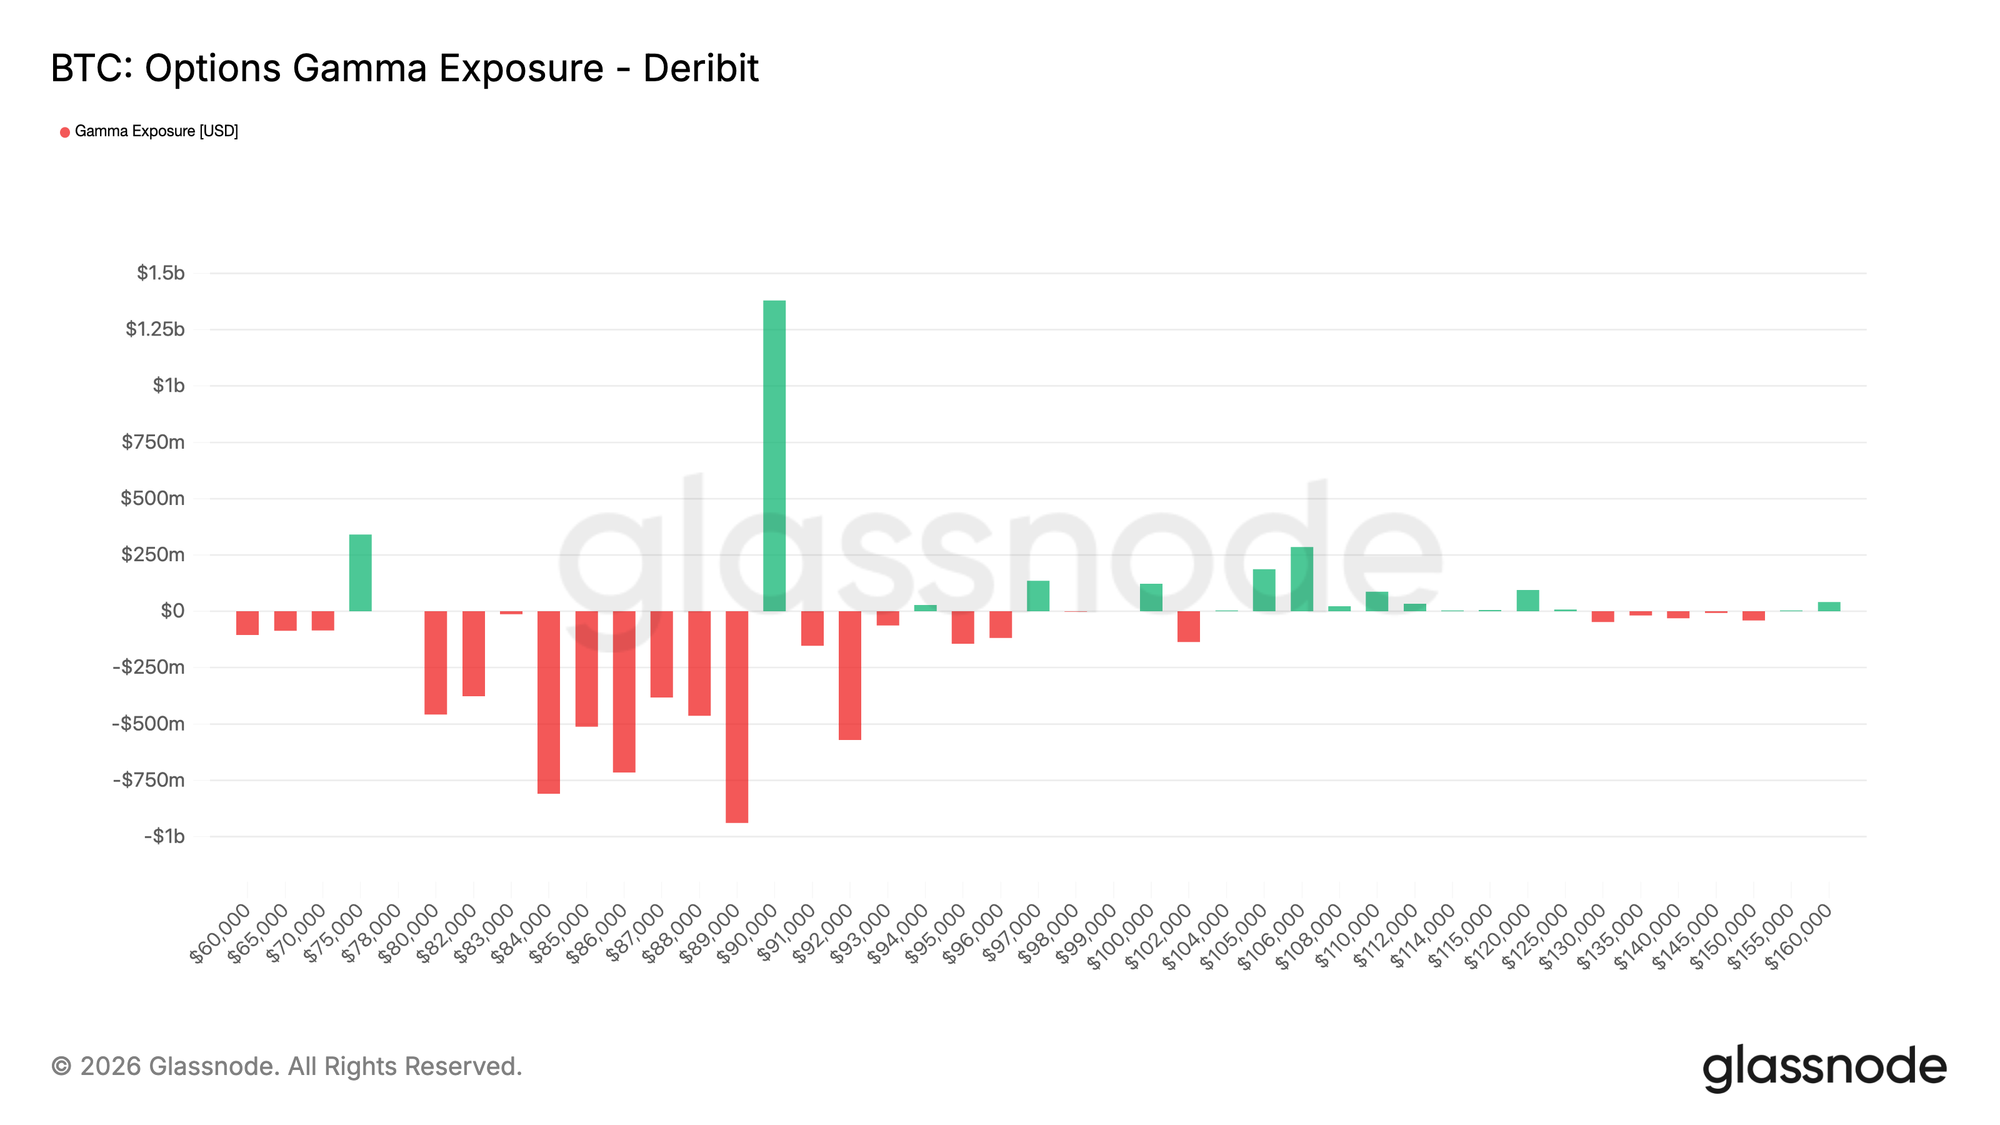
Dealer Gamma Favors Downside Below 90K
Dealer gamma exposure highlights an important structural feature of the current setup. Dealers are positioned short gamma across a broad corridor, extending from 90K down toward the mid-70K area, which coincides with a notable support zone.
In a short gamma environment, dealer hedging tends to reinforce price moves. As spot trades lower, dealers hedge short put exposure by selling futures or spot, mechanically adding to downside momentum. This dynamic helps explain why pullbacks can extend even in the absence of aggressive selling pressure.
At the same time, a significant pocket of long gamma remains concentrated around the 90K level. This positioning implies that upside progress through that area would require sustained buying interest rather than incremental flows.
Until such conditions emerge, positioning favors a controlled downward drift rather than sharp reversals.
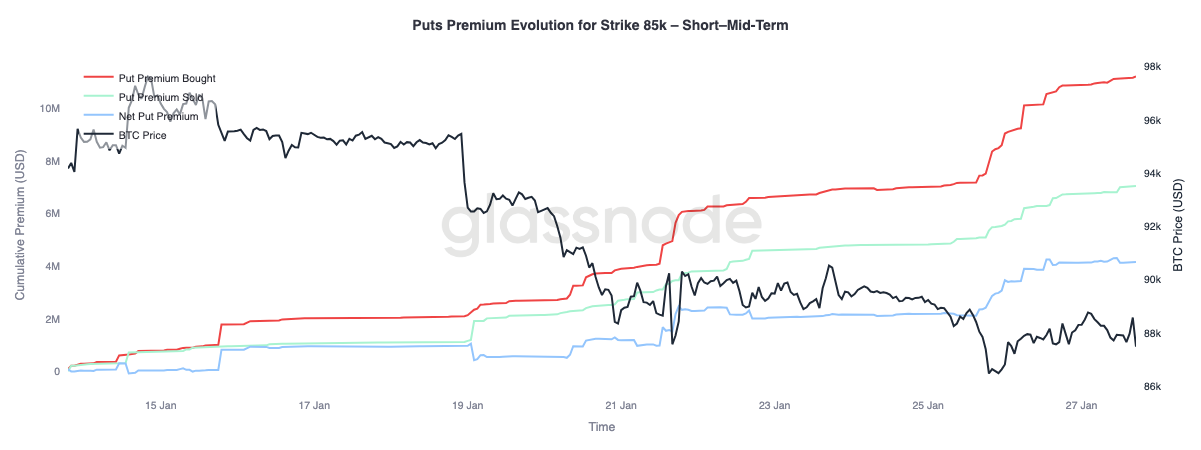
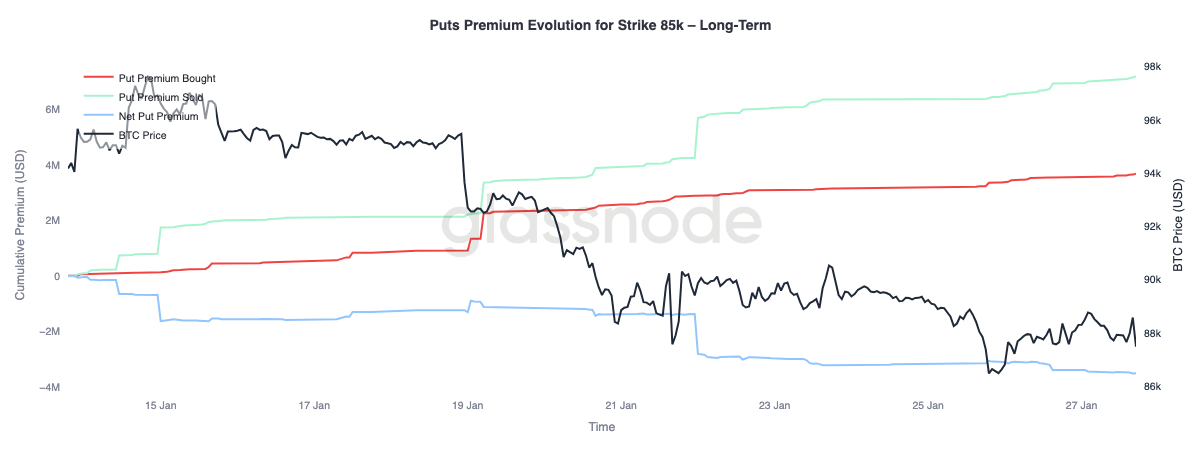
Put Premium Bid Short Term, Sold Long Term
Zooming in on the put premium evolution at the 85K strike reveals two distinct behaviors across maturities. In the short to mid term, up to three months, put premium bought has clearly dominated premium sold, pushing net put premium higher.
Beyond three months, the dynamic reverses. Longer-dated expiries show net put premium being sold, indicating a willingness to fade downside further out the curve.
This split reflects a market responding to Bitcoin’s drift from the mid-$90k range into the high-$80k region by hedging near-term downside, while remaining comfortable selling longer-dated protection. The structure points to short-term caution without a broader deterioration in long-term risk expectations.
Conclusion
Bitcoin continues to consolidate around structurally important on-chain levels, where the balance between holder conviction and marginal demand remains finely poised. Short-Term Holder conditions still appear weak, leaving the market susceptible to additional distribution if support fails to hold and recent entrants are forced to de-risk.
However, the broader flow picture has stabilised. ETF selling pressure has cooled, and spot market positioning is showing early signs of improvement, particularly offshore, suggesting buy-side interest is beginning to rebuild. At the same time, derivatives markets remain restrained, with neutral funding pointing to a leverage-light environment where price is less dependent on speculative momentum.
Options positioning reinforces this caution. Skew has shifted bearish, near-term protection is being repriced higher, and dealer gamma moving below zero increases the likelihood of sharper price swings during bouts of volatility.
From here, the path forward hinges on whether demand can sustain across spot and ETF channels. A return to persistent positive inflows and stronger spot bid would support trend continuation, while ongoing fragility and rising downside hedging demand keeps the market vulnerable to further consolidation or a deeper retracement.
Disclaimer: This report does not provide any investment advice. All data is provided for informational and educational purposes only. No investment decision shall be based on the information provided here, and you are solely responsible for your own investment decisions.
Exchange balances presented are derived from Glassnode’s comprehensive database of address labels, which are amassed through both officially published exchange information and proprietary clustering algorithms. While we strive to ensure the utmost accuracy in representing exchange balances, it is important to note that these figures might not always encapsulate the entirety of an exchange’s reserves, particularly when exchanges refrain from disclosing their official addresses. We urge users to exercise caution and discretion when utilizing these metrics. Glassnode shall not be held responsible for any discrepancies or potential inaccuracies.