Strategy Watch #2

insights.glassnodePubblicato 2026-03-24Pubblicato ultima volta 2026-03-24

Introduzione

Strategy Watch #2 provides institutional analysis of digital asset fund performance and allocation trends. The report covers six key areas: institutional capital flows, fund performance, macro strategies, on-chain vault returns, manager sentiment, and allocation updates. In February and early March, Bitcoin and Ethereum saw significant net outflows (-$9.6B and -$3.2B respectively), while stablecoins attracted inflows (+$6.2B), suggesting a defensive shift toward lower-risk assets. BTC ETF flows turned positive in March, though institutional conviction remains cautious. DeFi Total Value Locked (TVL) on Ethereum declined sharply, with peak outflows of -$23.7B in February, indicating reduced participation in on-chain yield strategies. CME basis yields continued to tighten, reflecting lower institutional leverage and softer derivatives demand. The report also highlights performance trends, with only one strategy type generating positive returns in February. Over 300 managers shared their three-month market outlook, and a new $750M fund of funds was announced.

The full report is freely available in PDF format.

Download PDF version

Welcome to Strategy Watch #2

Strategy Watch was built to address a clear demand for high-signal, impartial analysis of fund-level performance and allocation trends in digital assets.

The inaugural edition confirmed this demand, reaching a broad audience of key decision makers, from leading global asset managers, hedge funds, major investment banks, top-tier crypto-native funds and Fund of Funds.

Building on this early momentum, our objective is straightforward — to make Strategy Watch a must-read monthly publication for the digital asset investment community.

This publication is strengthened by direct input from market participants. Funds and allocators that contribute data and insights help shape a more complete and valuable view of the landscape.

If you have insights, data, or allocation updates worth sharing, we welcome your contribution.

Present your latest initiatives and updates to a curated audience of institutional allocators.

Share updates ↗

Inside the Latest Strategy Watch

The report is structured across six core sections, each focused on a distinct dimension of institutional activity in digital assets:

01 Institutional Flow Monitor |

02 Fund and SMA Performance | February was a bloodbath, check this section to see the only strategy type that returned positively last month.

03 Strategy Deep Dive: Macro Strategies | Hear firsthand from a macro portfolio manager on how they are navigating the current geopolitical challenges. 

04 On-chain Vault Performance | Are ETH curators underperforming ETH staking yield?

05 Manager Monitor | Find out how more than 300 managers are expecting the crypto market to perform over the next three months.

06 Allocation Updates | New USD 750m Fund of Funds is launching. Check this section to learn more.

in partnership with

The Premier Digital Assets Allocator Platform. Learn more


Institutional Flow Monitor

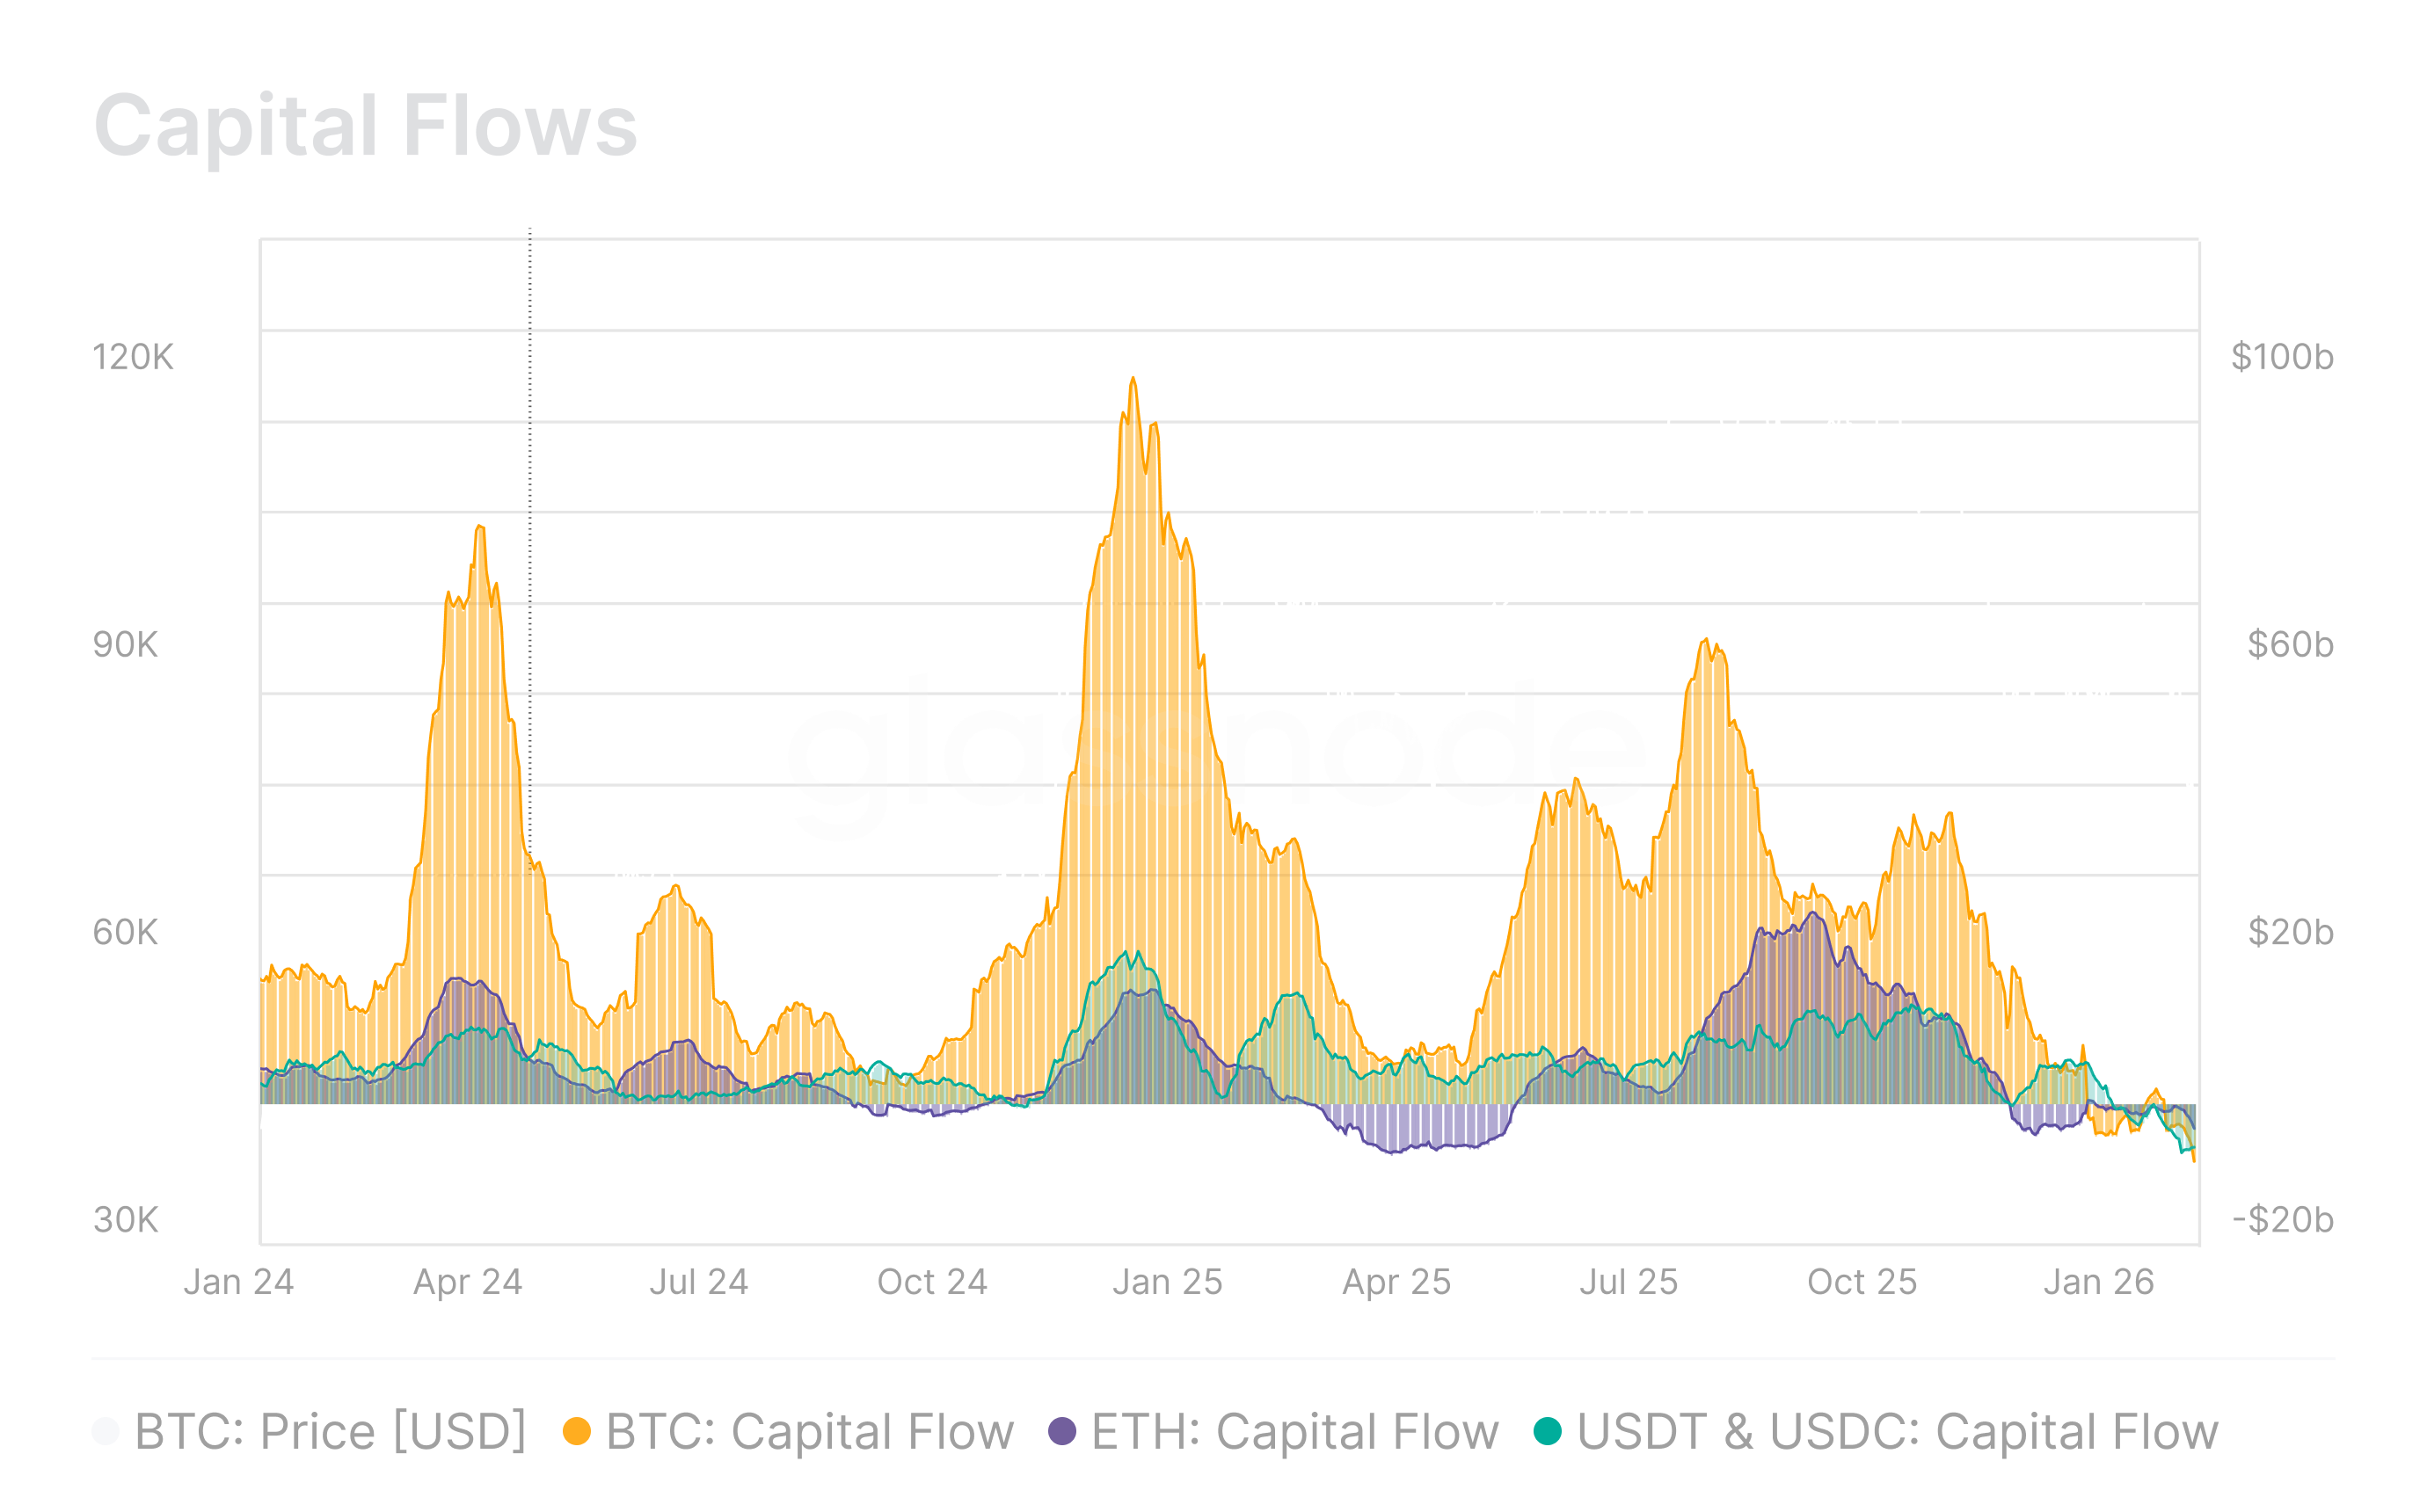
Capital flows into BTC and ETH remained deeply negative through February and into March, with stablecoins turning net positive in early March as investors rotated toward lower-risk positioning.

Bitcoin and Ethereum continued to experience sustained net outflows, with BTC and ETH capital flows registering -$9.6B and -$3.2B. However, stablecoins broke from the broader negative trend, flipping to +$6.2B in net inflows. Rather than signaling a broad return of risk appetite, this rotation likely reflects a defensive repositioning, with capital migrating into dollar-denominated on-chain instruments while conviction in spot crypto assets remains under pressure heading into mid-Q1 2026.
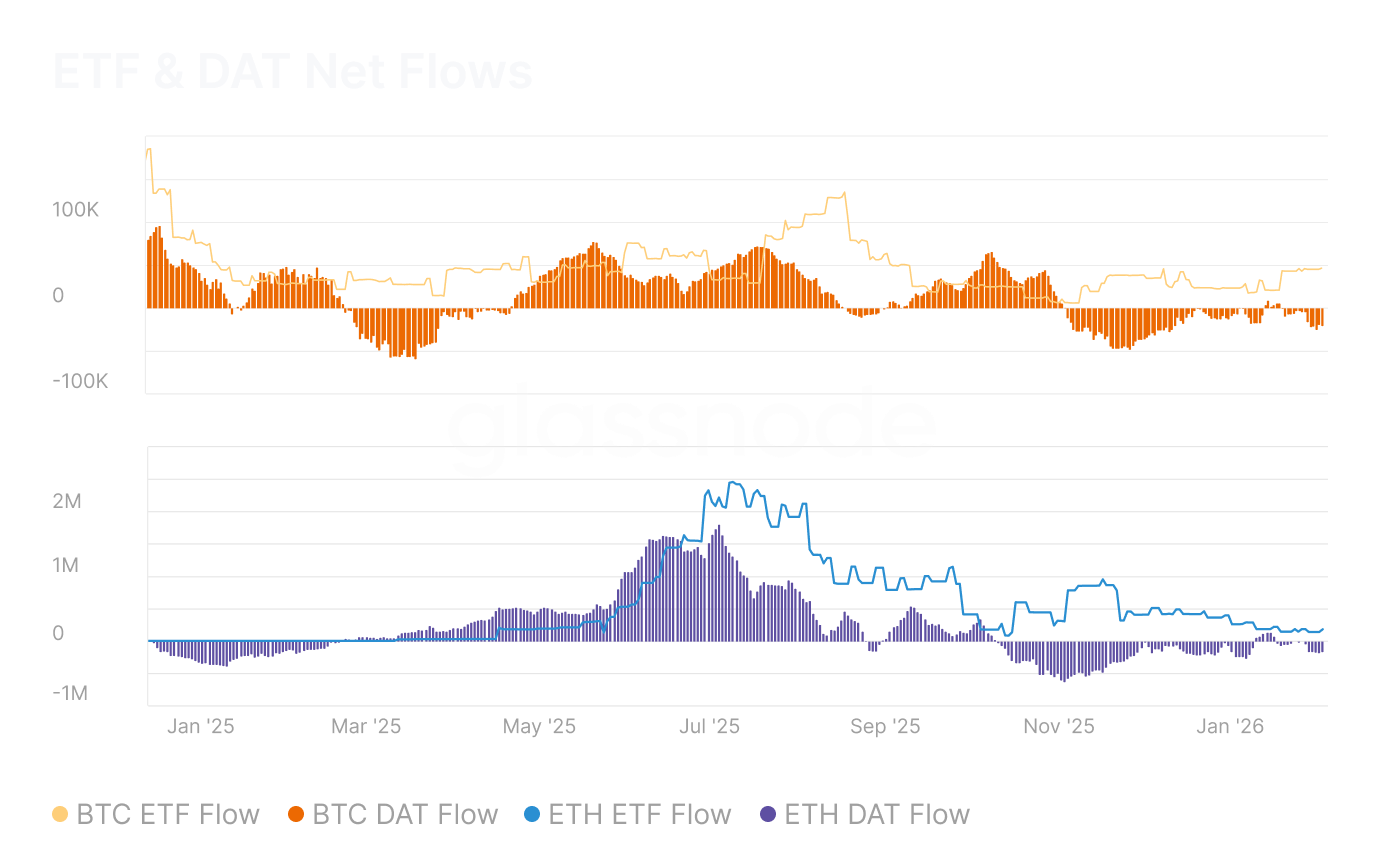
ETF & DAT Net Flows

After sustained February outflows, BTC ETF and DAT flows returned to positive, while ETH institutional flows showed early signs of stabilization.

After sustained February outflows, Bitcoin ETF and DAT flows returned to positive territory, recovering to +28k BTC and +46.8k BTC respectively. Ethereum flows were more measured, with ETF flows near neutral at +46.5k ETH and DAT flows stabilizing at +295.8k ETH. While the directional shift is encouraging, the recovery remains early-stage and uneven, and it would be premature to characterize this as a broad resumption of institutional conviction.
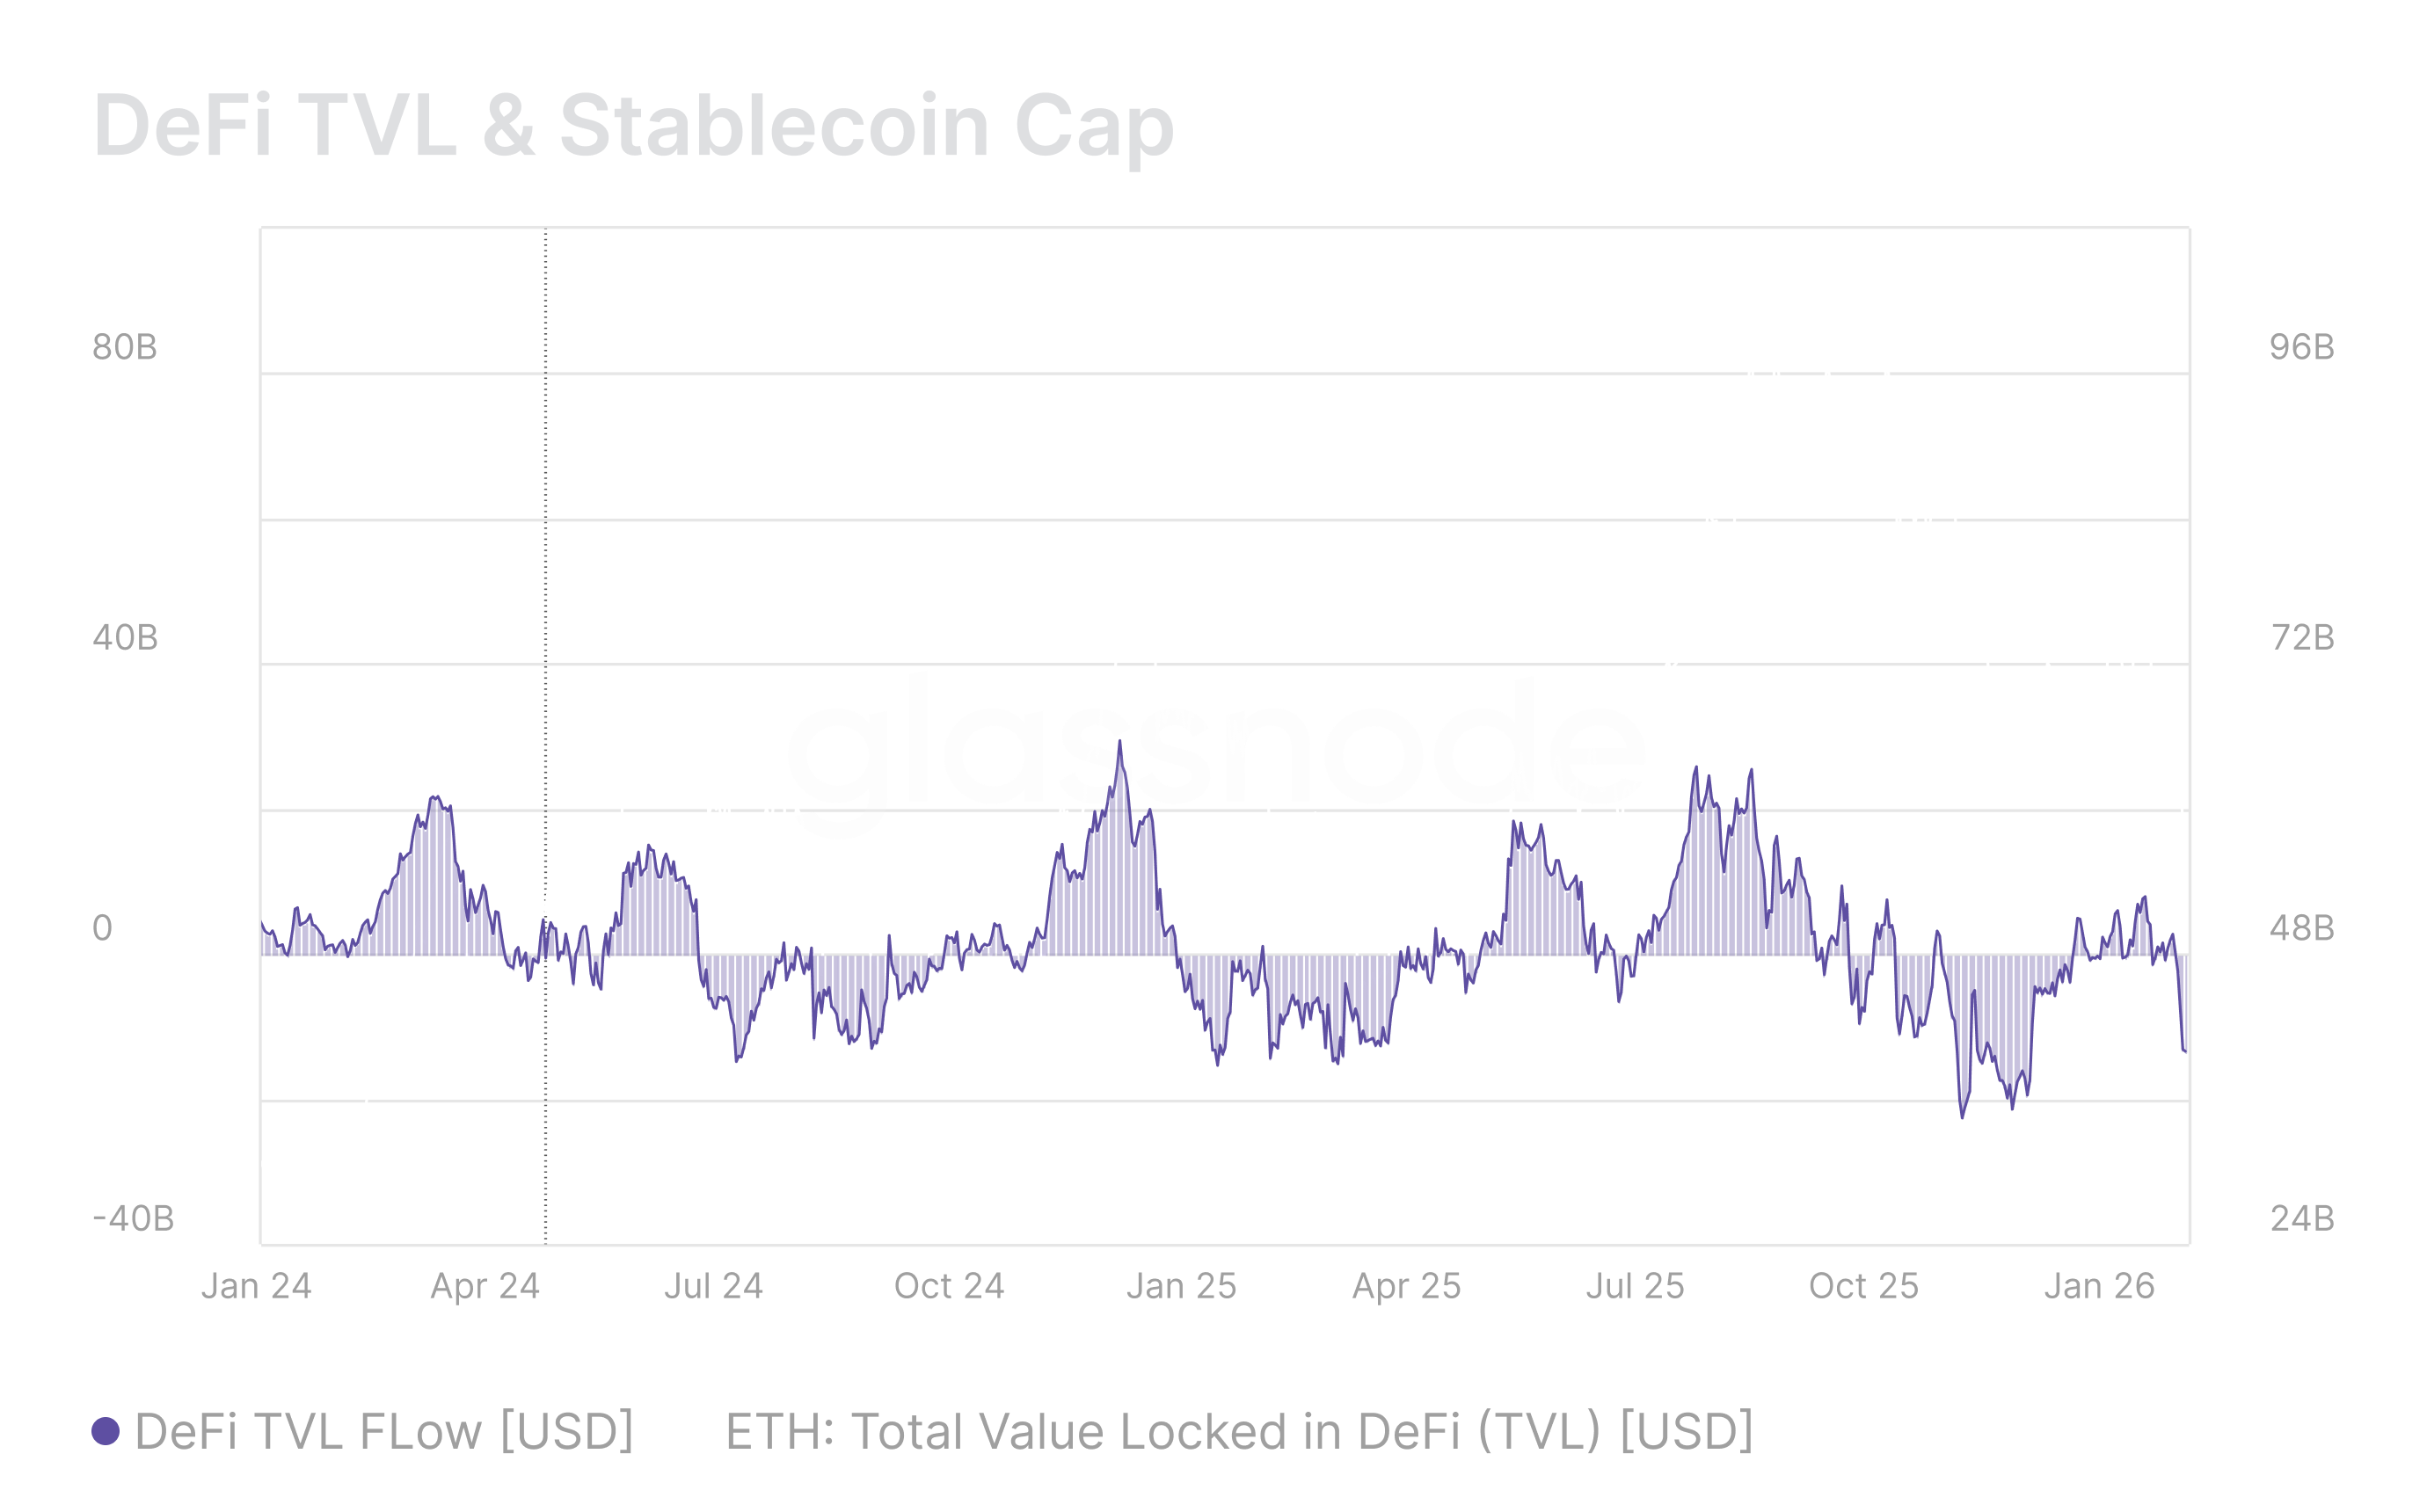
DeFi TVL & Stablecoin Cap

DeFi TVL on Ethereum saw sharp contraction through February before showing early signs of stabilization in March, though the broader declining trend since August 2025 remains intact.

Total Value Locked on Ethereum recorded peak outflows of -$23.7B per month in February, implying sustained withdrawal by larger allocators from on-chain activities such as liquidity provisioning and yield strategies. This slowdown alone is insufficient to signal a reversal, and diminished conviction in DeFi risk-adjusted returns continues to point to shallower liquidity depth across the ecosystem.
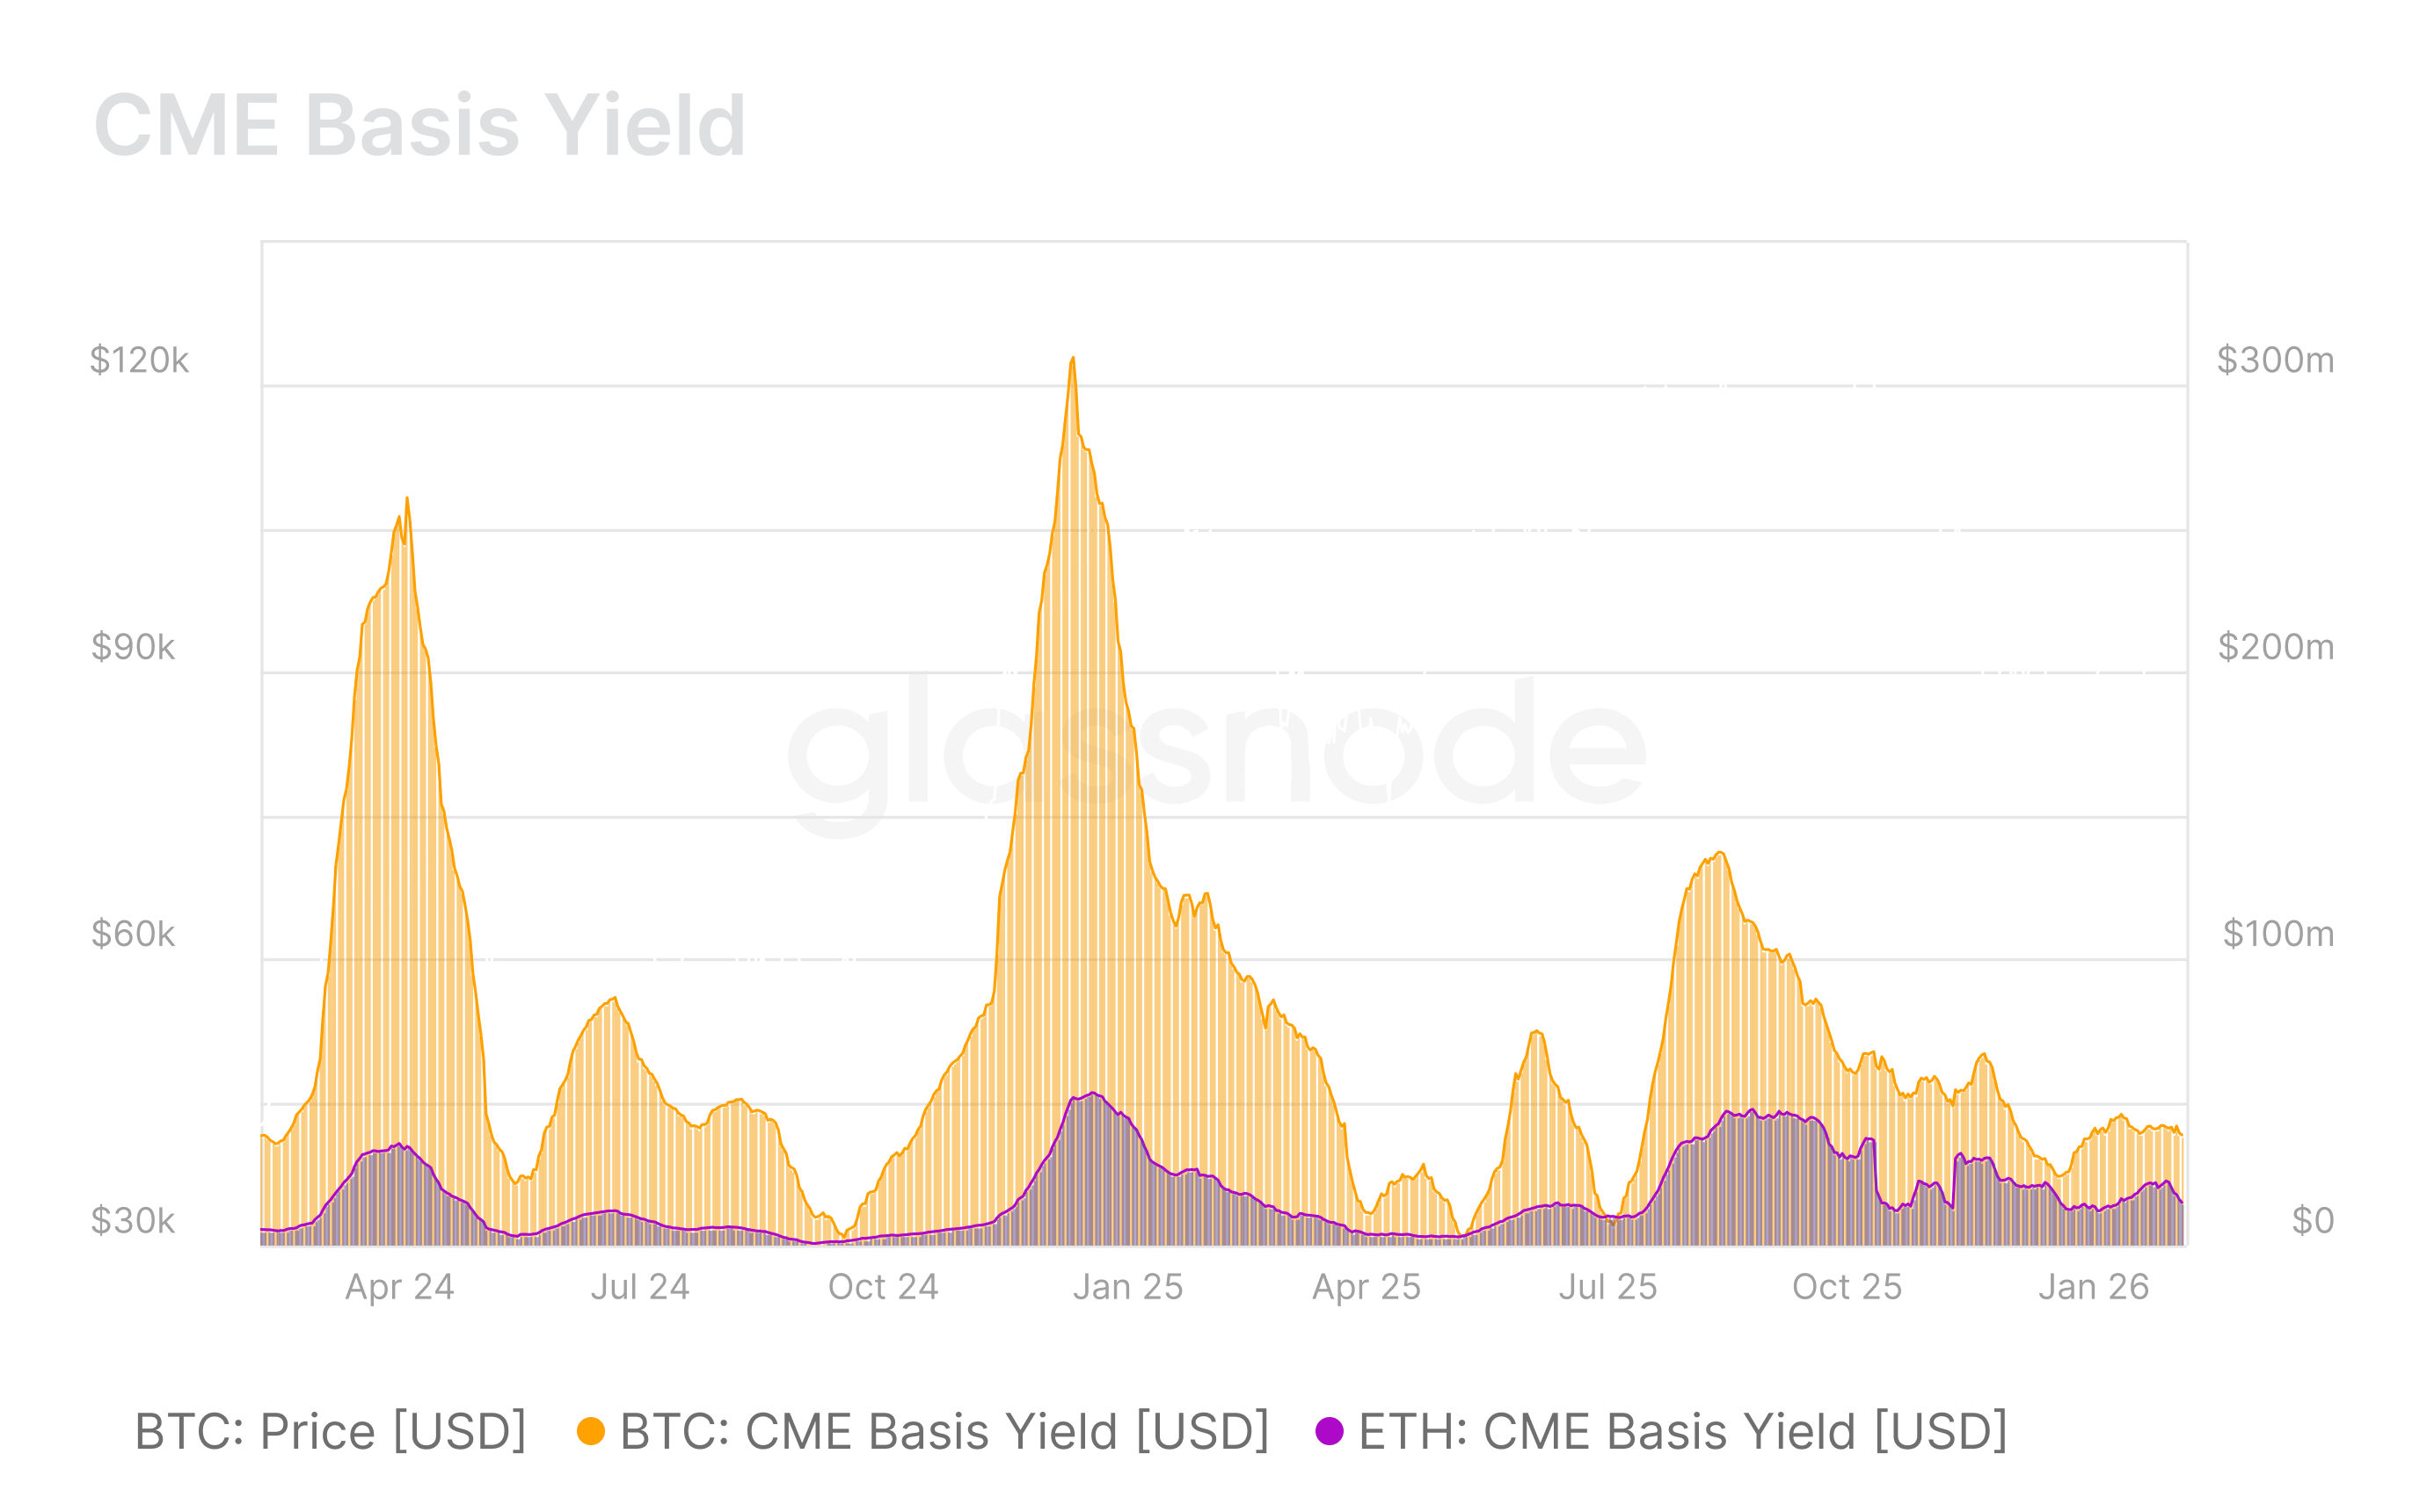
CME Basis Yield

CME Basis Yield compressed even further in February, reinforcing waning incentives for market-neutral strategies compared to January.

The monthly dollar value captured by institutions via cash-and-carry trades declined notably for both Bitcoin and Ethereum, building on the sharp compression seen since August 2025. This tightening basis reflects reduced leverage deployment, softer futures demand, and continued pullback in balance-sheet commitment amid tighter liquidity conditions persisting from January into early March 2026.


Disclaimer: This report does not provide any investment advice. All data is provided for information and educational purposes only. No investment decision shall be based on the information provided here and you are solely responsible for your own investment decisions.
Exchange balances presented are derived from Glassnode’s comprehensive database of address labels, which are amassed through both officially published exchange information and proprietary clustering algorithms. While we strive to ensure the utmost accuracy in representing exchange balances, it is important to note that these figures might not always encapsulate the entirety of an exchange’s reserves, particularly when exchanges refrain from disclosing their official addresses. We urge users to exercise caution and discretion when utilizing these metrics. Glassnode shall not be held responsible for any discrepancies or potential inaccuracies. Please read our Transparency Notice when using exchange data.

Domande pertinenti

QWhat is the primary purpose of the Strategy Watch publication?

AStrategy Watch was built to address a clear demand for high-signal, impartial analysis of fund-level performance and allocation trends in digital assets, aiming to be a must-read monthly publication for the digital asset investment community.

QWhich was the only strategy type that returned positively in February according to the report?

AThe report indicates that readers should check the 'Fund and SMA Performance' section to see the only strategy type that returned positively in February, though the specific strategy name is not stated in the provided text.

QWhat was the trend in capital flows for Bitcoin (BTC) and Ethereum (ETH) through February and into March?

ACapital flows into BTC and ETH remained deeply negative, with BTC and ETH capital flows registering -$9.6B and -$3.2B, respectively.

QHow did stablecoin capital flows behave in contrast to BTC and ETH in early March?

AStablecoins broke from the broader negative trend, flipping to +$6.2B in net inflows, which likely reflects a defensive repositioning into lower-risk, dollar-denominated on-chain instruments.

QWhat does the sharp compression in CME Basis Yield indicate about market conditions?

AThe compression in CME Basis Yield reflects reduced leverage deployment, softer futures demand, and a continued pullback in balance-sheet commitment amid tighter liquidity conditions, indicating waning incentives for market-neutral strategies.

Letture associate

Has Bitcoin Bottomed, or Is a 'Shakeout' Approaching? What's the Situation with XRP?

Cryptocurrency analytics platform Santiment shared key insights on Bitcoin and altcoin markets, highlighting significant signals from on-chain data. Analysis shows Bitcoin's 365-day MVRV ratio has fallen to -26%, indicating substantial losses for long-term holders, a level historically associated with market bottom formations and long-term buying opportunities. While short-term MVRV is near breakeven, suggesting no clear directional signal, the annual perspective points to a bottom before bullish cycles. On-chain data reveals divergent behavior: large wallets (10-10,000 BTC) have been accumulating, adding ~18,500 BTC in 10 days, while smaller retail investors continue buying dips. Analysts caution that high retail demand can sometimes create a risk of a final market shakeout or correction. The altcoin market shows a mixed picture. Ethereum's 365-day MVRV is around -33%, but recent monthly gains combined with overly optimistic social sentiment pose a short-term correction risk. XRP is in oversold territory with 30-day and 365-day MVRVs at -57.5% and -45.5% respectively, signaling potential for a strong mid-to-long term rebound. Social activity and optimism are rising for Solana, while investor sentiment remains calmer towards Cardano. Future direction for Bitcoin and altcoins depends not only on on-chain metrics but also on macroeconomic and regulatory developments. The Federal Reserve's interest rate decision and upcoming policy rulings are increasing market volatility expectations, while uncertainty around the U.S. Congressional clarity process continues to pressure pricing. *This is not investment advice.

cryptonews.ru10 min fa

Has Bitcoin Bottomed, or Is a 'Shakeout' Approaching? What's the Situation with XRP?

cryptonews.ru10 min fa

Bank of Korea Reveals Results of Tokenized Deposit Testing

The Bank of Korea has announced the results of its pilot test for tokenized deposits. Involving 28 central banks and international financial organizations, the project saw participation from major South Korean banks including KB Kookmin Bank, NH NongHyup Bank, Shinhan Bank, Woori Bank, and Hana Bank. Transactions, from payment orders to final settlement, were completed in real time, averaging just 80 seconds. The test involved 30 transactions across 17 different scenarios—such as corporate and interbank transfers—and was conducted in six currencies, including the Korean won, US dollar, and euro, with a total transaction value reaching approximately $995,000. The central bank reported that the platform operated stably throughout, despite being only partially connected to the existing banking infrastructure. Settlements using tokenized deposits were executed seamlessly, quickly, and transparently. An internal transfer of 20 million won (about $13,890) between NH NongHyup Bank and Shinhan Bank was also successfully processed via the Project Agora platform, which involved connecting to the Bank of Korea's CBDC test platform, Project Hangang. Additionally, KB Kookmin Bank and Japan's MUFG Bank tested cross-border payments using these deposit tokens—digital certificates issued by commercial banks within the pilot, not directly by the central bank. The Bank of Korea plans to continue testing payments with tokenized deposits. This follows last year's pledge by South Korean authorities to tighten regulations for won-based stablecoins, which will require approval from both the central bank and the Financial Services Commission.

cryptonews.ru2 h fa

Bank of Korea Reveals Results of Tokenized Deposit Testing

cryptonews.ru2 h fa

Trading

Spot
活动图片