Stellar [XLM] hits a critical $0.261 wall – Breakout or rejection ahead?

ambcryptoPubblicato 2026-01-07Pubblicato ultima volta 2026-01-07

Introduzione

Stellar (XLM) is showing early signs of renewed momentum after months of consolidation, with a 7% price increase testing the critical $0.261 resistance level. This supply zone has historically triggered rejections, but a breakout could signal a trend shift and end the consolidation phase. Derivative data supports a bullish outlook, with long positions significantly outweighing shorts, reflecting strong buyer dominance. Liquidity clusters above the current price level further support potential upward movement. A decisive break above $0.261 may lead to a sustained bullish run, while failure could result in increased volatility.

Stellar’s price action is starting to show early signals of renewed momentum after spending months locked inside a tight flag consolidation.

At the time of writing, the token was up 7%, moving price action closer to the upper boundary of the long-standing flag channel and restarting bullish expectations among investors.

While the broader structure remains intact for now, the recent bullish move hints at the growing buyers’ activity and dominance at current levels.

Key supply zone at $0.261 comes into sight

At the heart of XLM’s near-term structure lies a familiar obstacle. The token is now testing the $0.261 supply zone, a level that has repeatedly capped upside attempts in recent months.

Historically, this price level triggered several rejection moves, and the chances of the situation repeating can be excluded.

However, a breakout above $0.261 would not only nullify the short-term supply threat but may also foretell a short-term trend shift, making it possible to break out of the phase of consolidation.
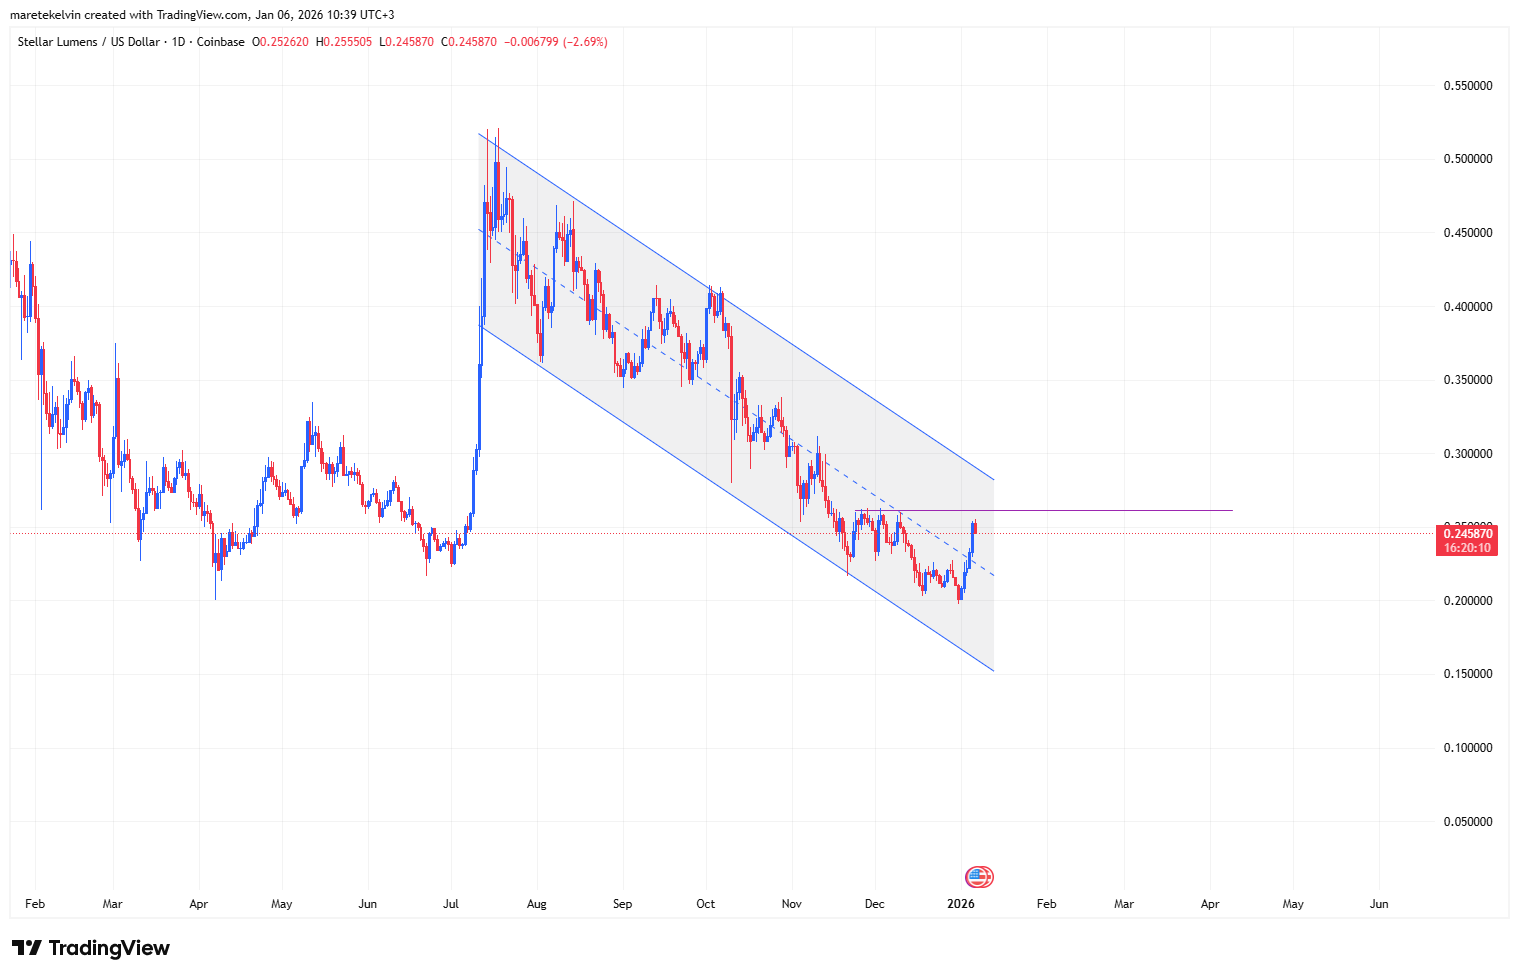
Source: TradingView

Market bias shifts

Stellar derivative data adds weight to the bullish narrative. At current prices, long positions are nearly tripling short positions.

In fact, at press time, the Long/Short Ratio stood at 2.769,  indicating a significant buyers’ dominance as position distribution tilts to the bulls’ favor.

Most XLM investors and traders are betting on further price surges. The resultant growing confidence from the imbalance could prolong the current momentum, more so if resistance gives way.

However, such positioning also raises the stakes. If price stalls at resistance, the market could see heightened volatility as leveraged traders adjust.
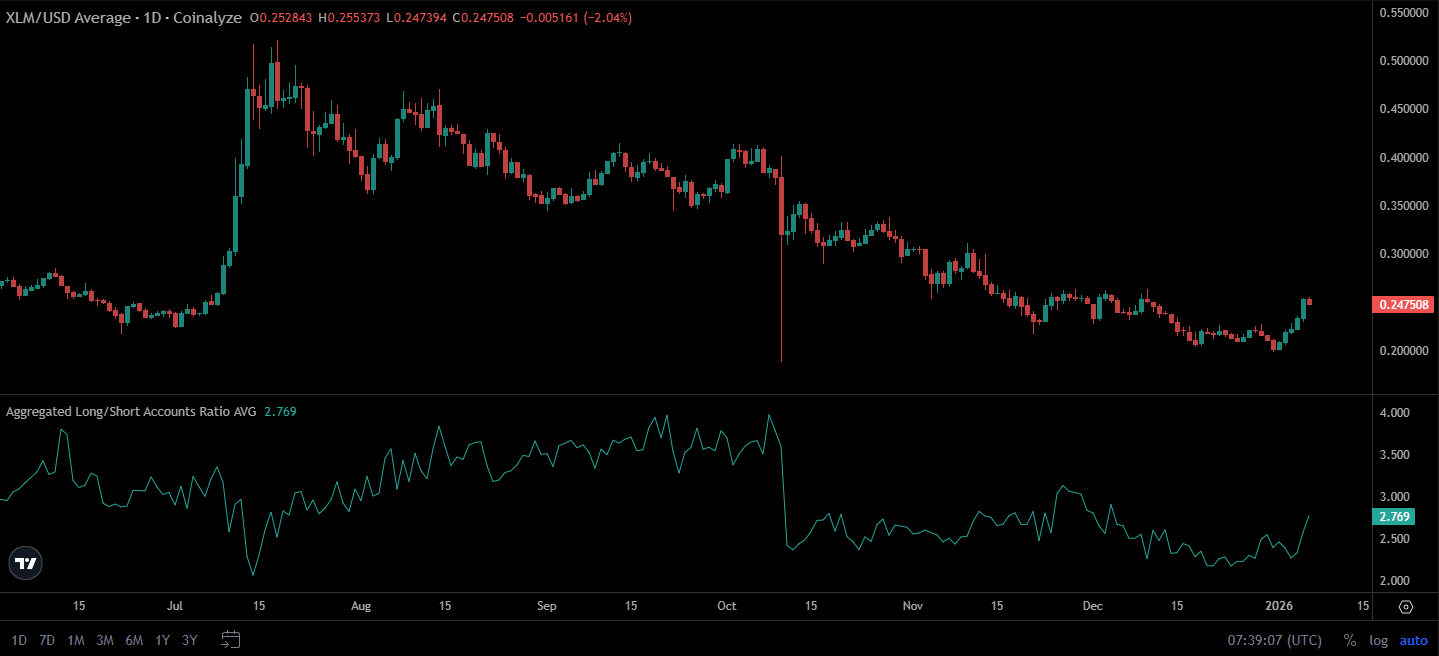
Source: Coinalyze

Potential momentum continuation?

Further supporting the breakout scenario, CoinGlass’s liquidity data revealed notable clusters sitting above the current trading range.

The 304.15K liquidity cluster at around 0.2683 affirmed the bullish bias, as traders logically aim at areas with higher stop and order concentration.
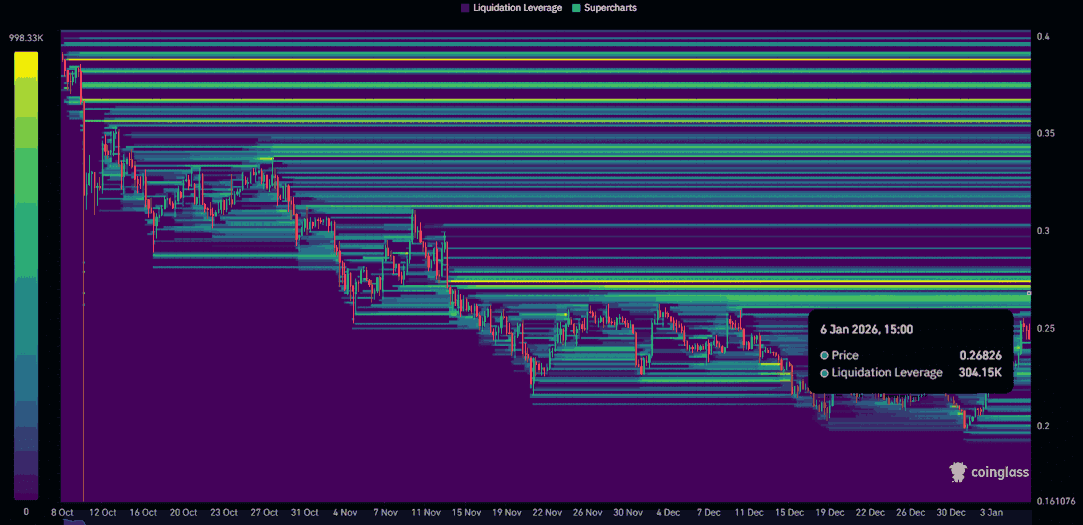
Source: CoinGlass

Cumulatively, the rising bullish positioning paired with proximity to key resistance and overhead liquidity suggests that XLM could be in for a more bullish run.

A decisive move past $0.261 resistance will be key in determining whether the token prices will surge further to mitigate the liquidity clusters above.


Final Thoughts

  • XLM is testing a critical $0.261 supply zone after a 7% daily surge.
  • Liquidity clusters above current price levels suggest that a breakout could trigger a further bullish run if resistance fails to hold.
Next: Bitmine’s $14B Ethereum empire – Is one company quietly taking over ETH?
Share
  • Share
  • Tweet

Domande pertinenti

QWhat is the critical resistance level that Stellar (XLM) is currently testing?

AThe critical resistance level that Stellar (XLM) is testing is $0.261.

QWhat does the Long/Short Ratio of 2.769 indicate about market sentiment?

AA Long/Short Ratio of 2.769 indicates significant buyer dominance, meaning long positions are nearly tripling short positions and showing that most traders are betting on further price increases.

QAccording to the article, what could a breakout above $0.261 potentially signal?

AA breakout above $0.261 could nullify the short-term supply threat and potentially signal a short-term trend shift, allowing the price to break out of its consolidation phase.

QWhat does the liquidity cluster at around $0.2683 suggest for price movement?

AThe liquidity cluster at around $0.2683 suggests a bullish bias, as traders often aim for areas with higher concentrations of stop orders and liquidity, which could attract further buying pressure.

QWhat are the two key factors mentioned in the 'Final Thoughts' that support a potential bullish run?

AThe two key factors are: 1) XLM is testing the critical $0.261 supply zone after a 7% daily surge, and 2) Liquidity clusters above current price levels suggest a breakout could trigger further bullish momentum if resistance is broken.

Letture associate

Trading

Spot
Futures

Articoli Popolari

Come comprare XLM

Benvenuto in HTX.com! Abbiamo reso l'acquisto di Stellar (XLM) semplice e conveniente. Segui la nostra guida passo passo per intraprendere il tuo viaggio nel mondo delle criptovalute.Step 1: Crea il tuo Account HTXUsa la tua email o numero di telefono per registrarti il tuo account gratuito su HTX. Vivi un'esperienza facile e sblocca tutte le funzionalità,Crea il mio accountStep 2: Vai in Acquista crypto e seleziona il tuo metodo di pagamentoCarta di credito/debito: utilizza la tua Visa o Mastercard per acquistare immediatamente StellarXLM.Bilancio: Usa i fondi dal bilancio del tuo account HTX per fare trading senza problemi.Terze parti: abbiamo aggiunto metodi di pagamento molto utilizzati come Google Pay e Apple Pay per maggiore comodità.P2P: Fai trading direttamente con altri utenti HTX.Over-the-Counter (OTC): Offriamo servizi su misura e tassi di cambio competitivi per i trader.Step 3: Conserva Stellar (XLM)Dopo aver acquistato Stellar (XLM), conserva nel tuo account HTX. In alternativa, puoi inviare tramite trasferimento blockchain o scambiare per altre criptovalute.Step 4: Scambia Stellar (XLM)Scambia facilmente Stellar (XLM) nel mercato spot di HTX. Accedi al tuo account, seleziona la tua coppia di trading, esegui le tue operazioni e monitora in tempo reale. Offriamo un'esperienza user-friendly sia per chi ha appena iniziato che per i trader più esperti.

224 Totale visualizzazioniPubblicato il 2024.12.13Aggiornato il 2025.03.21

Come comprare XLM

Discussioni

Benvenuto nella Community HTX. Qui puoi rimanere informato sugli ultimi sviluppi della piattaforma e accedere ad approfondimenti esperti sul mercato. Le opinioni degli utenti sul prezzo di XLM XLM sono presentate come di seguito.

活动图片