Range Judgment Realized, Strategy Fully Executed | Guest Analysis

marsbitPubblicato 2026-01-09Pubblicato ultima volta 2026-01-09

Introduzione

In his weekly analysis, Cody Feng, a quantitative trading expert, reviews Bitcoin's price action from January 5 to 11. BTC movement aligned closely with his initial forecast, trading within a range of $84,000 to $94,500. The price faced strong resistance at the $93,000–$94,500 zone and later pulled back toward the mid-to-lower part of the range. A short position was executed near $94,000 based on signals from momentum and spread trading models, and the trade was closed around $90,584, capturing a profit of approximately 3.4%. The strategy emphasized pre-planned execution and disciplined risk management. Currently, Bitcoin has found support around $86,500, with technical indicators suggesting oversold conditions and a potential bounce. However, the overall structure remains a broad consolidation. A rebound toward $92,000–$93,000 is anticipated, where renewed selling pressure may emerge. A break above $94,500 would require a reassessment of the market outlook. Feng concludes that in a ranging market, executing well-defined strategies with strict risk controls is more critical than predicting directional moves.

Odaily guest market analyst Cody Feng, Master of Financial Statistics from Columbia University, has focused on quantitative trading of US stocks since college and gradually expanded to digital assets such as Bitcoin. He has built a systematic quantitative trading model and risk control system through practical experience; possesses keen data insight into market fluctuations, and is committed to continuous growth in the professional trading field, pursuing stable returns. He will delve into BTC technical, macroeconomic, and capital flow changes weekly, review and showcase practical strategies, and preview noteworthy upcoming developments for reference.
Bitcoin Mid-Week Review(01.05~01.11)

Conclusion First:

This week, Bitcoin's overall price action largely operated within the 84,000~94,500 USD oscillation range we provided at the beginning of the week. The price precisely encountered resistance in the 93,000~94,500 USD pressure zone and subsequently fell back to the middle-lower part of the range. Our core level judgments were verified by actual market performance.

In this trade, we established short positions near 94,000 USD and exited all positions near 91,000 USD, capturing approximately 3.4% profit (spot) from the range, completing a high-probability, low-drawdown profit realization in a ranging market.

I. Validation of This Week's Core Range and Key Levels

At the beginning of the week, we clearly stated that this week required close attention to the battle between bulls and bears at the upper and lower boundaries of the 84,000~94,500 USD range.

The actual movement showed that Bitcoin clearly met resistance after rebounding to the 93,000~94,500 USD pressure zone, with multiple failed attempts to break higher, subsequently leading to a pullback under pressure, validating the effectiveness of this area as a阶段性 "ceiling".

Regarding support levels, the price showed clear signs of stopping declines and stabilizing after falling to the 86,000~86,500 USD area, where buying interest began to emerge. The more critical support level at 84,000 USD has not been touched yet, and the overall structure remains within the wide-range oscillation framework.

II. Execution of Plan A (From Entry to Exit)

Based on the range oscillation judgment, our Plan A formulated at the start of the week was effectively executed.

When the price rebounded to the 93,000~94,500 USD zone showing signs of upward exhaustion, and both the (momentum, spread trading) models simultaneously issued top signals, we immediately established short positions at 93,771 USD. The market subsequently declined as expected.

When the "Spread Trading" model issued a bottom signal, we finally exited all positions at 90,584 USD, completing a full, emotion-free short trade. The entire trading process was not "hindsight analysis" but involved pre-planning, in-execution, and post-verification.

III. Operational Thoughts for the Latter Half of the Week

Bitcoin 4-Hour Chart: (Momentum Quantitative Model + Spread Trading Model)
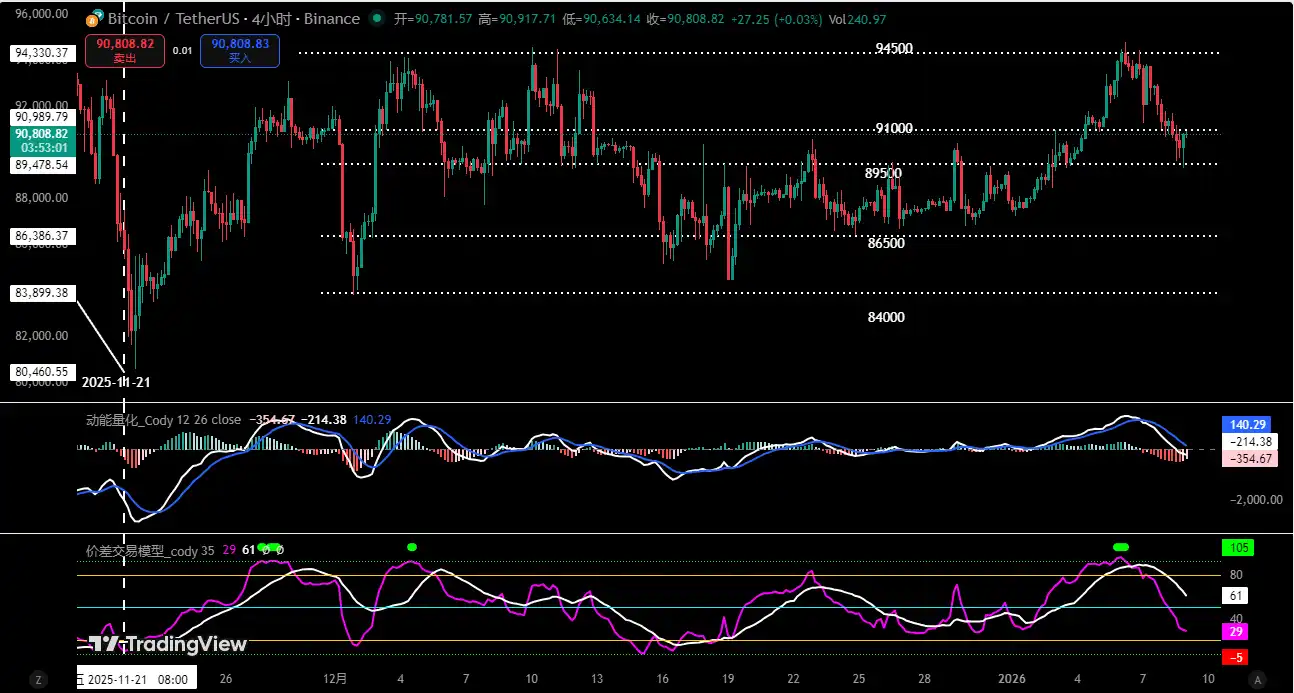
From the 4-hour technical structure (see chart above), Bitcoin has currently found effective support near 86,500 USD. Multiple technical indicators have entered oversold territory, indicating short-term selling pressure has been released. The market has a demand for a technical rebound correction (oscillatory rebound), but this is not yet sufficient to confirm a reversal of the downtrend.

Based on this, we anticipate the price may first rebound to test the 92,000~93,000 USD area. This level also coincides with the middle-upper part of the previous oscillation range and is expected to form resistance again.

For short-term operations, maintain a range-trading mindset: if the price reaches this zone and shows signs of momentum exhaustion or failed breakouts, consider building short positions on rallies; if it effectively breaks above 94,500 USD, stop loss decisively and reassess the market structure.

IV. Summary

Overall, Bitcoin continues to operate within the wide-range oscillation pattern defined at the beginning of the week: lower support provides room for rebounds, while upper resistance limits the upside. At present, rather than betting on a unilateral trend, it is more important to respect the range structure, focus on high-probability levels, and maintain strict risk control.

In ranging markets, formulating flexible response strategies and achieving stable profits is far more important than predicting direction.

Disclaimer: The above content is solely personal market opinion sharing and does not constitute any investment advice. Cryptocurrencies are highly volatile; please make independent judgments and strictly control risks.


Domande pertinenti

QWhat was the price range for Bitcoin's consolidation as predicted by analyst Cody Feng at the beginning of the week?

AThe predicted consolidation range for Bitcoin was between $84,000 and $94,500.

QAt what price level did the analyst establish a short position and what was the profit from this trade?

AA short position was established near $94,000 and closed near $91,000, capturing a profit of approximately 3.4%.

QWhat are the two technical models mentioned that provided signals for the trade execution?

AThe two technical models mentioned are the Momentum Quant Model and the Spread Trading Model.

QAccording to the 4-hour chart analysis, what is the expected next move for Bitcoin's price and the key resistance area to watch?

AA technical rebound or震荡反弹 (oscillatory rebound) is expected to test the $92,000 to $93,000 area.

QWhat is the overarching trading philosophy emphasized for the current market conditions described in the article?

AThe philosophy is to focus on high-probability price points and strict risk control within the range-bound structure, rather than betting on a one-directional trend, as formulating flexible strategies for stable profits is more important than predicting direction.

Letture associate

Cyclical Stock or Growth Stock? Coinbase's Q2 Earnings Report Reveals 'Valuation Disagreement'

Coinbase's Q2 2026 financial results revealed a mixed performance, reigniting debate over whether the company should be valued as a cyclical stock tied to crypto markets or a growth stock with future potential. Total revenue missed expectations at $1.22 billion, down 19% year-over-year. Transaction revenue fell to $599 million, with retail crypto spot trading revenue dropping 30% to $452 million, back to 2023 levels. The company reported a net loss of $359 million, marking its third consecutive quarterly loss. Despite CEO Brian Armstrong's positive commentary on metrics like a 10.3% overall crypto trading market share and 106% growth in prediction markets, the market reacted negatively, with shares dropping over 5% after-hours. A key issue is the decline in core retail trading. While Coinbase touted record market share, this figure includes derivatives and new products. Its traditional crypto spot trading share is likely shrinking. New ventures like prediction markets, while growing, contributed less than $30 million, insufficient to offset the core revenue decline. The valuation debate hinges on perspective. As a cyclical stock, Coinbase remains deeply tied to the crypto bear market, with user attrition and competitive pressures justifying a lower valuation. The company's strategy appears focused on surviving until the next bull cycle. Viewed as a growth stock, however, Coinbase shows promising diversification. Subscription and service revenue reached $555 million, nearly matching transaction revenue. Stablecoin revenue, its second-largest source at $292 million, remains strong through its partnership with Circle. Critically, Coinbase is positioning itself as a leader in the emerging on-chain "agent economy." Over 90% of agent-based stablecoin transactions occur on its Base network, which it believes could handle trillions in future agent transactions. The recent acquisition of Deribit also aims to boost its international derivatives offering. In summary, Coinbase's present struggles are clear, but its future hinges on whether its investments in revenue diversification, stablecoins, and the agent economy can ultimately transform its business model and justify a growth premium.

Odaily星球日报5 min fa

Cyclical Stock or Growth Stock? Coinbase's Q2 Earnings Report Reveals 'Valuation Disagreement'

Odaily星球日报5 min fa

Global Market Share Survey: Japanese Firms Lead in Semiconductor Materials

Global Market Share Survey: Japanese Firms Lead in Semiconductor Materials According to the 2025 "Major Goods and Services Market Share Survey" by Nikkei, Japanese companies maintain strong positions in semiconductor-related materials. In silicon wafers, Shin-Etsu Chemical ranks first with a 26.3% share, followed by SUMCO at 17.8%. Together, they hold 44.1% of the market, widening their lead over competitors from Taiwan, Germany, and South Korea. In photoresists, Tokyo Ohka Kogyo, JSR, and Shin-Etsu Chemical occupy the top three spots, with a combined share of 60.5%. Despite their strength in materials, Japanese firms have a weaker presence in core semiconductor segments like DRAM and NAND flash memory, where South Korean and U.S. companies dominate. For instance, SK Hynix and Samsung lead in DRAM, while China’s CXMT doubled its share to 6% in 2025. The semiconductor market is projected to grow rapidly, with WSTS forecasting a 90% increase to $1.5112 trillion by 2026. Major players like Samsung, SK Hynix, and Micron are making massive investments to expand capacity. To maintain their edge in materials, Japanese companies must similarly commit to large-scale, risk-taking investments. In contrast, Japan’s automotive sector shows stagnation. Toyota remains the global leader but with only a slight share increase to 12.3%, while Japanese brands are absent from the top five in the EV market. In shipbuilding, Imabari Shipbuilding rose to third place globally with a 7.2% share, benefiting from large container ship deliveries. However, Chinese and South Korean firms dominate the sector, holding the top two positions. Japan aims to revitalize its shipbuilding industry through government and corporate efforts, targeting a near doubling of output by 2035. Addressing labor shortages and adopting advanced technologies like physical AI will be critical for competitiveness.

marsbit30 min fa

Global Market Share Survey: Japanese Firms Lead in Semiconductor Materials

marsbit30 min fa

STRC Major De-pegging's First Financial Report, How Will Strategy Repair Its Capital Flywheel?

Bitcoin treasury company Strategy released its Q2 2026 earnings report on July 31. Despite a 6.9% year-over-year revenue increase to $122 million, the company recorded a net loss of $8.22 billion, largely due to $8.32 billion in unrealized losses from Bitcoin price fluctuations. As of quarter-end, Strategy holds 843,775 BTC with an average cost of $75,000 per coin, and Bitcoin per share increased. The report highlights a critical shift in Strategy's capital model following the de-pegging of its key financing tool, STRC (Strategic Coin), which fell below its $100 target. Management's top priority is restoring STRC to its target value, aiming for a recovery by September 8. They rule out discounted STRC issuances and plan to maintain its dividend yield at 12%, instead focusing on bolstering its $3.75 billion cash reserve. Strategy has moved from a one-way "buy-and-hold" Bitcoin strategy to active capital management. This new approach, part of its "Digital Credit Capital Framework," involves flexibly managing its balance sheet across four elements: BTC, USD cash, common stock (MSTR), and digital credit securities like STRC. This allows for BTC monetization (having sold $218.4 million in BTC so far), strategic repurchases of discounted securities, and debt optimization, as seen with a $1.5 billion convertible bond buyback. The company's future hinges on two key tests: successfully re-pegging STRC to restore market confidence in its digital credit system, and a long-term recovery in Bitcoin's price to ultimately support its growth thesis.

marsbit1 h fa

STRC Major De-pegging's First Financial Report, How Will Strategy Repair Its Capital Flywheel?

marsbit1 h fa

Trading

Spot
活动图片