In a recent research report titled 'Classic Summer Lull,' K33 Research Head Vetle Lunde singled out blockchain transfers as a bright exception on an otherwise sleepy summer market. Trading volumes, price fluctuations, open interest, and exchange-traded fund (ETF) flows remained subdued, yet approximately 890,000 $BTC changed hands over seven days — the highest seven-day active supply figure recorded in 2026.
Active supply measures the volume of bitcoin that has moved over a certain period, making it a useful indicator of how many coins have suddenly returned to circulation. Lunde explained that the acceleration was "very likely caused by the attacks on Coldcard." K33 estimates that at the time of the report's preparation, about 1,596 $BTC had been stolen from roughly 7,300 addresses. The company characterized the overall response as a "panic, noticeable on the blockchain" — an accurate description of a market where the price looks calm while wallet owners hustle behind the scenes.
In his analysis, Lunde also noted that this week's Coldcard attack was:
the single $BTC metric signaling tumultuous activity.
The incident is related to a firmware vulnerability that appeared in Coinkite's Coldcard hardware wallets in March 2021. This vulnerability allowed the generation of wallet seeds — the secret phrases controlling a user's bitcoin — with insufficient randomness. Attackers were then able to recover predictable private keys offline and remotely drain single-signature addresses without physical access to the devices.
Starting July 30th, coordinated attacks siphoned roughly 1,600 $BTC worth over $100 million from thousands of addresses. A possible fourth wave increased the total to nearly 2,000 $BTC. Coinkite issued emergency firmware updates and urged vulnerable users to move their funds, although updating the device cannot fix a seed phrase that was already generated with insufficient randomness. Affected owners must create a new secure wallet and transfer their coins before an attacker reaches them.
Volume of Coins in Circulation Nearly Doubles, but Price Doesn't Rise
Data collected by Bitcoin.com News based on on-chain analytics from Newhedge.io shows just how sharply coin movement began. Bitcoin's 'Hot Supply,' which measures the number of coins that were in active circulation over the previous seven days, increased from 403,101.95 $BTC on July 28th to 797,407.72 $BTC on August 4th. This gain of approximately 394,306 $BTC represents a 98% jump in one week.
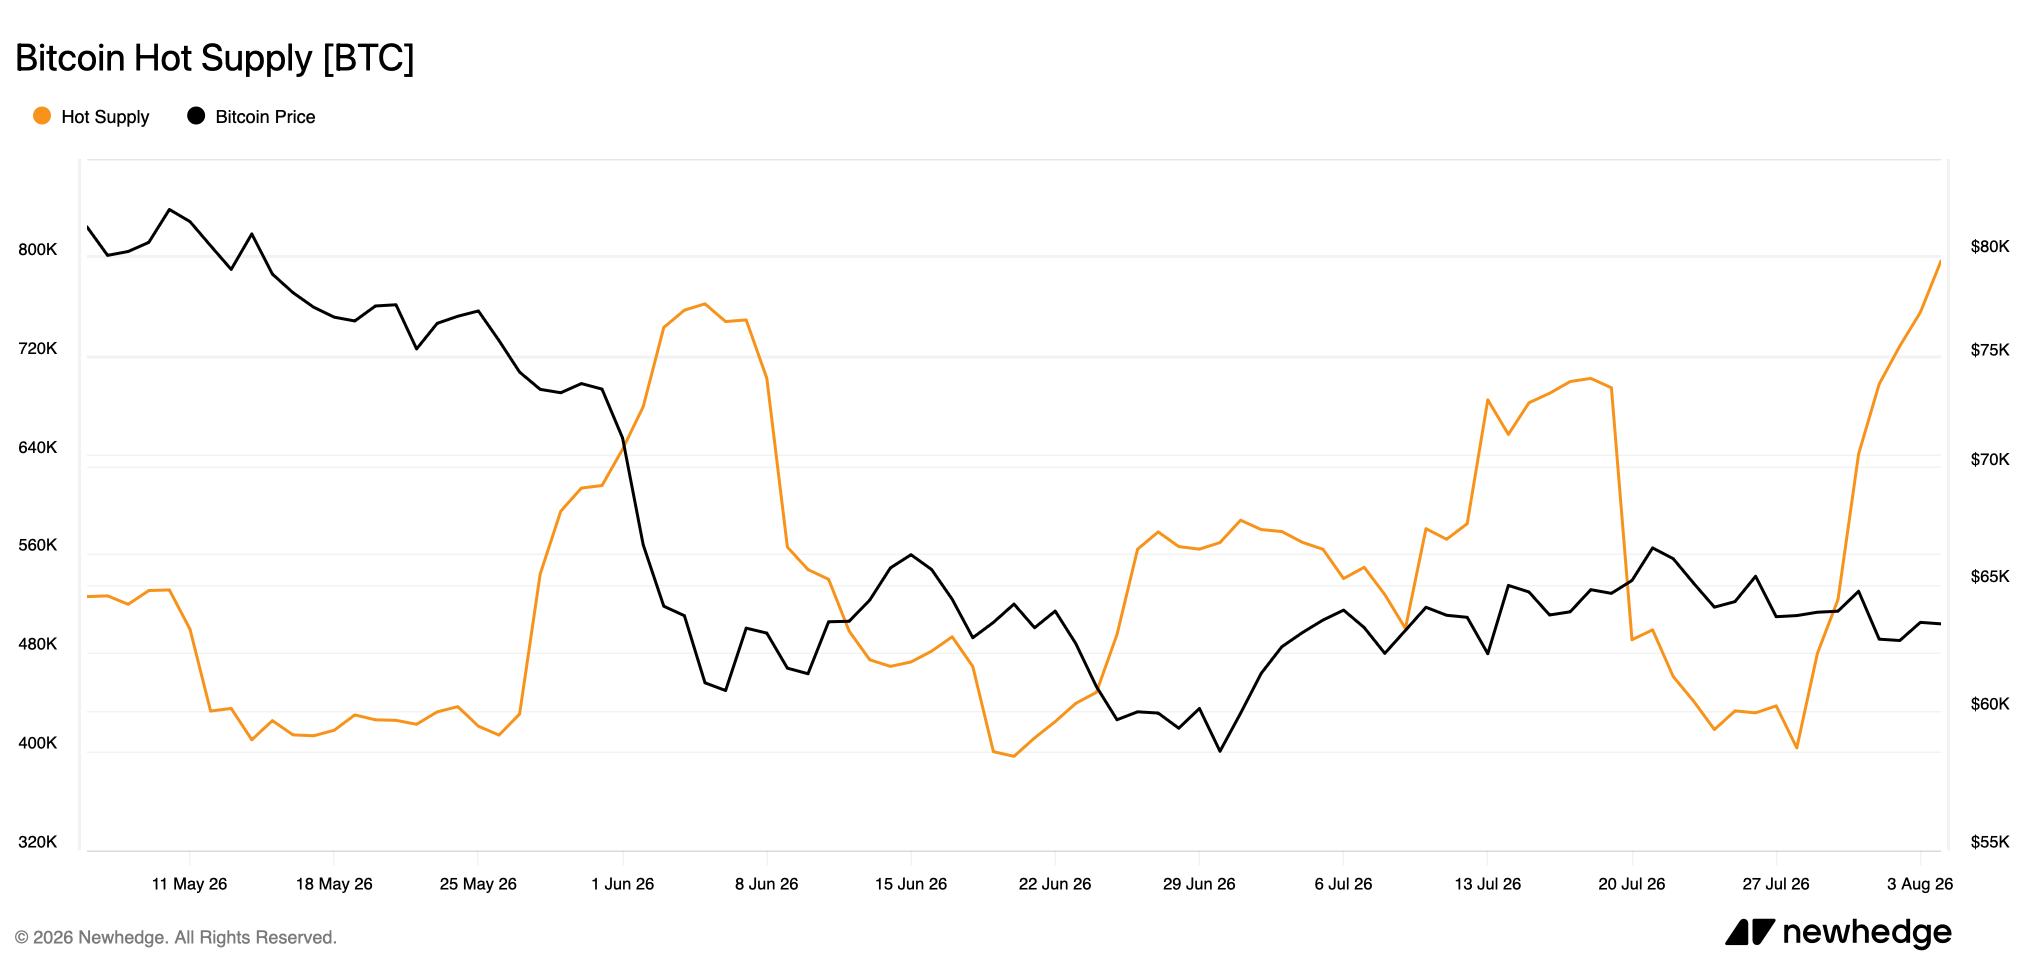
The price, however, told a completely different story. Over the same period, bitcoin declined from $64,000 to the lower end of the $63,000 range, corresponding to a drop of about 0.5%. Today, $BTC is once again above $64,000, up a modest 0.5% in the last 24 hours. This discrepancy indicates that the heightened activity was not merely the result of enthusiastic buyers entering the market. It also reflected mass withdrawals due to thefts, movement of funds to defensive wallets, internal transfers, and holders preparing coins for potential sale.
K33 noted that bitcoin was trading within its narrowest 30-day high-low range since 2023, with realized volatility also at low levels. Nevertheless, the seven-day active supply entered the top 10% of values measured based on a rolling 365-day history. Similar spikes have been observed near both local market highs and lows in previous cycles, meaning this signal indicates significant stress and position reshuffling, not a guaranteed direction of movement.
Part of this reshuffling appears to be directed toward centralized custodians. In a post on X, Sani from Timechainindex.com reported that crypto "exchanges received 22,052 $BTC net since the Coldcard hack on Friday." Owners may be using exchanges as a temporary safe haven while replacing vulnerable wallets, although significant inflows to exchanges could also increase potential selling pressure if coins remain on trading platforms.
Bitcoin Transfer Volume Remains High for Two Weeks
Daily transaction statistics from Blockchair.com, analyzed by Bitcoin.com News, show that over two full weeks from July 22nd to August 4th, the network processed 9.28 million transactions, averaging about 662,577 transactions per day. The daily average rose from 650,417 in the first week to 674,738 in the second, corresponding to a 3.7% increase.
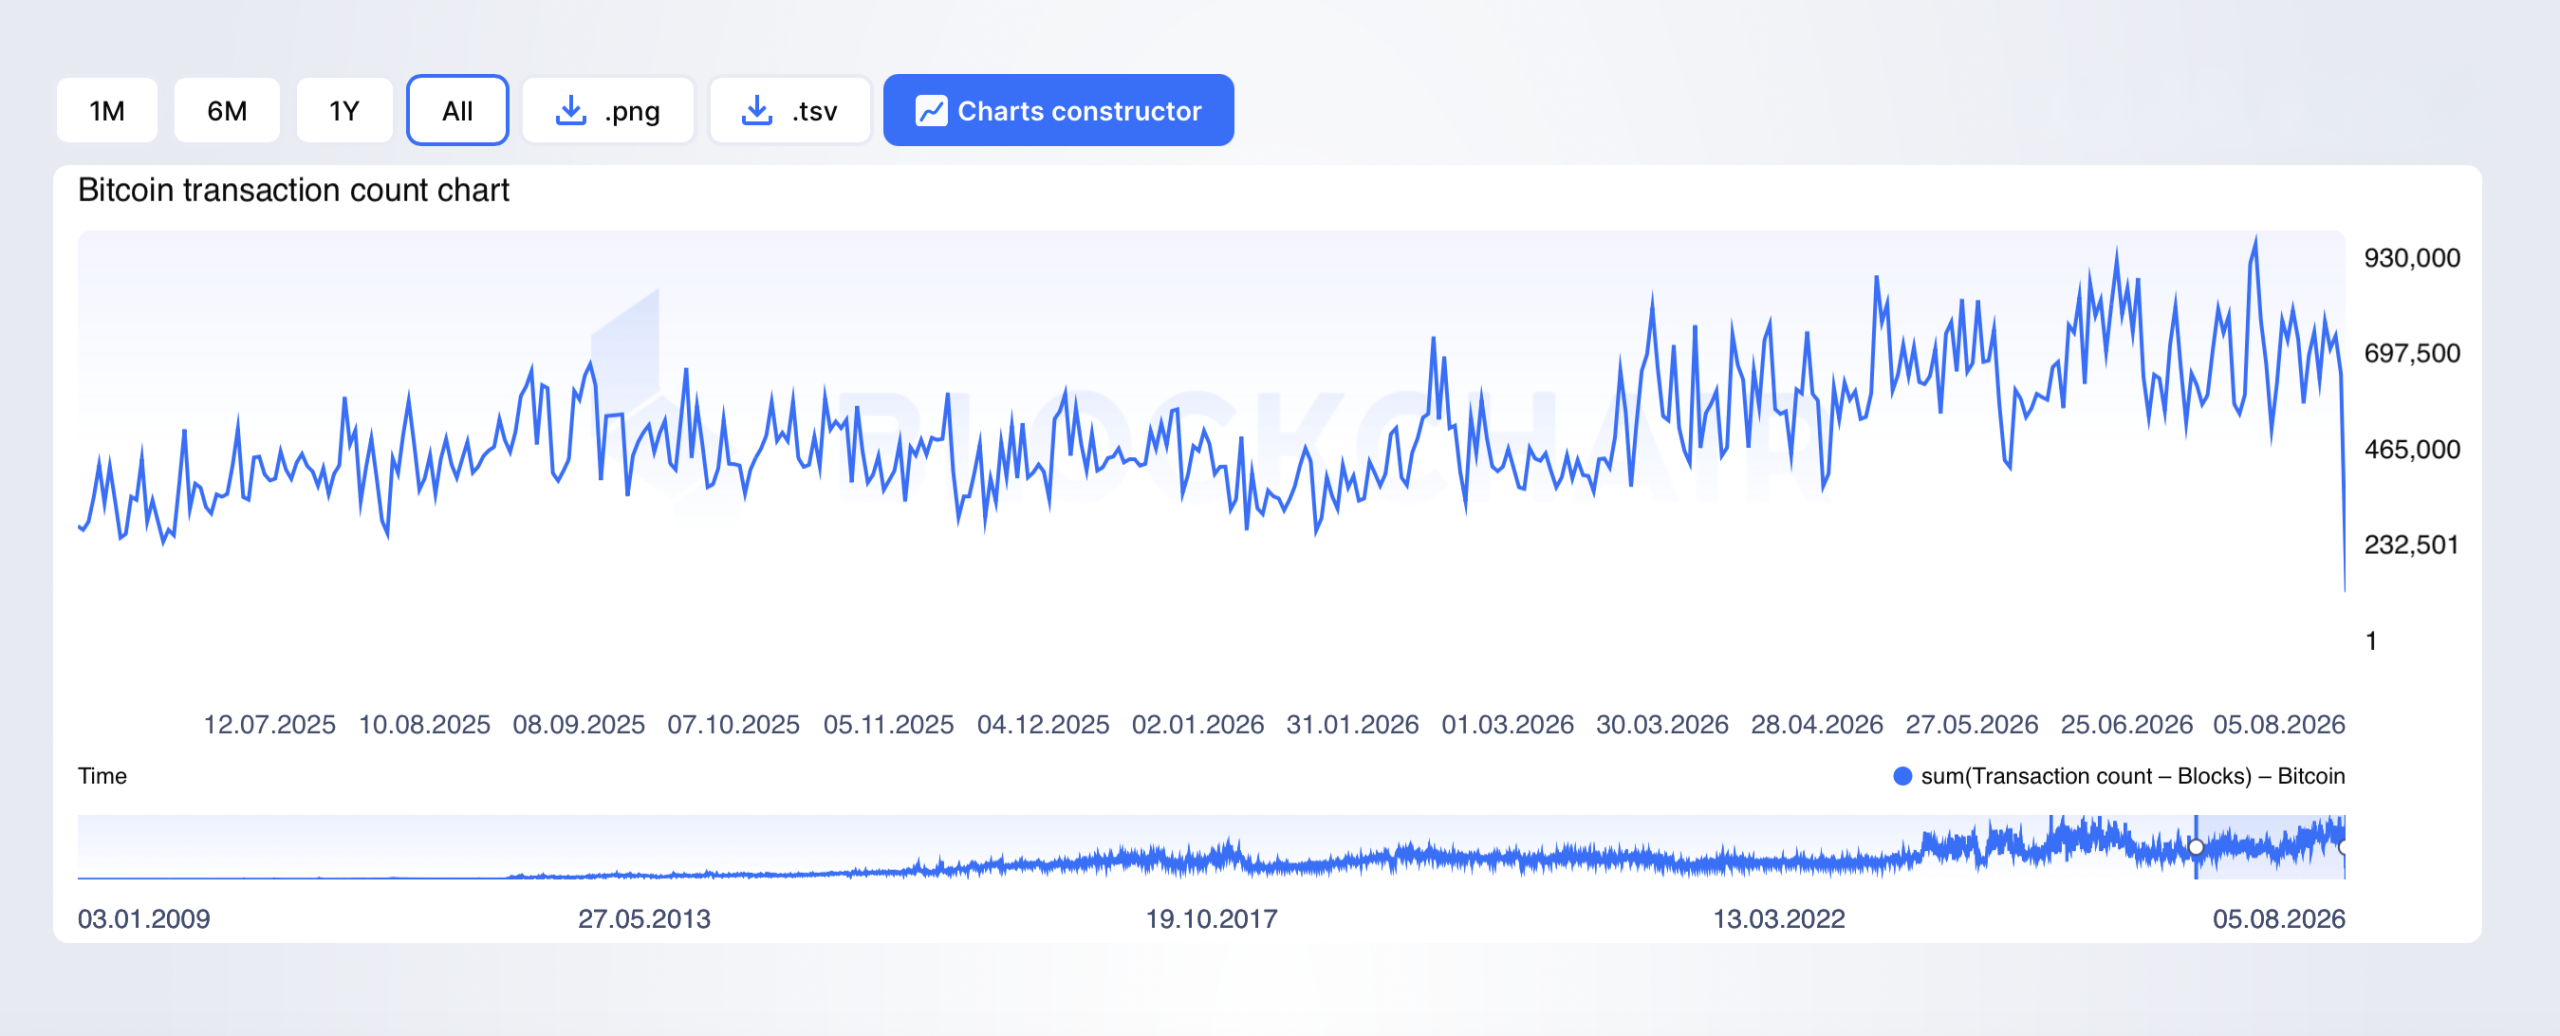
July 26th was the busiest day during this two-week period, with 758,094 transactions recorded, followed by July 24th with 736,287 transactions and August 1st with 734,264 transactions. Daily activity remained above 600,000 transactions on 11 out of 14 days, indicating stable network usage rather than a one-off activity spike.
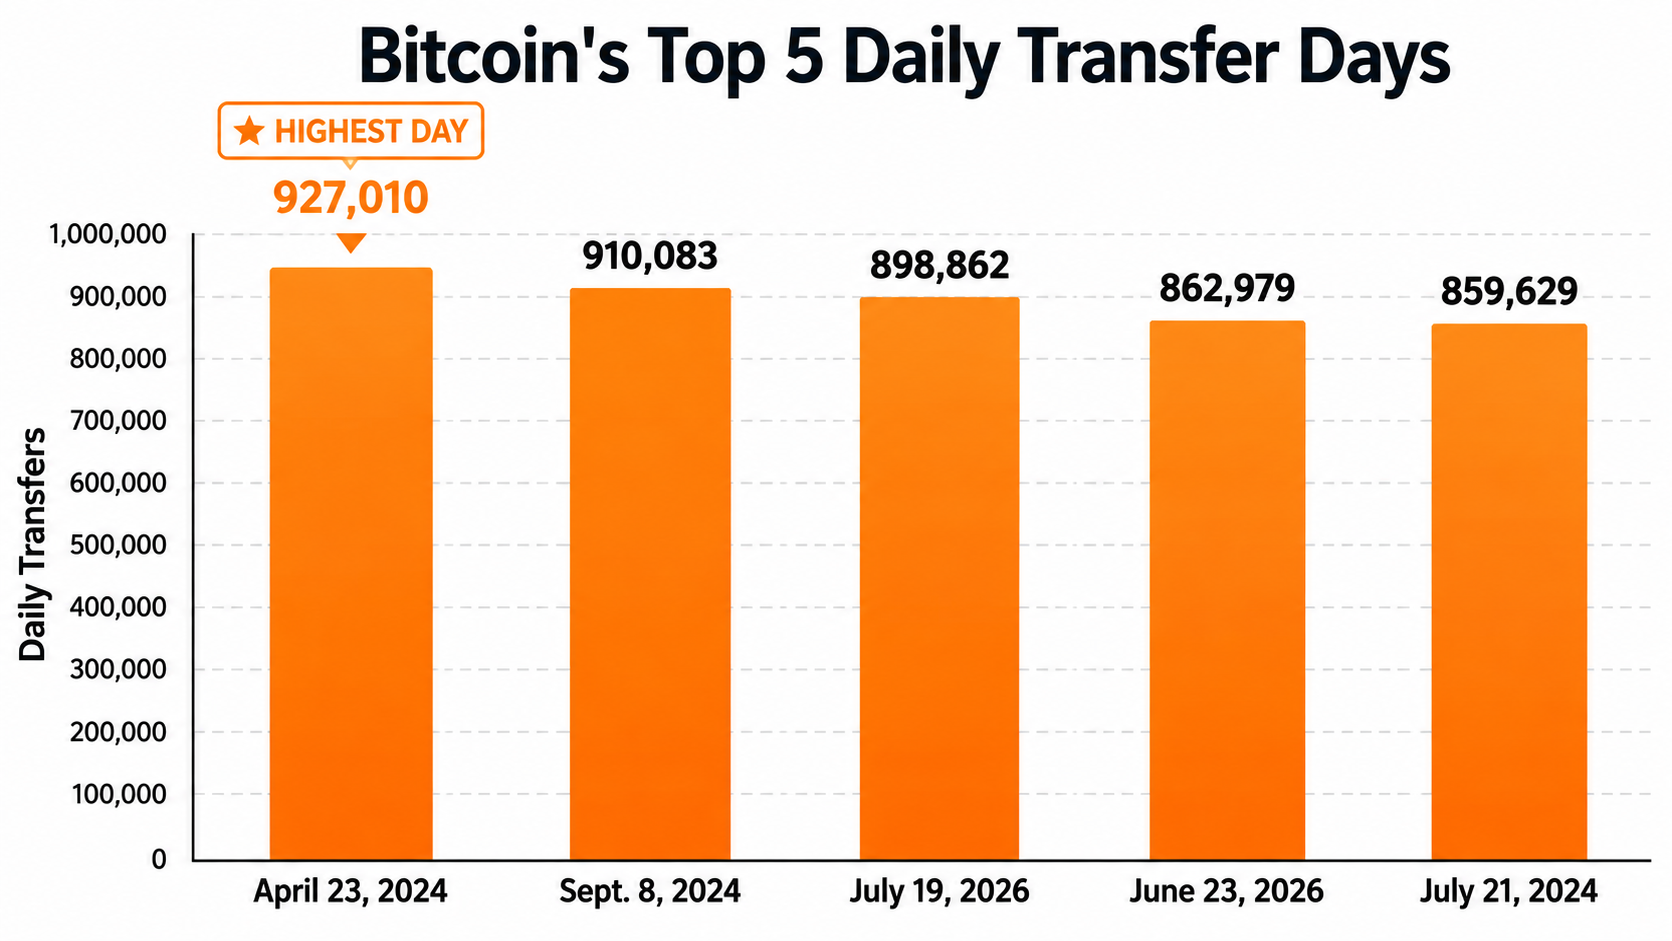
The data also shows that just before last week's discovered Coldcard vulnerability, July 19th set an all-time record for transactions. That figure of 898,862 transactions ranked third after April 23, 2024 (927,010) and September 8, 2024 (910,083). Fourth place went to June 23, 2026, with 862,979, followed by July 21, 2024, with 859,629 transactions. However, the fact that bitcoin recorded its third-busiest day less than two weeks before the Coldcard vulnerability indicates that network activity was already high before the emergency wallet migration began.
Awakening of Inactive Wallets Amid Holder Asset Redistribution
Data from Btcparser.com, reflecting the 'awakening' of old bitcoins and analyzed by Bitcoin.com News, showed that a total of 39 inactive addresses transferred a combined 1,486.09044782 $BTC, worth over $95 million, between July 30th and the last entry on August 5th. One old address created in 2010 transferred 50 $BTC at once. Two addresses from 2011 transferred 125.00004374 $BTC, five addresses from 2013 transferred 620.00100547 $BTC, and five addresses from 2014 transferred 285.51923857 $BTC.
The remaining transfers included 19.0395 $BTC from two addresses created in 2015, 102.19357827 $BTC from 10 addresses created in 2016, and 284.33708177 $BTC from 14 addresses created in 2017. The 2017 address group conducted the largest number of individual transfers, yet the 2013 wallets accounted for the largest amount of bitcoin, primarily because one address transferred 500 $BTC on August 3rd. Two wallets from 2011 contributed just over 125 $BTC, while the 2014 total slightly exceeded the amount transferred by the more active 2017 group.
Not every inactive transfer can be linked to the Coldcard firmware vulnerability, and blockchain data does not prove every owner was reacting to the attack. However, the timing coincidence adds another layer to the broader picture, which includes stolen coins, emergency migrations, rising exchange balances, and the nearly doubled recently active supply. The next clues will revolve around whether the withdrawal of stolen bitcoins continues, the direction of exchange inflows changes, and whether the spike in active supply can finally break $BTC out of its unusually narrow price range.
end-content