Author: Coingecko
Compiled by: Felix, PANews
After a turbulent end to 2025, Bitcoin continued to fluctuate and decline in early 2026. Meanwhile, geopolitical and macroeconomic events have driven up the prices of gold, silver, and recently, crude oil. As cryptocurrencies continue to gain mainstream acceptance as an asset class, many Wall Street investors may be experiencing their first crypto bear market. Coingecko examines the performance of cryptocurrencies relative to other traditional asset classes at the beginning of 2026.
With the outbreak of war in Iran, crude oil prices have surged faster than all other asset classes in 2026.
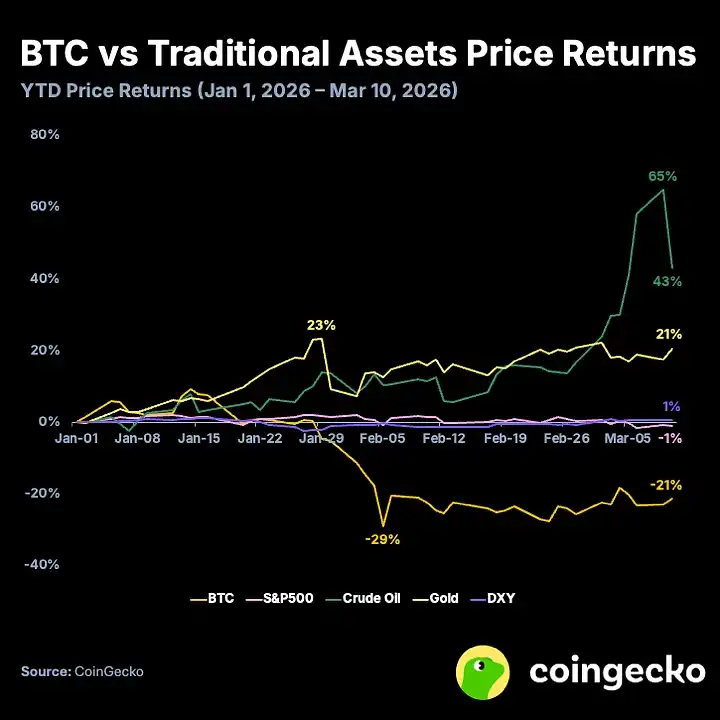
Since the beginning of 2026, crude oil prices have been rising slowly due to escalating tensions in the Middle East and supply shortages in key markets. However, the situation reached a peak with the latest attacks on Iran by the United States and Israel on February 28. Crude oil prices reached a high of $119.48 during intraday trading, compared to a price of just $57.41 at the start of the year.
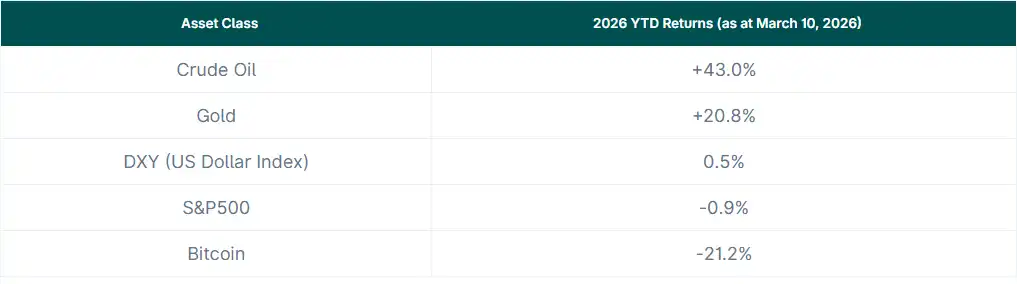
Meanwhile, Bitcoin's price continued to decline in 2026, making it the worst-performing asset class so far. However, since early March, Bitcoin appears to have found support between $65,000 and $75,000, after hitting a low of $62,800 in early February. U.S. spot Bitcoin ETFs have seen strong inflows since the end of February (net inflows of $1.9 billion since February 20, but still outflows of $828.9 million year-to-date), while Strategy has maintained its consistent buying pace, investing $5.6 billion since the beginning of the year.
Year-to-date in 2026, cryptocurrencies have shown only moderate correlation with the S&P 500 and gold, perhaps a signal that the asset class is finally beginning to "decouple."
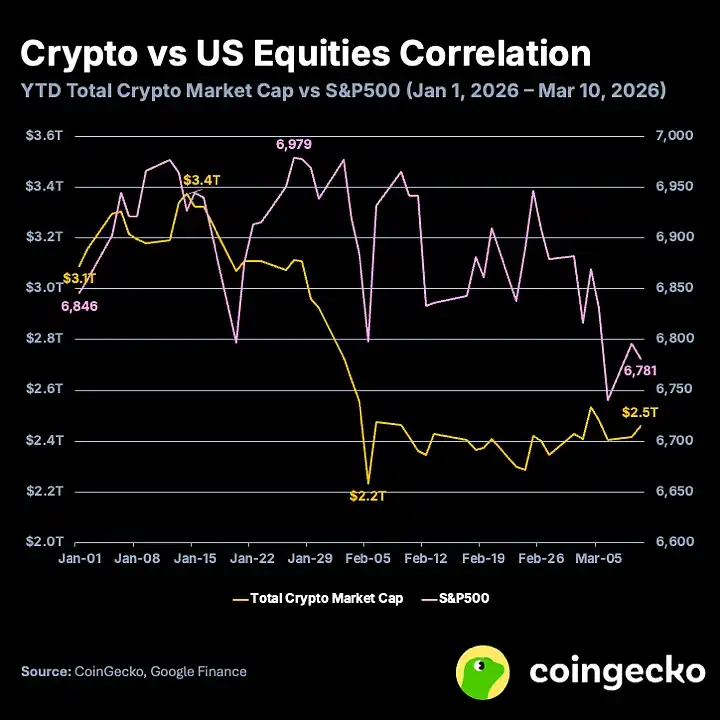
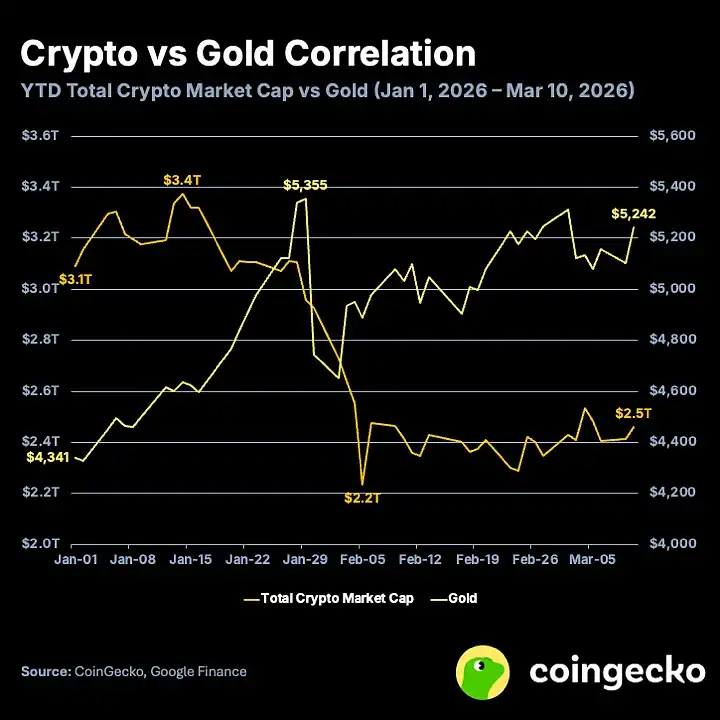
Since the beginning of the year, the correlation between the total cryptocurrency market capitalization and the S&P 500 index has been 0.49, indicating a moderate positive correlation, similar to the situation in 2025 (annual correlation of 0.46 that year). On the other hand, the year-to-date correlation between cryptocurrencies and gold has turned to -0.69, indicating a moderate negative correlation. In 2025, the correlation between cryptocurrencies and gold was only 0.19, showing a weak or no correlation. Overall, as an asset class, cryptocurrencies are shedding their long-held perception as purely risk assets as they decouple from U.S. stocks.
U.S. stocks, represented by the S&P 500 index, have faced significant headwinds in 2026 as well. Despite increasing investment in the AI sector and generally strong economic and earnings data, the index has actually declined since the beginning of the year. Geopolitical tensions have undoubtedly played a role, but ongoing uncertainty about the impact of AI on the future economy and labor force has also triggered a "SaaS apocalypse." Since the beginning of the year, the market capitalization of listed software and SaaS companies has evaporated by $1.3 trillion to $1.5 trillion, accompanied by a sharp decline in forward P/E ratios and revenue multiples.
Furthermore, gold has continued its strong momentum since 2024, with a year-to-date increase of over 20%. Gold is typically seen as a solid store of value and a safe-haven asset, but due to soaring prices, it is currently exhibiting higher volatility. Continued geopolitical and macroeconomic pressures are driving its upward momentum, with retail traders and sovereign nations buying in droves.
Related reading: BTC Options Insight: Why is March 20 a key turning point for volatility?
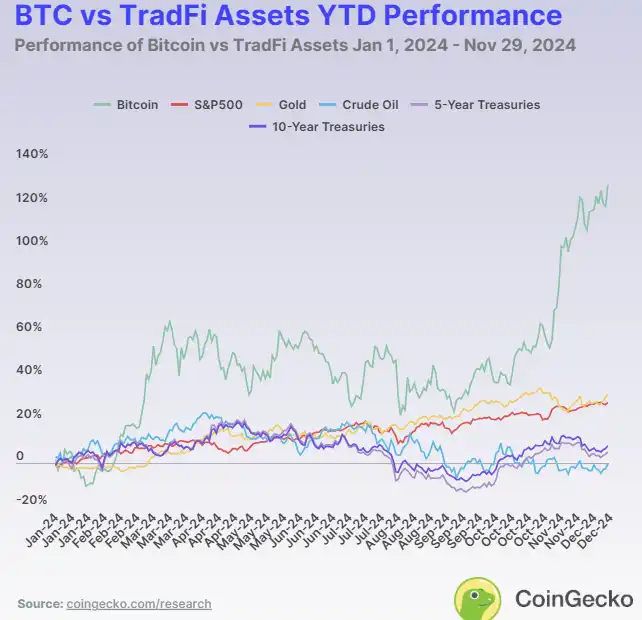
Performance in 2026 is starkly different from 2024. For reference, below is the performance of Bitcoin versus other asset classes in 2024 (published in December 2024).
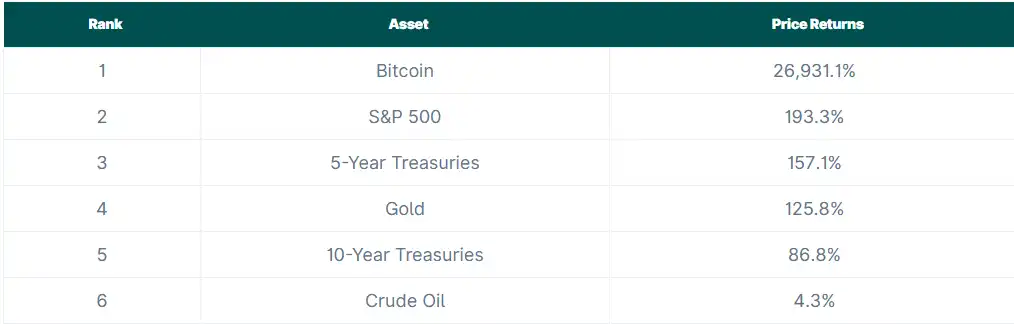
Dubbed "magic internet money," Bitcoin may have become a legitimate investment asset alongside traditional assets like stocks, commodities, and bonds. Looking at 10-year returns, Bitcoin's impressive yield of 26,931.1% is astounding. Imagine $100 invested in 2014 being worth $26,931.1 today. While these numbers are staggering, it is equally important to examine its performance relative to other assets over both short and long terms.
Which asset performed best across year-to-date, 1-year, 3-year, 5-year, and 10-year time spans?
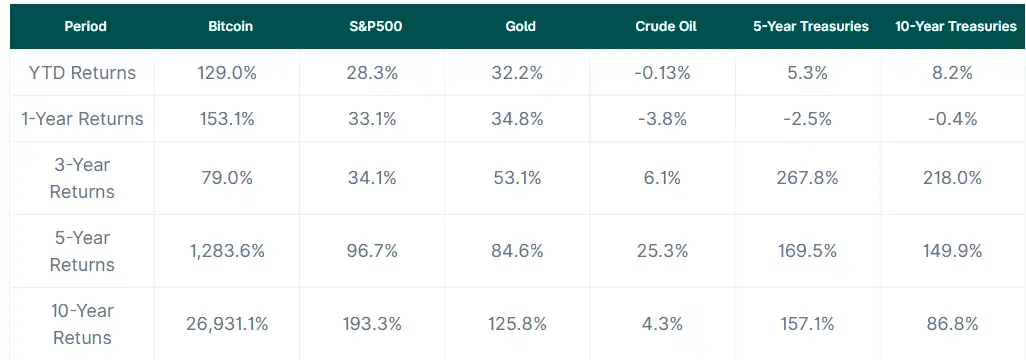
Performance across different time spans reveals the strengths and weaknesses of each asset. In 2024, Bitcoin was the best-performing asset, with a return of 129.0%. Gold followed closely with a year-to-date return of 32.2%, demonstrating its reliability as a traditional store of value. The S&P 500 remained strong with a return of 28.3%. However, crude oil prices fell, with a return of -0.13%, while U.S. Treasuries provided modest returns, with the 5-year Treasury at 5.3% and the 10-year Treasury slightly higher at 8.2%.
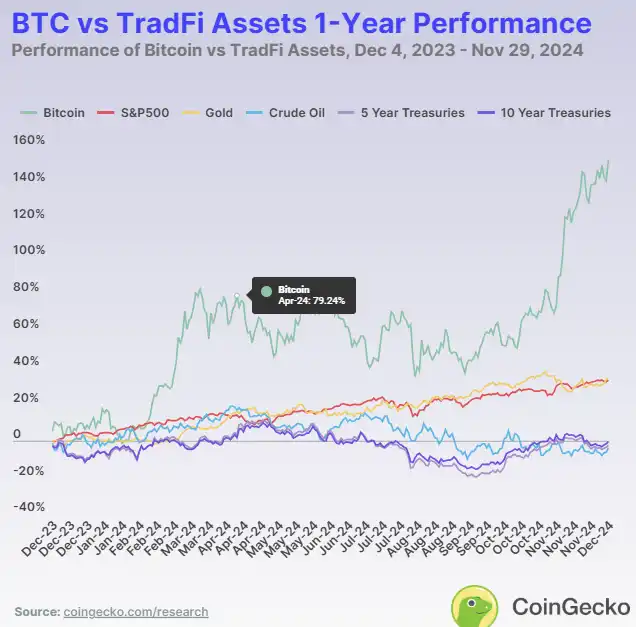
On a 1-year basis, Bitcoin's performance continued to outperform other assets, with a return of 153.1%. Gold returned 34.8%, followed by the S&P 500's 33.1%. The strong performance of these three assets shows the market stability over the past year. However, Treasuries were more sensitive to economic changes, with returns of -4.3% for the 5-year and -2.6% for the 10-year bonds. These figures reveal how bonds fluctuate with interest rates and fiscal policy.
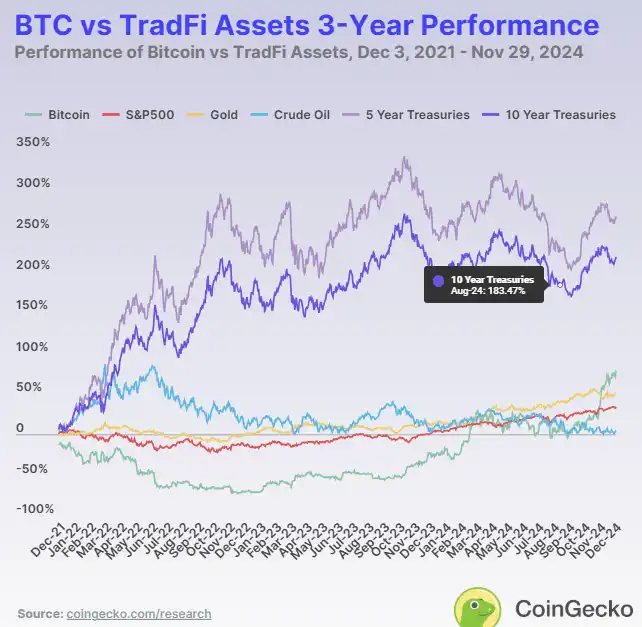
In the three-year range, the performance landscape changed, with bonds favored as economic stability became more important. U.S. Treasuries led the way, with the 5-year Treasury yielding 267.8% and the 10-year Treasury following closely with a yield of 218%. Bitcoin also performed excellently during the same period, with a yield of 79%, while gold came in second with a solid yield of 53.1%, providing some security amid market uncertainty. Crude oil was the only asset that underperformed others during this period, with a yield of just 6.1%.
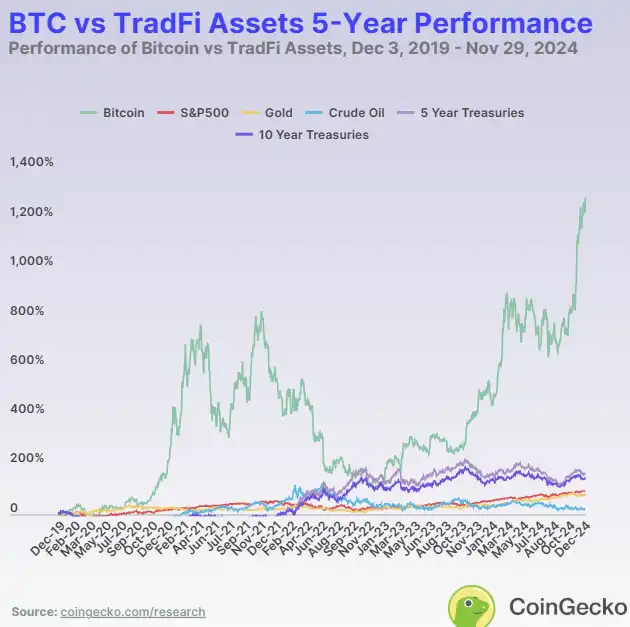
Five-year data shows Bitcoin had the strongest performance, with a yield of 1283.6%. The S&P 500 and gold remained stable, with yields of 96.7% and 84.6%, respectively. U.S. Treasuries also performed well, with the 5-year Treasury yielding 157.1% and the 10-year Treasury yielding 149.9%. Crude oil rose only 25.3%, making it relatively less attractive for long-term investment. Data from this period suggests that Bitcoin has significant potential returns for medium-term investments, while the steady growth of stocks and gold provides balance.
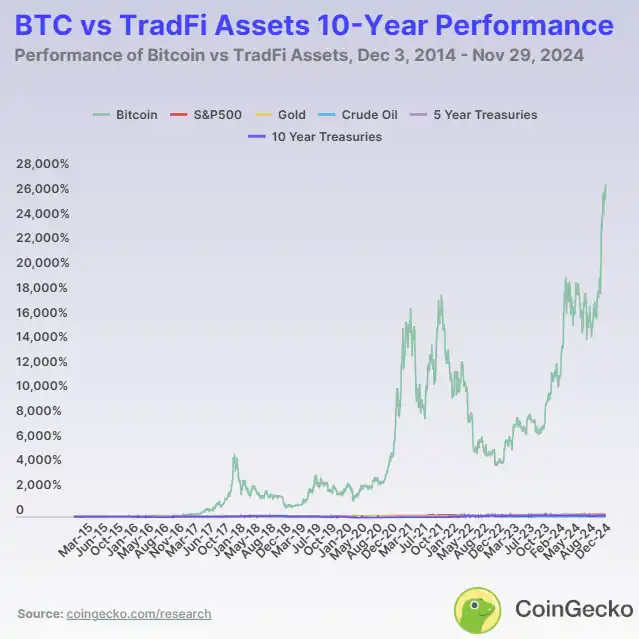
Over a ten-year span, Bitcoin's growth rate of 26,931.1% is unmatched, a testament to its enormous investment potential for early investors. Although other assets' returns pale in comparison to Bitcoin's, they still provide stable returns, such as the S&P 500's 193.3% and gold's 125.8%. U.S. Treasuries also maintain value, with the 5-year Treasury returning 157.1% and the 10-year Treasury returning 86.8%. However, crude oil returned only 4.3%, performing far worse than other assets.
This decade of observation shows that Bitcoin is the ultimate high-growth asset, while gold, bonds, and stocks offer safer, lower-return alternatives for risk-averse investors. However, Bitcoin was still a relatively new asset at the time, with a market capitalization much smaller than other assets. It was precisely its smaller base that allowed it to grow at a faster rate.
Has Bitcoin been volatile over the past decade?
Bitcoin's huge gains over the past decade have been accompanied by significant volatility. Bitcoin's price has fallen as low as $172.15 and reached as high as $103,679. The chart below clearly shows Bitcoin's cycles, which coincidentally occur every four years after halvings. Over this decade, Bitcoin has experienced two "bull market" cycles, in 2017-2018 and 2020-2021, and is currently in one of these bull cycles. At the end of the cycles, Bitcoin's price tends to plummet by more than 70% from its peak, making Bitcoin highly volatile. This extreme volatility highlights its high-risk, high-reward nature, which is very attractive to growth-seeking investors but challenging for those seeking stability.
Is Bitcoin's performance correlated with other assets?
Beyond volatility, Bitcoin's relationship with other major assets like the S&P 500 and gold can further reveal its unique behavior. Correlation analysis reveals how Bitcoin keeps pace with or diverges from traditional markets:
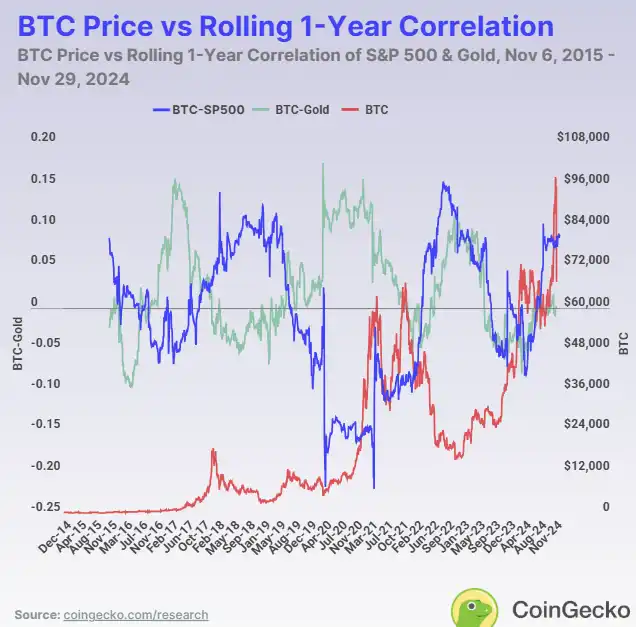
Bitcoin and the S&P 500
Over the years, the correlation between Bitcoin and the S&P 500 (shown by the blue line) has been unstable, typically close to zero before 2018. This low correlation indicates that Bitcoin's behavior was largely independent of the stock market during this period. However, since 2020, this correlation has strengthened, with Bitcoin moving more in line with stocks during major economic events like the COVID-19 pandemic. Price correlations also coincided with Bitcoin's rallies in 2018, 2020, and 2024.
Bitcoin and Gold
Regarding gold, Bitcoin's correlation has an inverse relationship with its correlation to the S&P 500. This indicates that although both are considered alternative investments, Bitcoin and gold (shown by the green line) typically move independently of each other. Furthermore, the correlation moves inversely to the Bitcoin price. When the price rises, correlation decreases, and vice versa. This suggests that when Bitcoin performs poorly, investors tend to turn to gold. However, during macroeconomic events, correlations typically spike briefly, reflecting both assets' reactions to similar market conditions. Nonetheless, Bitcoin has not yet fully established itself as "digital gold."
A comparison of the ten-year price returns of Bitcoin and traditional assets is as follows: