Natural Gas Double Bottom Breaks Through Cloud, Approaches Key Resistance Zone Around 2.800

Pubblicato 2026-08-19Pubblicato ultima volta 2026-08-19

Introduzione

Natural Gas's 5-hour candlestick chart has just confirmed a double bottom pattern, with a short-term rally breaking through the Ichimoku Cloud, now approaching the key resistance zone of $2.800-$2.830 – however, bulls fear a 'bull trap' may be imminent. Structural reversal signals are evident, but the primary trend remains bearish, requiring precise entry and stop-loss points.

Natural Gas's 5-hour candlestick chart has just confirmed a double bottom pattern, with the short-term uptrend breaking through the Ichimoku cloud and now approaching the key resistance zone of $2.800-$2.830. However, what bulls fear most is a potential "bull trap" lying ahead. While structural reversal signals are evident, the primary trend remains bearish, requiring precise entry and stop-loss points.

Bullish Reversal or a Trap?

A Quick Look at the Situation:

Natural Gas has broken above both the SMA(50) and the upper edge of the Ichimoku cloud, indicating a strengthening short-term trend.

The SuperTrend indicator has turned green, establishing a pullback support level at $2.667.

However, the price remains below the long-term SMA(200) at $2.931, meaning the primary bearish trend is not broken.

The MFI reading is exceptionally high at 87.46, indicating extreme overbought conditions and suggesting potential profit-taking pressure at any moment.

Core Risk:

The $2.800~$2.830 zone is a high-risk area for a "bull trap" during this upward surge. This area coincides with the Fibonacci 23.6% retracement level and previous highs. A failure to break through followed by a pullback could form a classic bull trap signal.

The ADX reading is only 19.63, indicating limited overall trend strength and suggesting continued tug-of-war between bulls and bears.
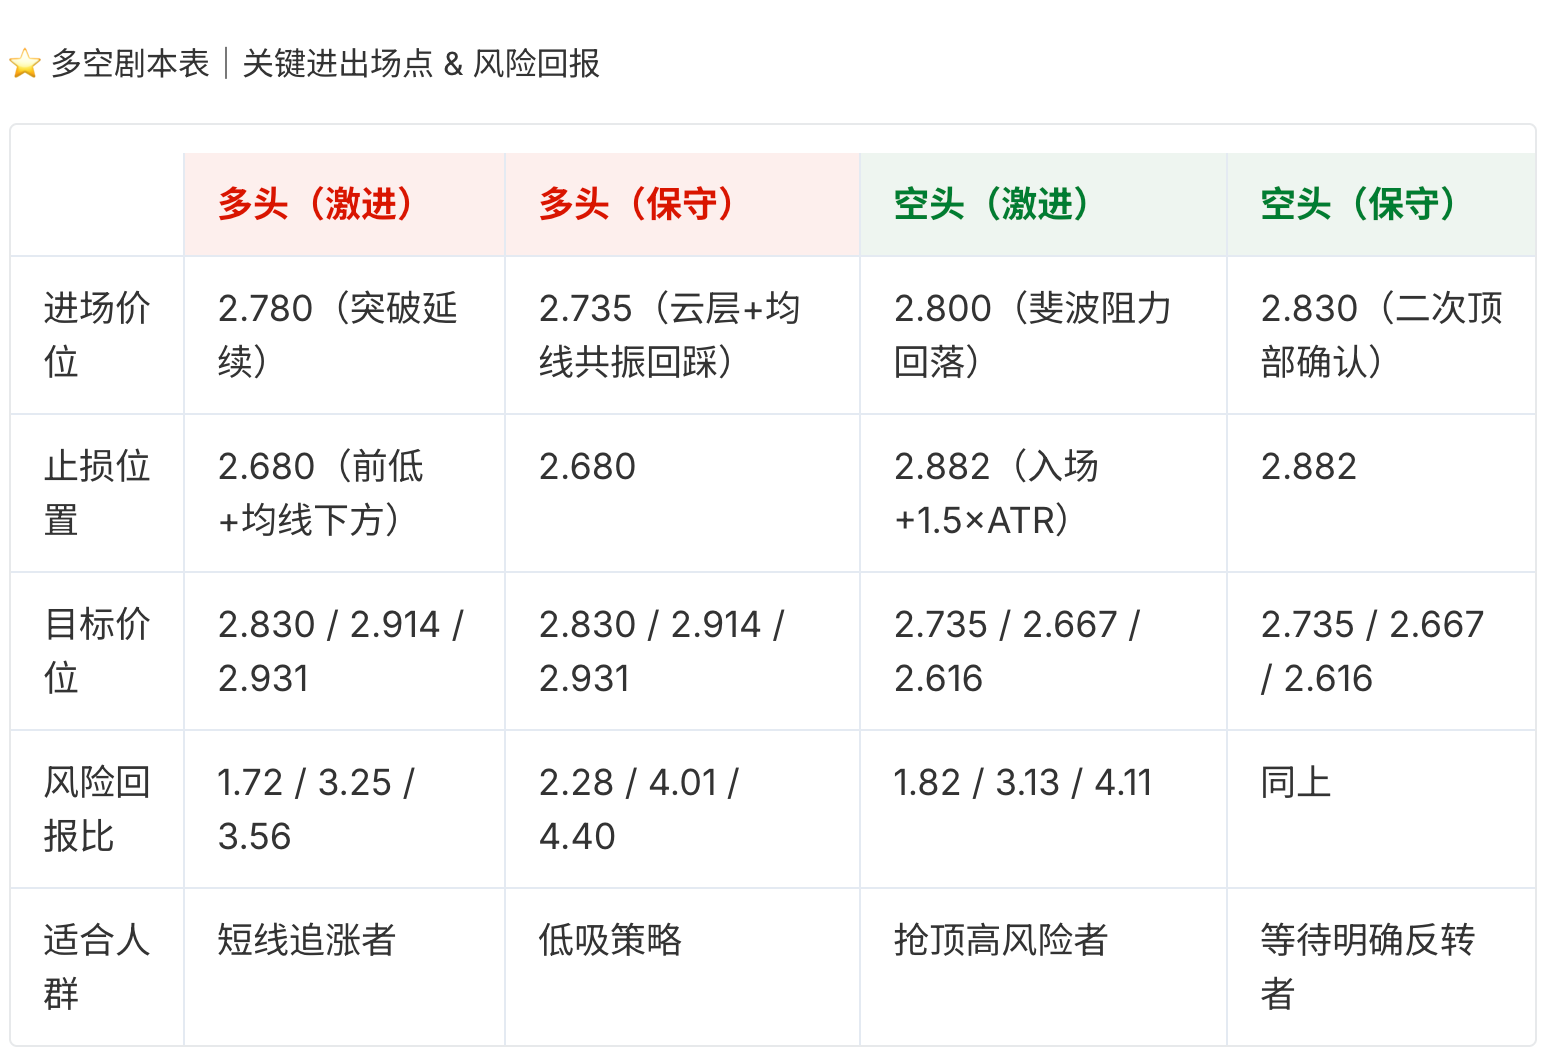
Note:

For long positions, it is recommended to move the stop-loss to the entry price (risk-free operation) once the first target is reached, and to use a trailing stop-loss after the second target is hit.

For short positions, monitor if the MFI falls significantly from the overbought zone as a potential signal for a top formation.

Technical Structure and Signal Breakdown

Double Bottom Pattern at $2.616: 100% complete, with higher lows supporting the uptrend.

Fibonacci 23.6% Retracement at $2.800: A short-term structural resistance level, difficult for bulls to overcome.

Volume Analysis: Volume has gradually increased during the rise, suggesting buying interest from major funds.

Risk of Churn: Repeated consolidation within the $2.735-$2.800 range could easily form a shakeout zone. Avoid chasing rallies or selling into weakness.

Risk and Operation Summary

Failure Criteria: The bullish structure is invalidated if the price falls below $2.667. For bears, a breach above $2.830 requires switching to defensive tactics; a breakout could target $2.931.

Range to Monitor: The $2.735-$2.800 zone is a "no-trade" consolidation area. Wait for a clear breakout or pullback before taking action.

Key Educational Point: Extreme MFI readings often precede sharp short-term volatility. However, a single indicator should not be used in isolation; always combine it with support/resistance zones and strictly control position size.


Letture associate

Semiconductor Mid-Game Check-in: How Much Left in the Tail-End Rally?

Semiconductor Mid-Game Review: How Much is Left in the Rally? This analysis compares the current semiconductor market trend to NVIDIA's trajectory in 2024, drawing lessons on identifying market tops and bottoms. In July-August 2024, NVIDIA's stock fell 33%, triggered by a combination of "fundamental rumors" (Blackwell delays, antitrust probes) and "macro-driven asset selling" (BOJ rate hike leading to carry-trade unwinding). The low was marked by extreme panic selling across global markets. Key characteristics of a TOP include: Technical patterns like double tops or failure to break highs; Overcrowded and leveraged positioning (e.g., excessive retail and ETF inflows into a single stock like NVDA); High fragility where even a minor fundamental disappointment (e.g., a slight margin dip in stellar earnings) triggers a sharp correction. The practical action is to reduce exposure upon seeing technical warning signs combined with crowded trades. Key characteristics of a BOTTOM include: Technical reversal signals like a high-volume bullish engulfing pattern after a steep drop; Panic indicators hitting extremes (e.g., record VIX, major index crashes) signaling selling exhaustion; The downturn being driven by macro or systemic shocks unrelated to the company's core business fundamentals, creating a mispricing that quality companies eventually recover from. The conclusion is that while the current semiconductor rally may be in its later stages ("fish tail"), understanding these patterns—where tops form from crowded optimism and bottoms from panic unrelated to fundamentals—can help navigate remaining volatility.

marsbit9 min fa

Semiconductor Mid-Game Check-in: How Much Left in the Tail-End Rally?

marsbit9 min fa

New Insider Trading in Prediction Market Exposed: It's Impossible to Lose When You Sit in That Position

PolyBeats reported on August 19 about a user who achieved a 120% return in just 89 seconds by betting that Russia would capture Konstantynivka on a prediction market platform, where the probability (and price) surged from 43% to 92%. This trade was notably the 14th in a series of perfect predictions related to the Russia-Ukraine war by this account, with a total profit of approximately $17,500. Eleven of these trades saw the probability jump to near 100% within five minutes of the purchase. The article suggests these consistent gains point to potential insider knowledge. The key is that these prediction markets on Polymarket settle based not on real-time battlefield events, but on whether the Institute for the Study of War (ISW) updates its official interactive map to show an area as controlled by Russia. Therefore, profiting reliably doesn't require military intelligence, but merely advance knowledge of when and where ISW will update its map. This mirrors a prior incident in November 2025, where an unauthorized, temporary edit to the ISW map regarding Myrnohrad allowed a trader to make over a 10,000% return before the edit was reversed. While ISW has since added safeguards like "pending review" statuses and duration requirements for map changes, the article argues the 14-trade winning streak indicates someone with access to the map update process—like an ISW staffer—could exploit the time gap between an internal decision and its public release, turning administrative knowledge into nearly guaranteed profits.

marsbit44 min fa

New Insider Trading in Prediction Market Exposed: It's Impossible to Lose When You Sit in That Position

marsbit44 min fa

Trading

Spot
活动图片