Since the beginning of this year, NAND flash prices have entered a new round of rapid increases, with retail prices of consumer storage products being the first to be affected. In October 2025, a SanDisk Extreme 128GB microSD card was sold for $17 on Amazon. By February of this year, the price of the same card had risen to nearly $40. In less than four months, the price increased by 130%.
First, it is important to clarify the difference between memory modules (RAM) and memory cards, as they are not the same type of product. Memory modules (RAM) are temporary storage inside computers, used for reading and writing data when programs are running; data is lost when power is cut off. Memory cards (such as microSD cards) are external expandable storage used for long-term preservation of files like photos and videos; data is not lost when power is cut off. The price increase discussed in this article refers to the latter—memory cards and the underlying NAND flash chips.
The continuous rise in memory card prices is driven by a systemic repricing of the entire NAND flash market. The starting point of this repricing is AI data centers competing for the same wafers.
Contract Prices Rose 50%, but Retail Prices Rose 130% by the Time They Reach You
First, let’s discuss what is happening.
Global NAND flash contract prices began climbing rapidly at the end of last year. According to a February report by market research firm TrendForce, overall NAND contract prices in the first quarter of 2026 increased by approximately 55–60% compared to the fourth quarter of last year, with enterprise SSD prices rising by 53–58%, setting a new record for quarterly growth. TrendForce also predicted that overall NAND contract prices would rise by another 70–75% in the second quarter.
These numbers represent the bulk contract unit prices agreed upon between large customers and do not directly equate to the retail prices on e-commerce platforms. However, retail prices on the consumer side have risen even more sharply than contract prices. The rightmost bar in Figure 1, showing a 130% increase, represents the actual price shock felt by ordinary consumers.
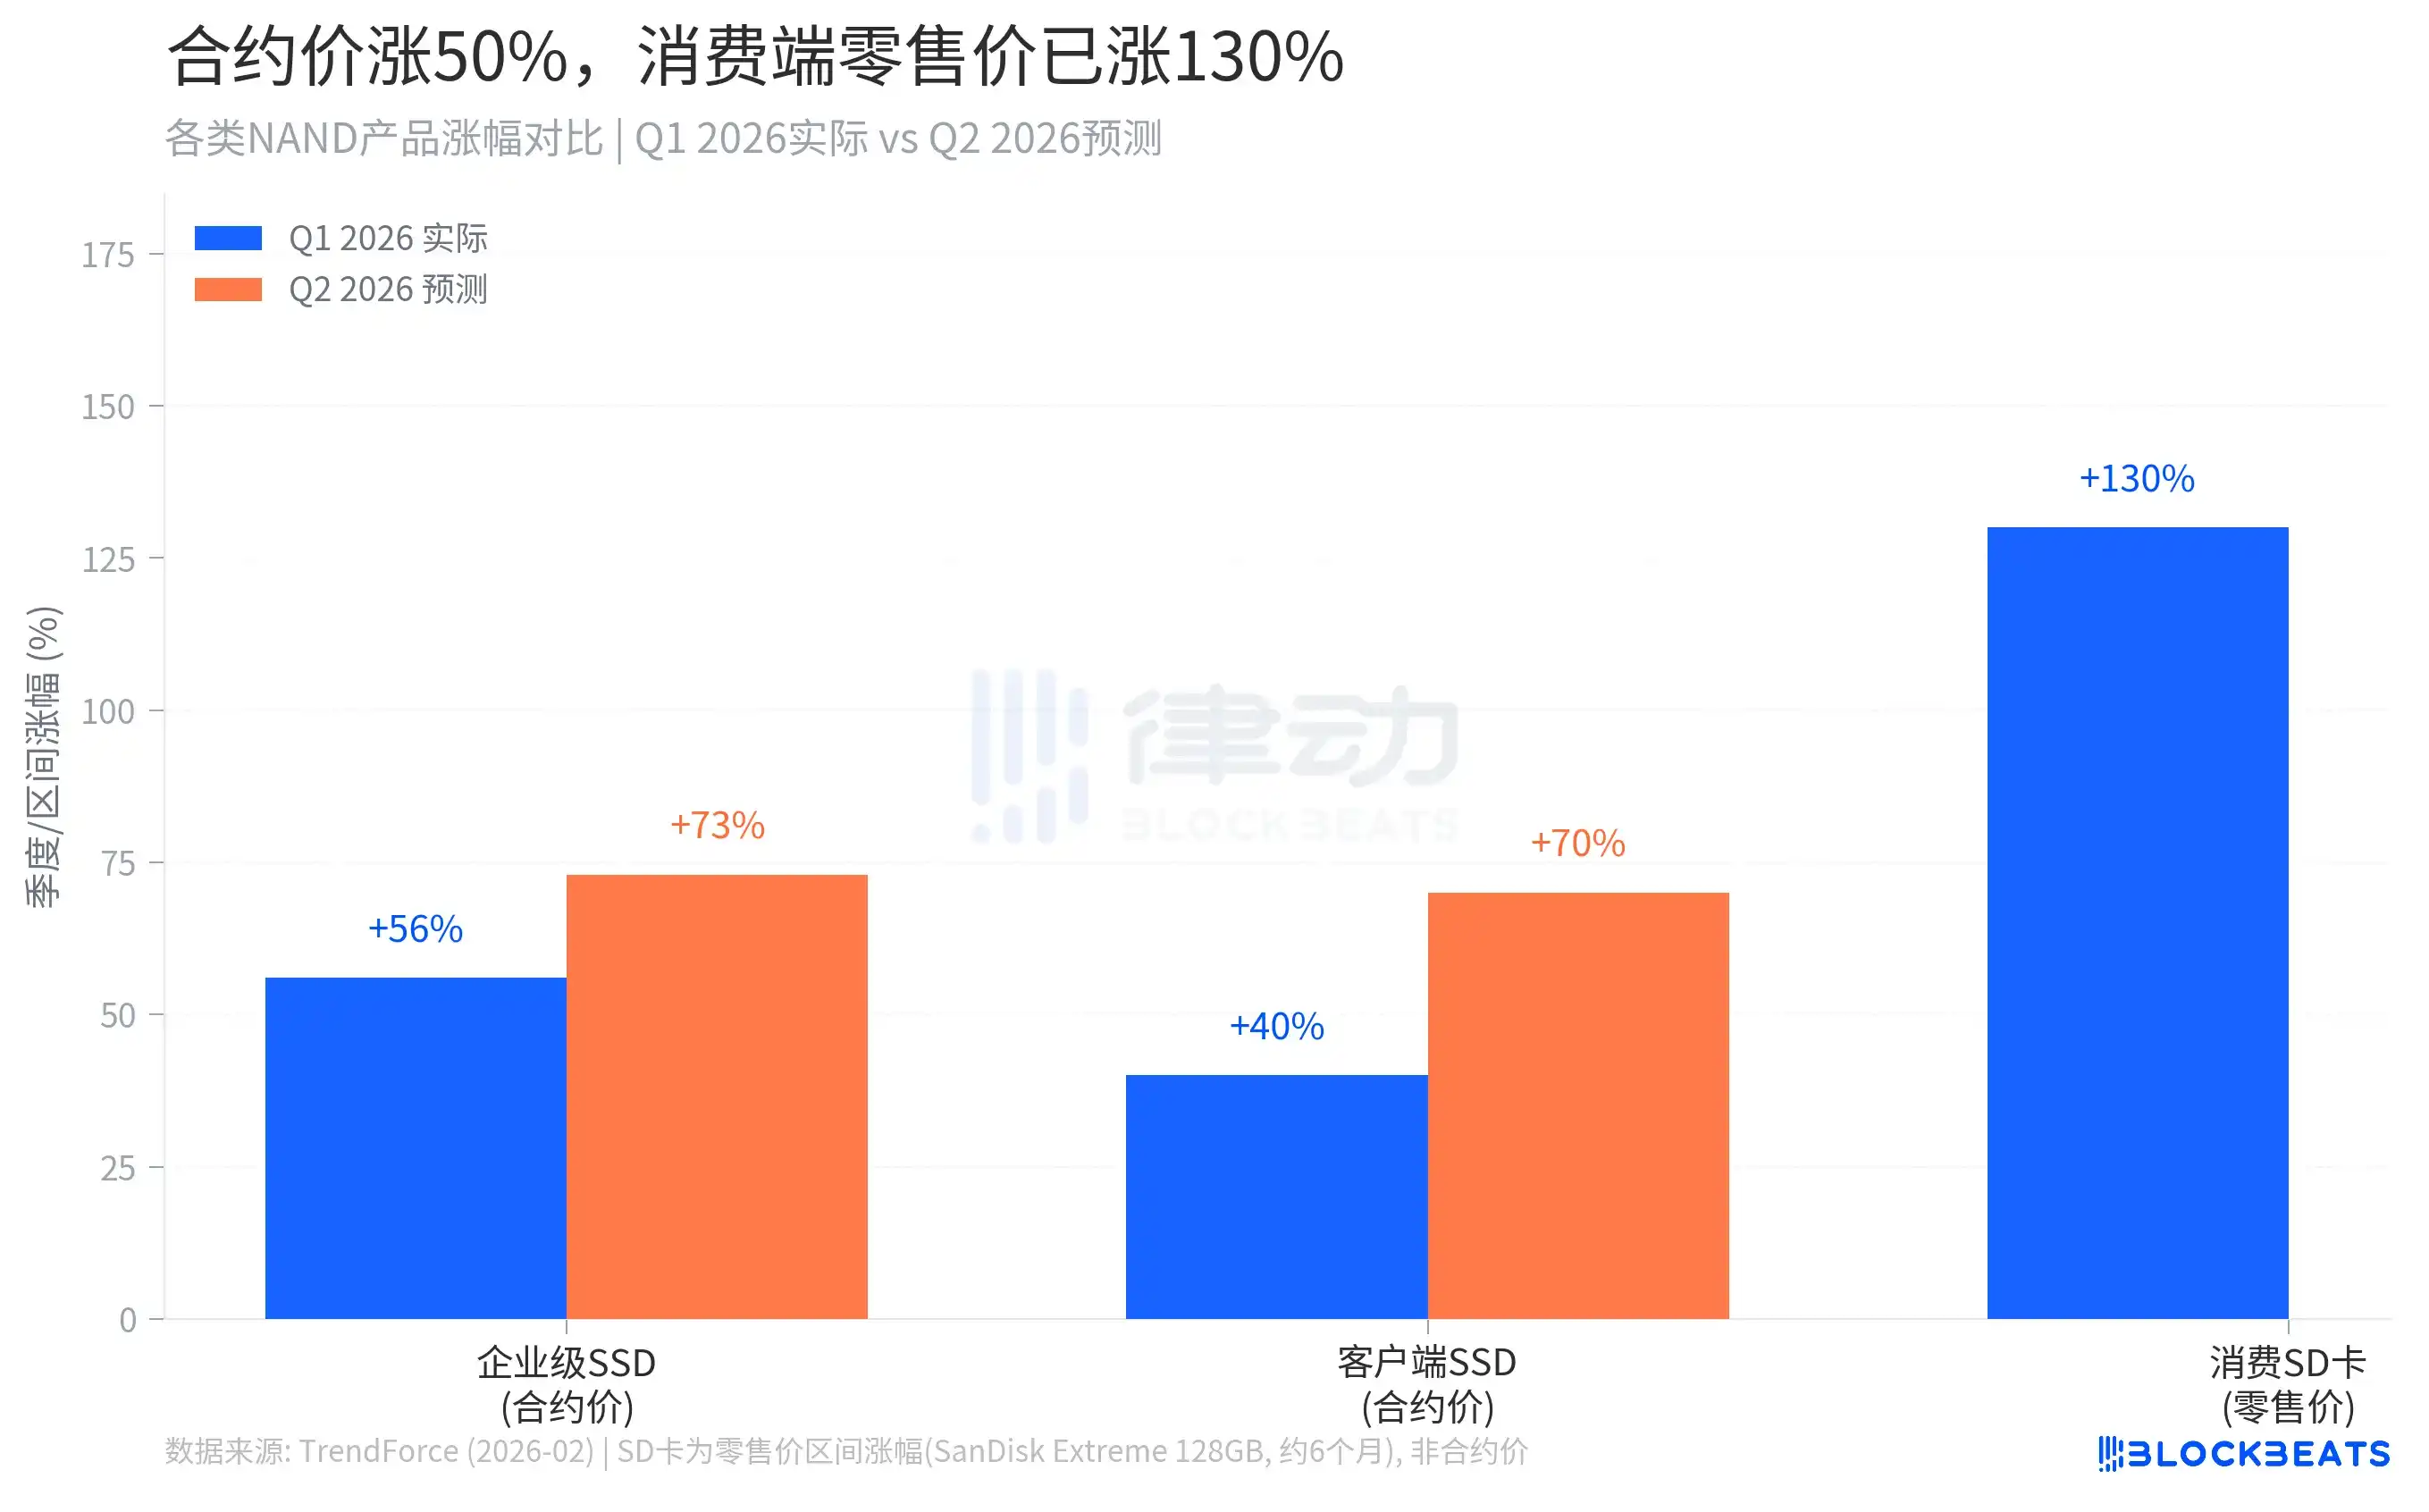
Why are retail price increases far exceeding contract price increases? Because the consumer market is a "residual allocation market." When NAND manufacturers set delivery plans, they prioritize fulfilling orders for large customers with long-term framework agreements, including AI data center operators and hyperscale cloud service providers. Only after these orders are fulfilled do the remaining inventories enter the distribution channels of the consumer market. With supply compressed, the spot market has almost no buffer capacity against price increases, leading to steeper retail price hikes than contract price hikes.
Kingston has publicly confirmed that its procurement cost for NAND wafers has increased by 246% compared to a year ago. This is a cost shock at the raw material level, which is ultimately passed down to consumers through product prices.
How AI Is Pushing Up the Price of a Memory Card
There are two key points in this graph worth highlighting.
The first is around October 2025, when relatively low-priced memory cards were available on the market. That period marked the end of the previous cycle of oversupply. From 2023 to 2024, major storage manufacturers accumulated large inventories amid weakening demand, leading to continuously declining prices. Photographers, creators, and gamers took advantage of this window to stock up on memory cards at historically low prices.
The second key point is the fourth quarter of 2025. Samsung, Kioxia, Micron, and SK Hynix successively announced production cuts and price increases, completely reversing the situation in a short period. Samsung raised prices for enterprise customers by over 100%, while Kioxia explicitly stated that its entire 2026 production capacity had been pre-sold to large customers, effectively cutting off supply to the consumer market.
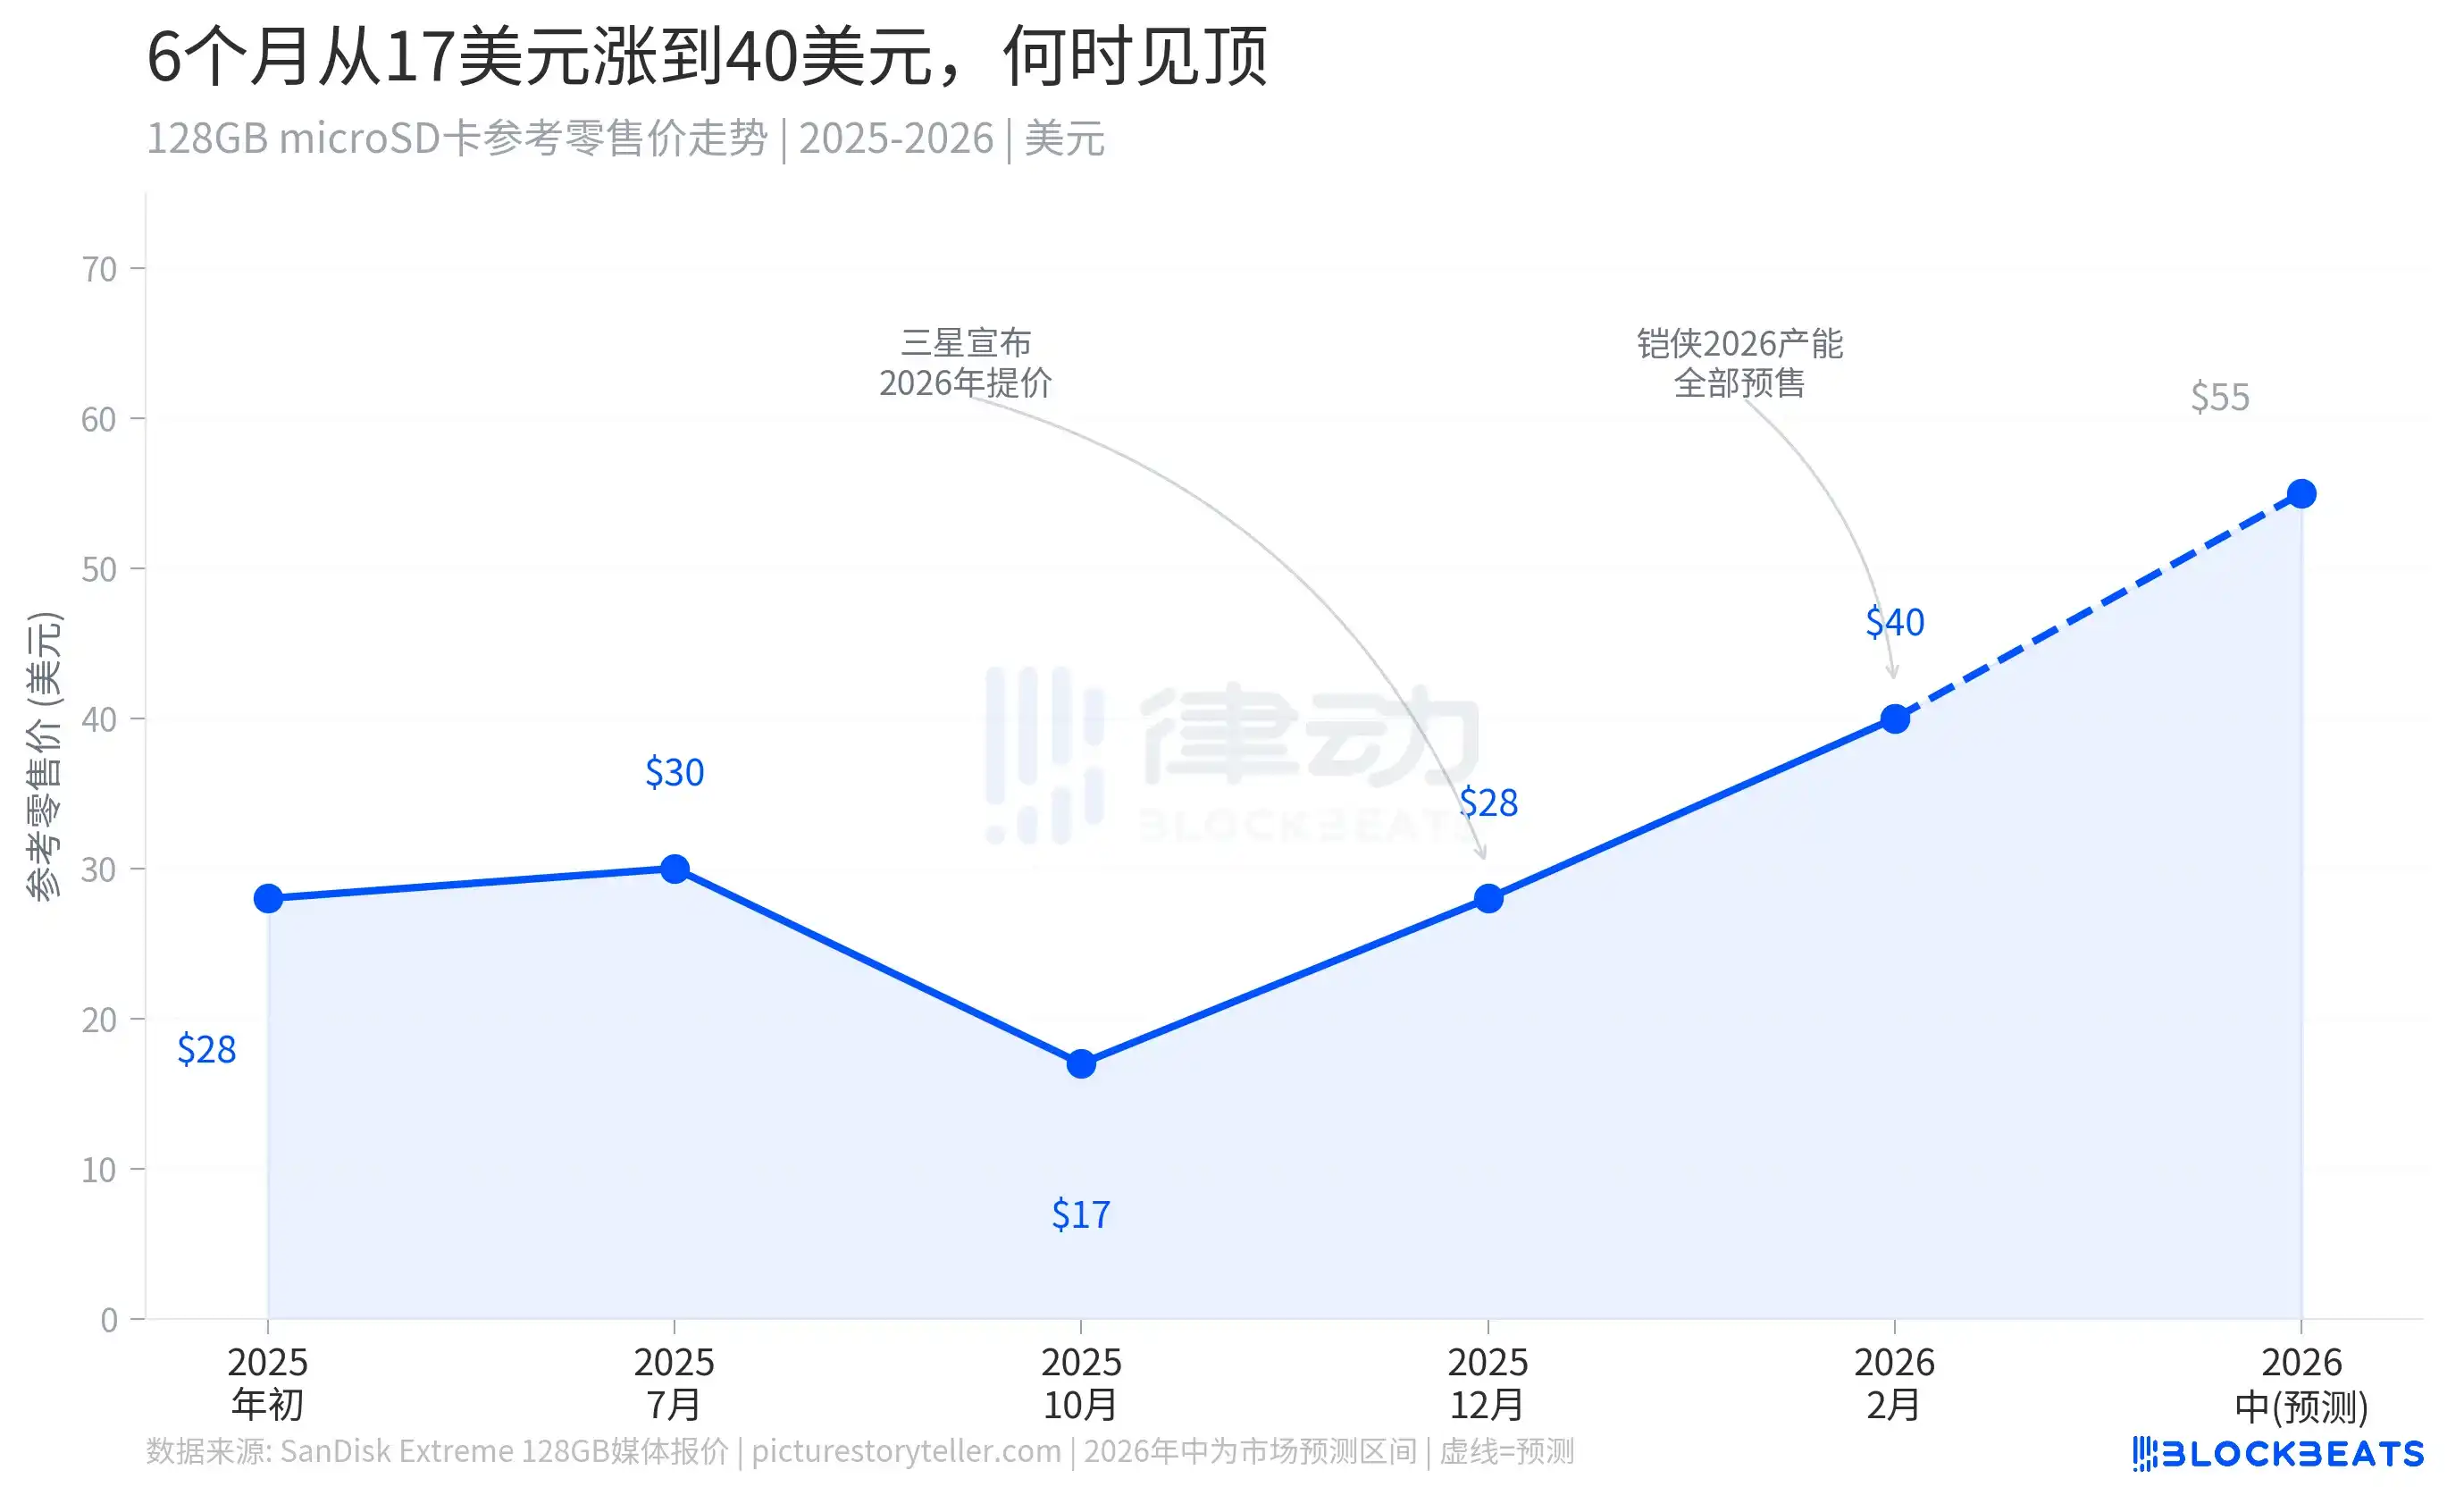
Since then, retail prices for memory cards have been climbing steadily and are expected to reach the $50–$60 range by mid-2026, with no window for a price correction throughout the year. This is not market speculation but a structural adjustment in the supply allocation mechanism. Before AI data centers became the top-priority buyers in the NAND market, consumer and enterprise products participated more or less equally in capacity allocation. Now, the consumer end is at the very bottom of the allocation chain.
This Time, It’s Completely Different from 2017
The NAND industry experiences a price cycle approximately every three to four years. The last significant price increase occurred in 2016–2017 and lasted nearly two years. That round was triggered by the technological transition from 2D NAND to 3D NAND. The new stacking process slowed effective output during the yield ramp-up phase, tightening supply and driving up costs. However, once 3D NAND production lines stabilized for various manufacturers, Samsung, SK Hynix, and Micron simultaneously expanded production significantly. Inventories quickly shifted from shortage to surplus, and prices plummeted in early 2018.
This time, the driving force is entirely different, and the path to recovery will also be截然不同.
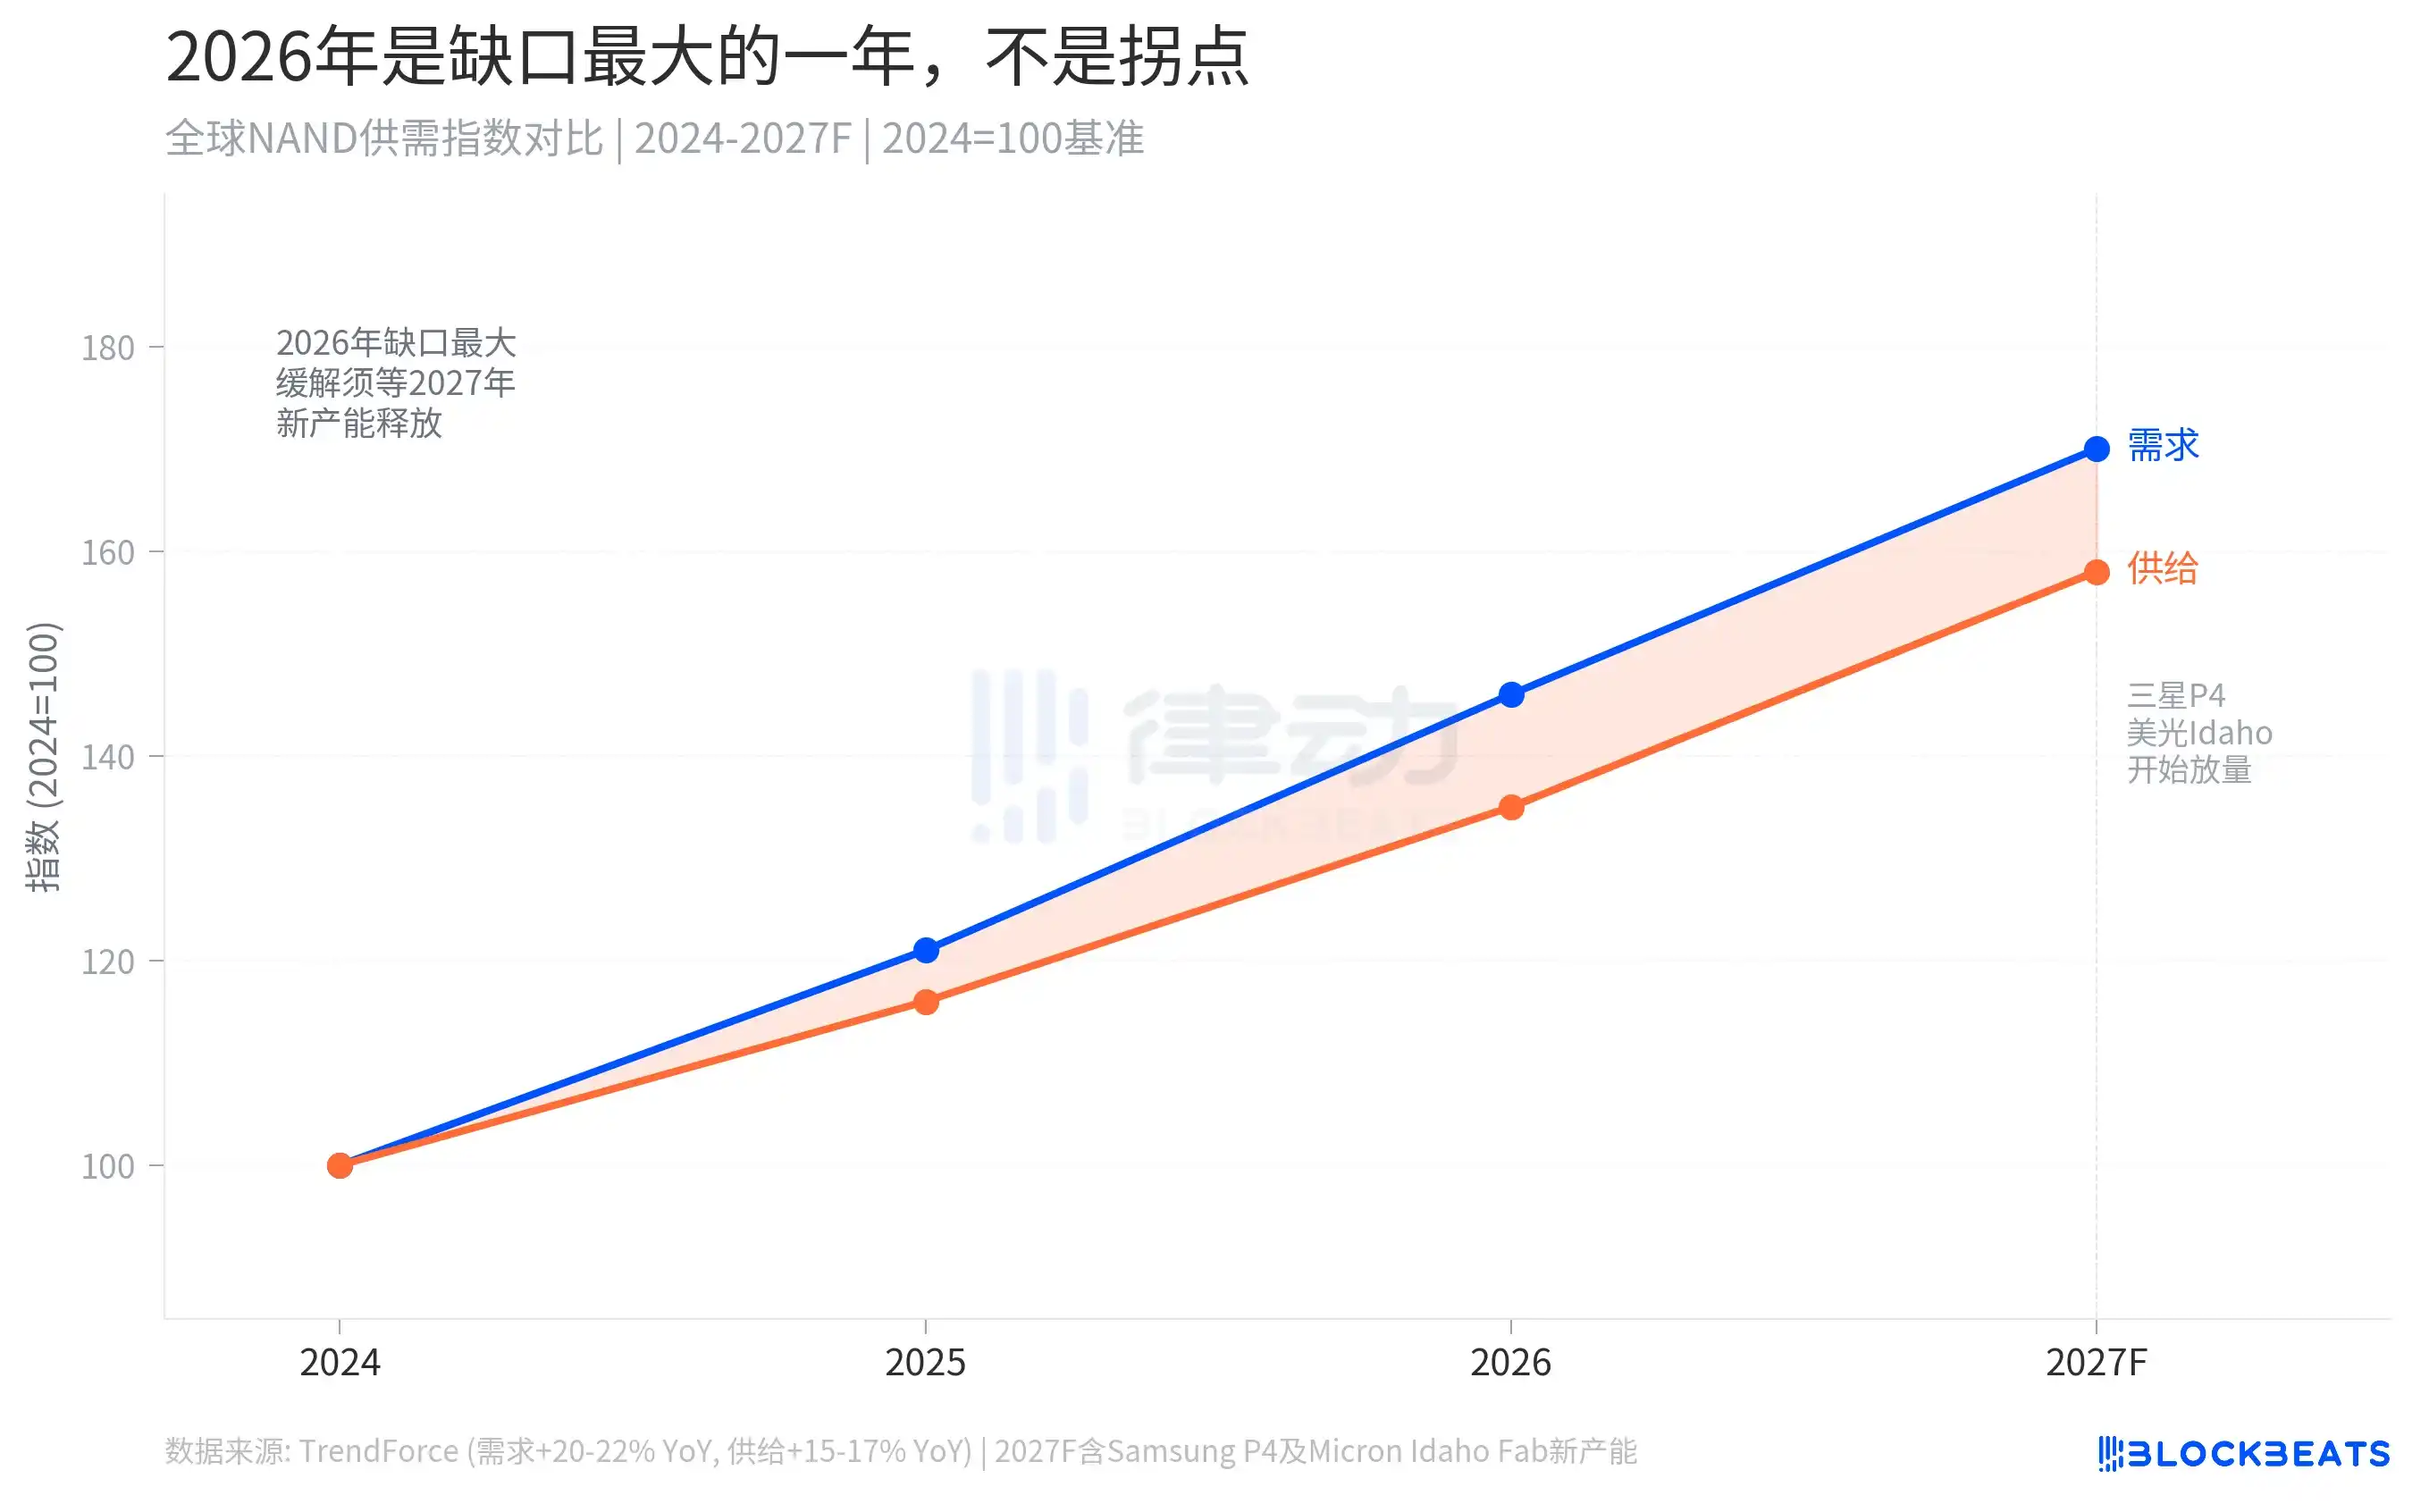
According to TrendForce data, global NAND demand growth is expected to reach 20–22% in 2026, while supply-side growth is only 15–17%. The absolute gap is not large, but in a market of this scale, a few percentage points of supply-demand disparity can trigger extremely sharp price reactions. More importantly, this gap is not caused by technical issues but by a structural shift in demand. AI data centers are consuming NAND capacity in a sustained, massive, and high-priority manner, and the scale of this demand has no ceiling.
New production capacity to alleviate supply constraints will not arrive until late 2027 to 2028. Samsung’s NAND production lines at its P4 facility in Pyeongtaek, Gyeonggi Province; Micron’s new wafer fab in Idaho, USA; and Kioxia’s expansion of its Iwate factory all point to this timeframe. 2026 is the year with the largest supply-demand gap, not the turning point for prices.
Manufacturers Aren’t Lacking Capacity; They’re Actively Selling It to the Highest Bidder
The following graph illustrates the essential mechanism behind this price surge. In the NAND industry’s revenue structure, the share of enterprise products (AI data center SSDs, general server storage) is rapidly expanding. According to comprehensive estimates by industry agencies, the share of enterprise products in overall NAND revenue has risen from about 45% in 2024 to about 62% in 2026, while the share of the consumer and client market has been compressed from 55% to about 38%.
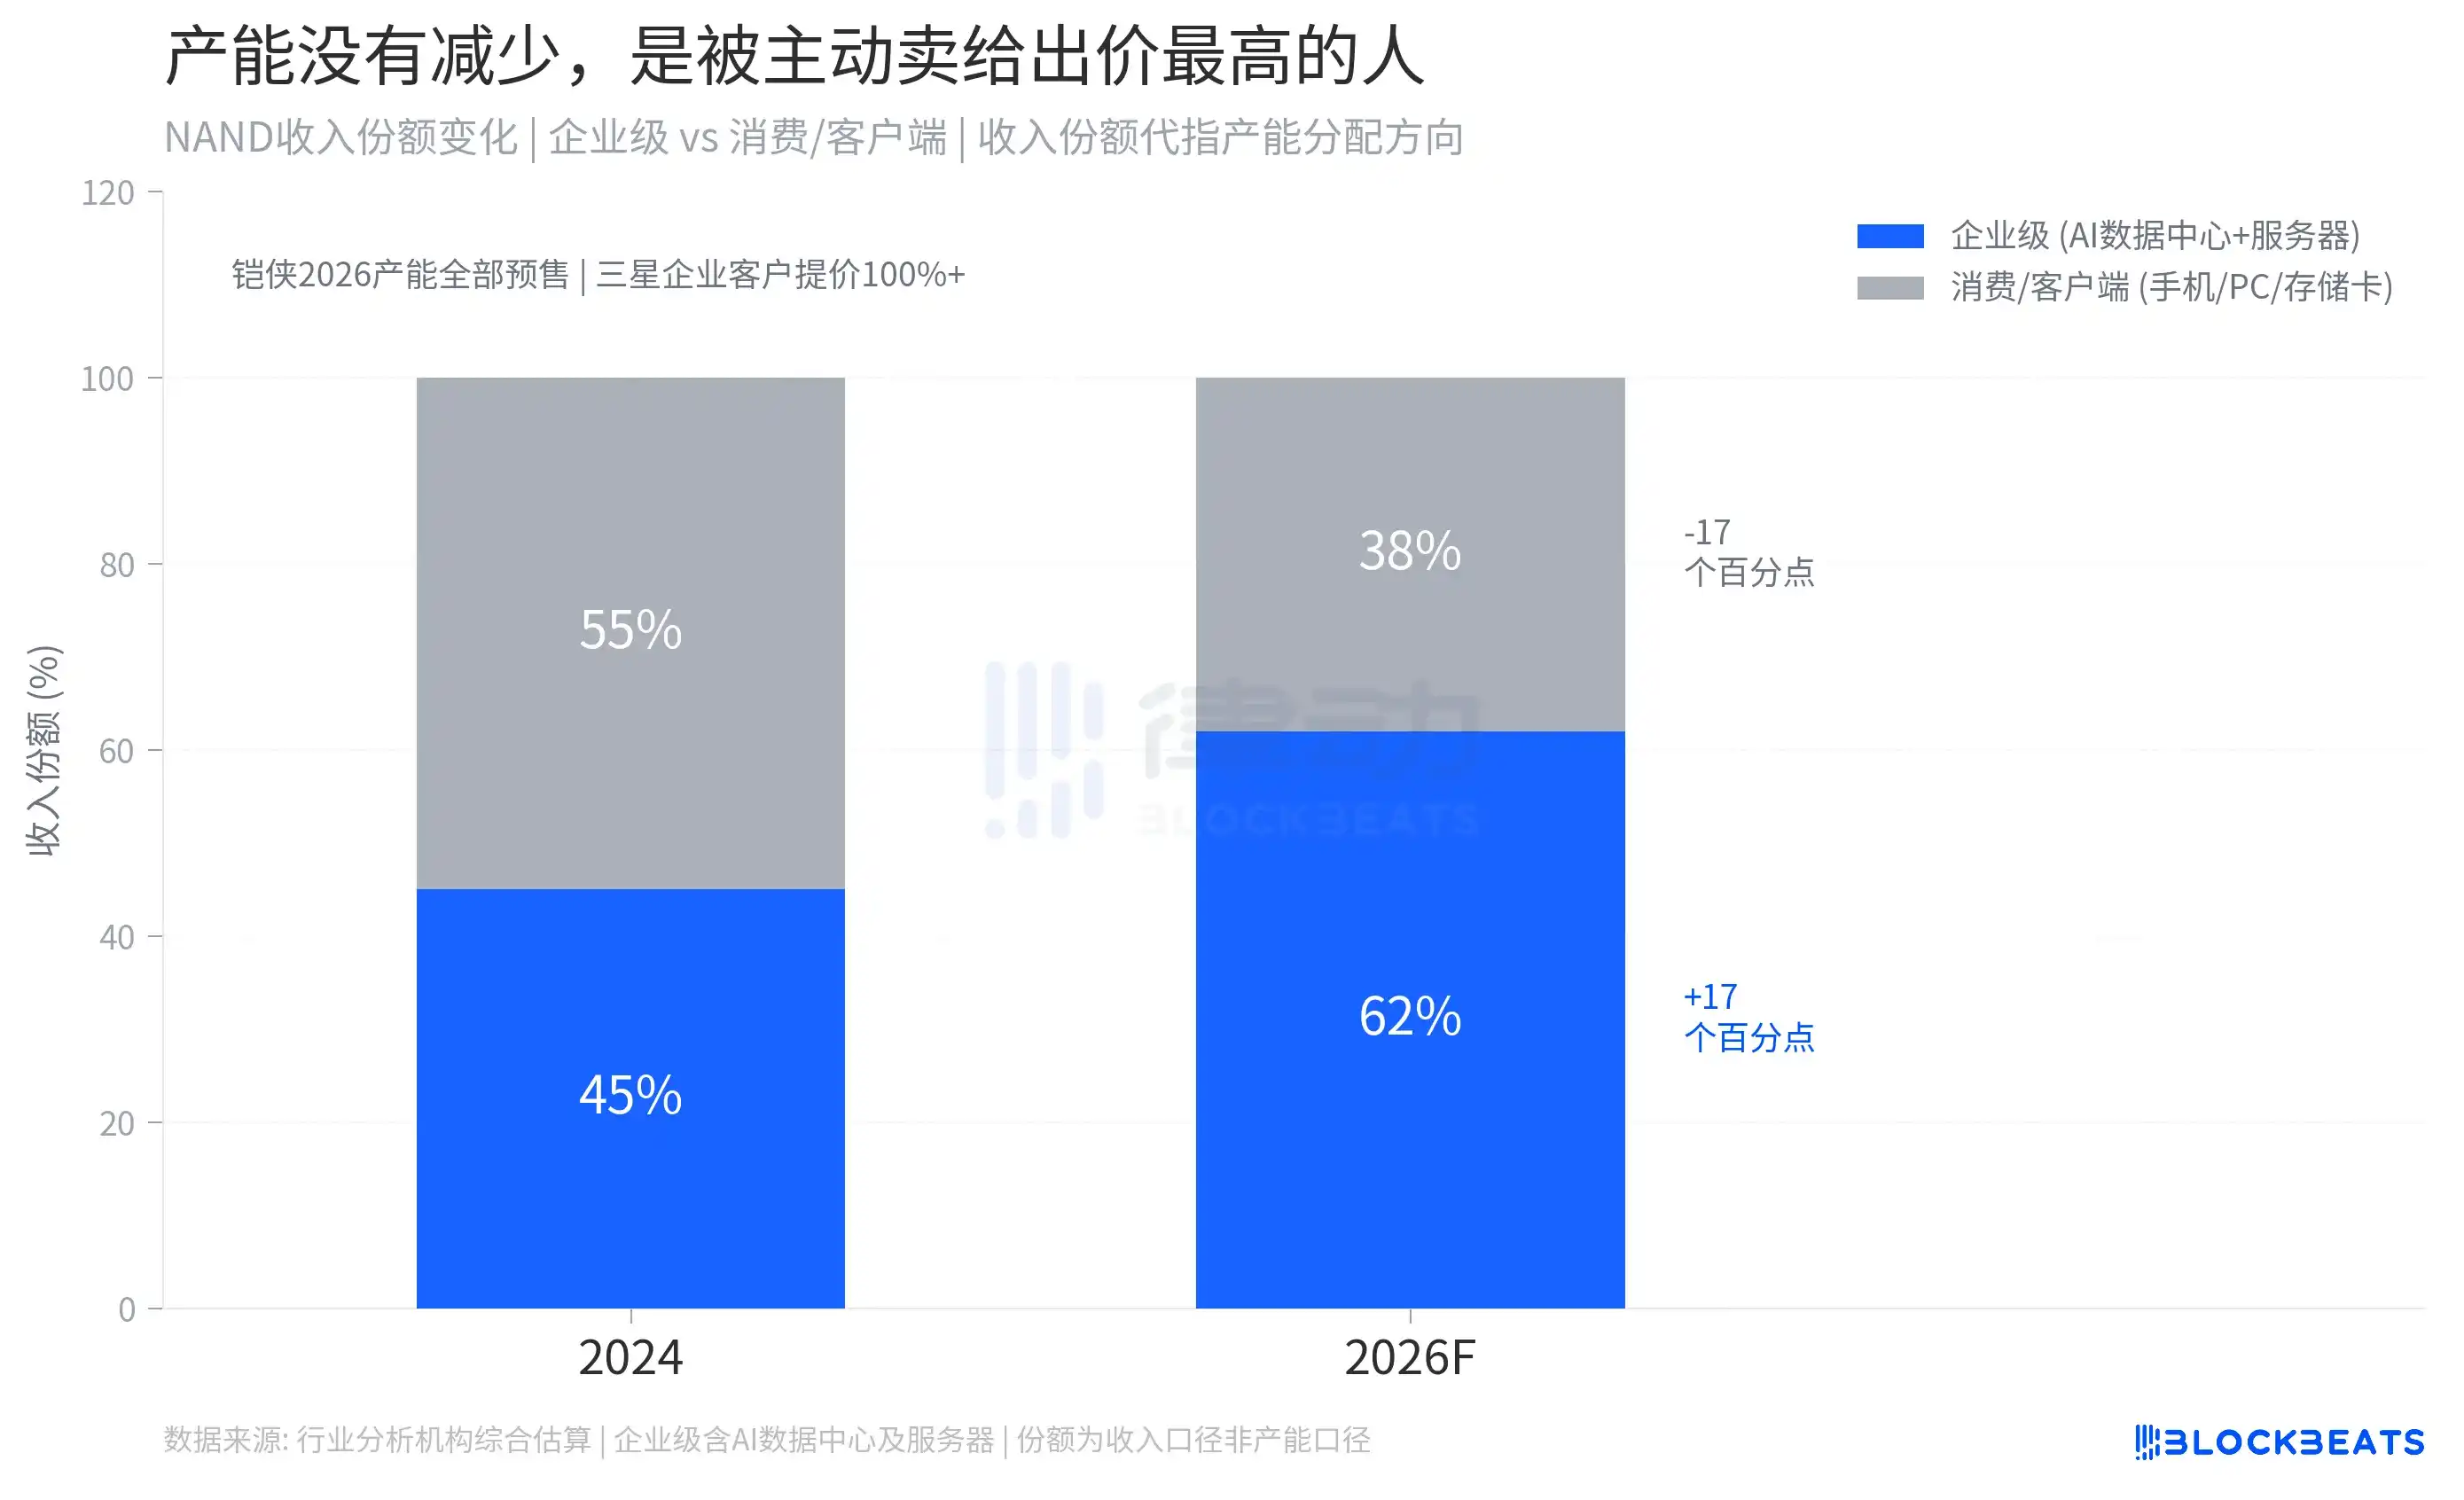
The logic driving this shift is straightforward: for the same wafer area, producing enterprise-grade high-density QLC SSDs yields 3–5 times the unit profit compared to producing consumer-grade memory cards. Capacity allocation by manufacturers like Kioxia and Samsung follows the principle of maximizing commercial利益, allocating the best wafers to the highest bidders.
This mechanism also has a hidden effect. As available inventory in the consumer market decreases, distributors and retailers accelerate their stocking pace to hedge against future price increases, further accelerating inventory drawdown on the consumer end and creating a self-reinforcing cycle of price hikes.
For consumers, memory card prices will remain high for a considerable period. This is not due to a lack of wafer capacity but because the allocation priority of the consumer market has been systematically lowered. Only when the construction pace of AI computing infrastructure slows down will excess wafer capacity return to the consumer product supply chain, but that won’t happen until after 2027.
The SD card in your camera and the world’s largest AI data center are using the same wafer. Now you know who wins.






