Market Plunges into Extreme Panic, Five Major Data Indicators Reveal BTC Buying Signals

比推Pubblicato 2026-02-02Pubblicato ultima volta 2026-02-02

Introduzione

The cryptocurrency market is experiencing extreme fear, with Bitcoin (BTC) dropping to $75,700 and Ethereum (ETH) to $2,220, causing $435 million in liquidations. A survey of 1,189 investors revealed that 45.6% believe BTC’s 2026 bottom will be between $75,000–$85,000, while 30.2% see it at $60,000–$75,000. Nearly half of respondents (47.2%) plan to DCA and hold long-term. Key on-chain metrics from Glassnode indicate potential support levels: the short-term holder cost basis is $95,400, the active investor average is $87,300, the realized price is $80,500, and the network-wide average cost basis is $55,900. The ahr999 indicator, which recently fell below 0.45 for the first time since October 2023, suggests a buying opportunity below $76,000. Analyst Willy Woo’s CVDD model points to a hard bottom near $45,000, while the cost basis of large holder “Strategy” ($76,040) is seen as a critical support level. Overall, data suggests a potential bottom formation between $45,000–$76,000.

Author: Ma He, Foresight News

Original Title: 5 Major Data Indicators Revealed: Is There a BTC Buying Signal Below $75,000?


Wintermute stated last week that $85,000 is a key level for BTC and that a direction would be chosen soon. Unfortunately, the direction was not upward but sharply downward.

On February 2, BTC fell to $75,700, and ETH dropped to $2,220. Numerous altcoins continued to decline. Regarding liquidation data, Coinglass data shows that $435 million was liquidated in the past 12 hours, with long positions accounting for $324 million.

The market fear index is 15, indicating that market sentiment has once again fallen into extreme panic.
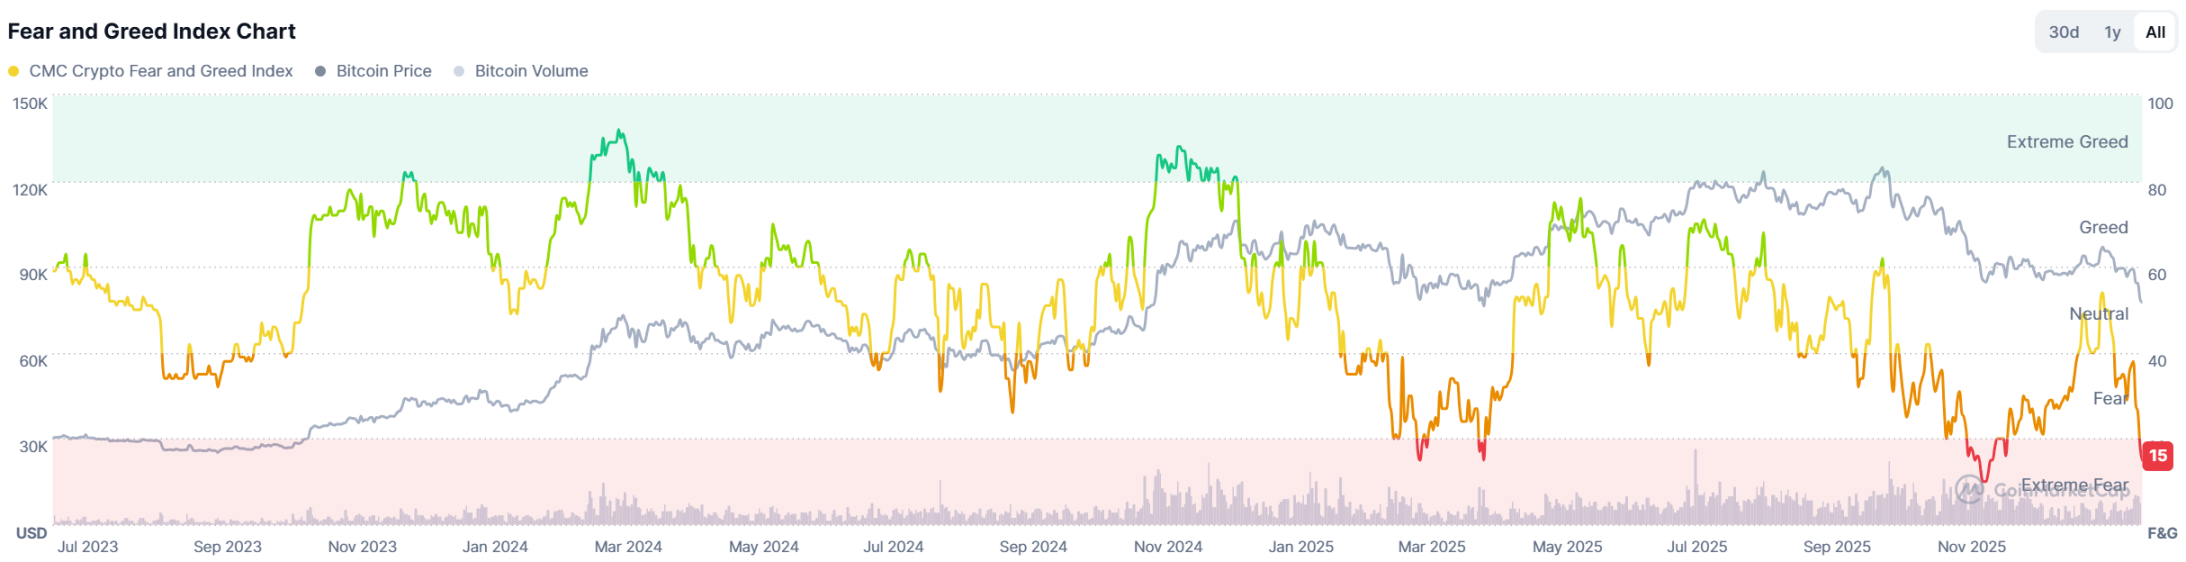
After the market turned bearish, where is BTC's bottom range? Five major data indicators reveal the answer.

Data Survey: 30% of Users Believe BTC's Bottom Range Is Between $60,000 and $75,000

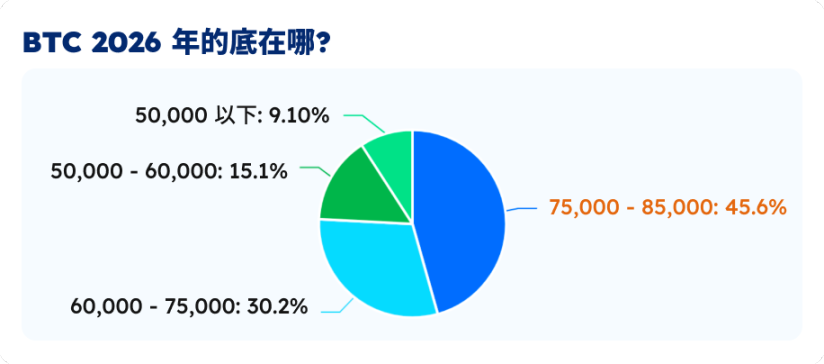
On January 30, Foresight News conducted an investor market confidence survey. At the time of the survey, BTC was priced at $84,000. It has since fallen significantly over the following days, so the survey results are for reference only.

The poll (with 1,189 participants) showed that most respondents (45.6%) believe BTC's bottom price in 2026 will be between $75,000 and $85,000. Another 30.2% of respondents believe the bottom price will be between $60,000 and $75,000.
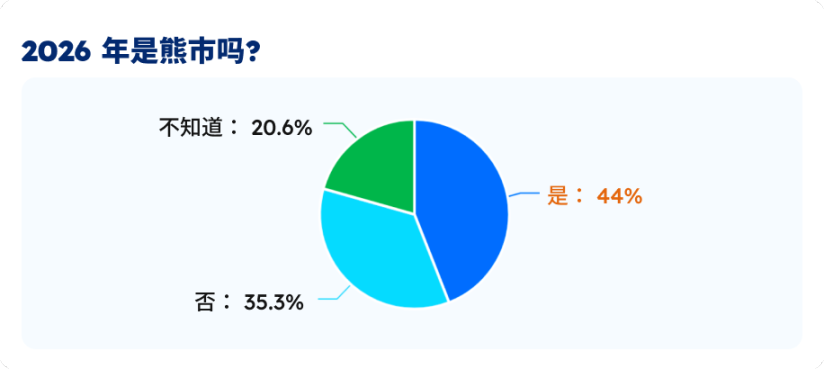
44% of respondents believe 2026 will be a bear market, while 35.3% disagree and do not think it will be a bear market. Another 20.6% of respondents are uncertain.
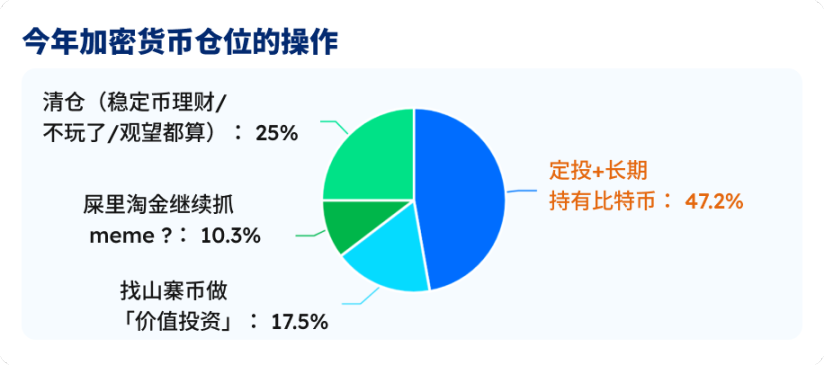
Nearly half of the respondents (47.2%) choose to dollar-cost average and hold Bitcoin long-term. Another 25% of respondents choose to liquidate their positions and switch to stablecoin investments or wait and see. 17.5% of respondents are looking for altcoins for value investing.
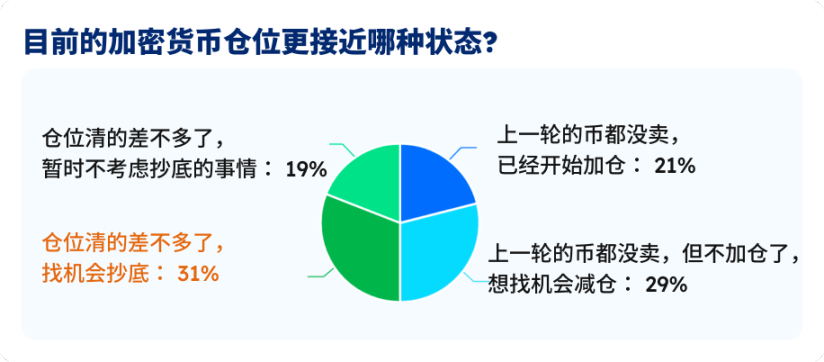
Currently, among the voting respondents, 31% say they have mostly cleared their positions but are still looking for opportunities to buy the dip. 29% say they haven't sold their holdings from the last cycle but are not adding positions for now and are looking for opportunities to reduce them. 21% say they haven't sold their holdings from the last cycle and have already started adding positions.
Glassnode Shows BTC's On-Chain Cost Basis Is $55,900

As Bitcoin falls below $78,000, Glassnode has updated the key on-chain price distribution as follows: The STH (Short-Term Holder) cost basis, reflecting the average holding price of new buyers/traders who entered the market in recent months, is $95,400.
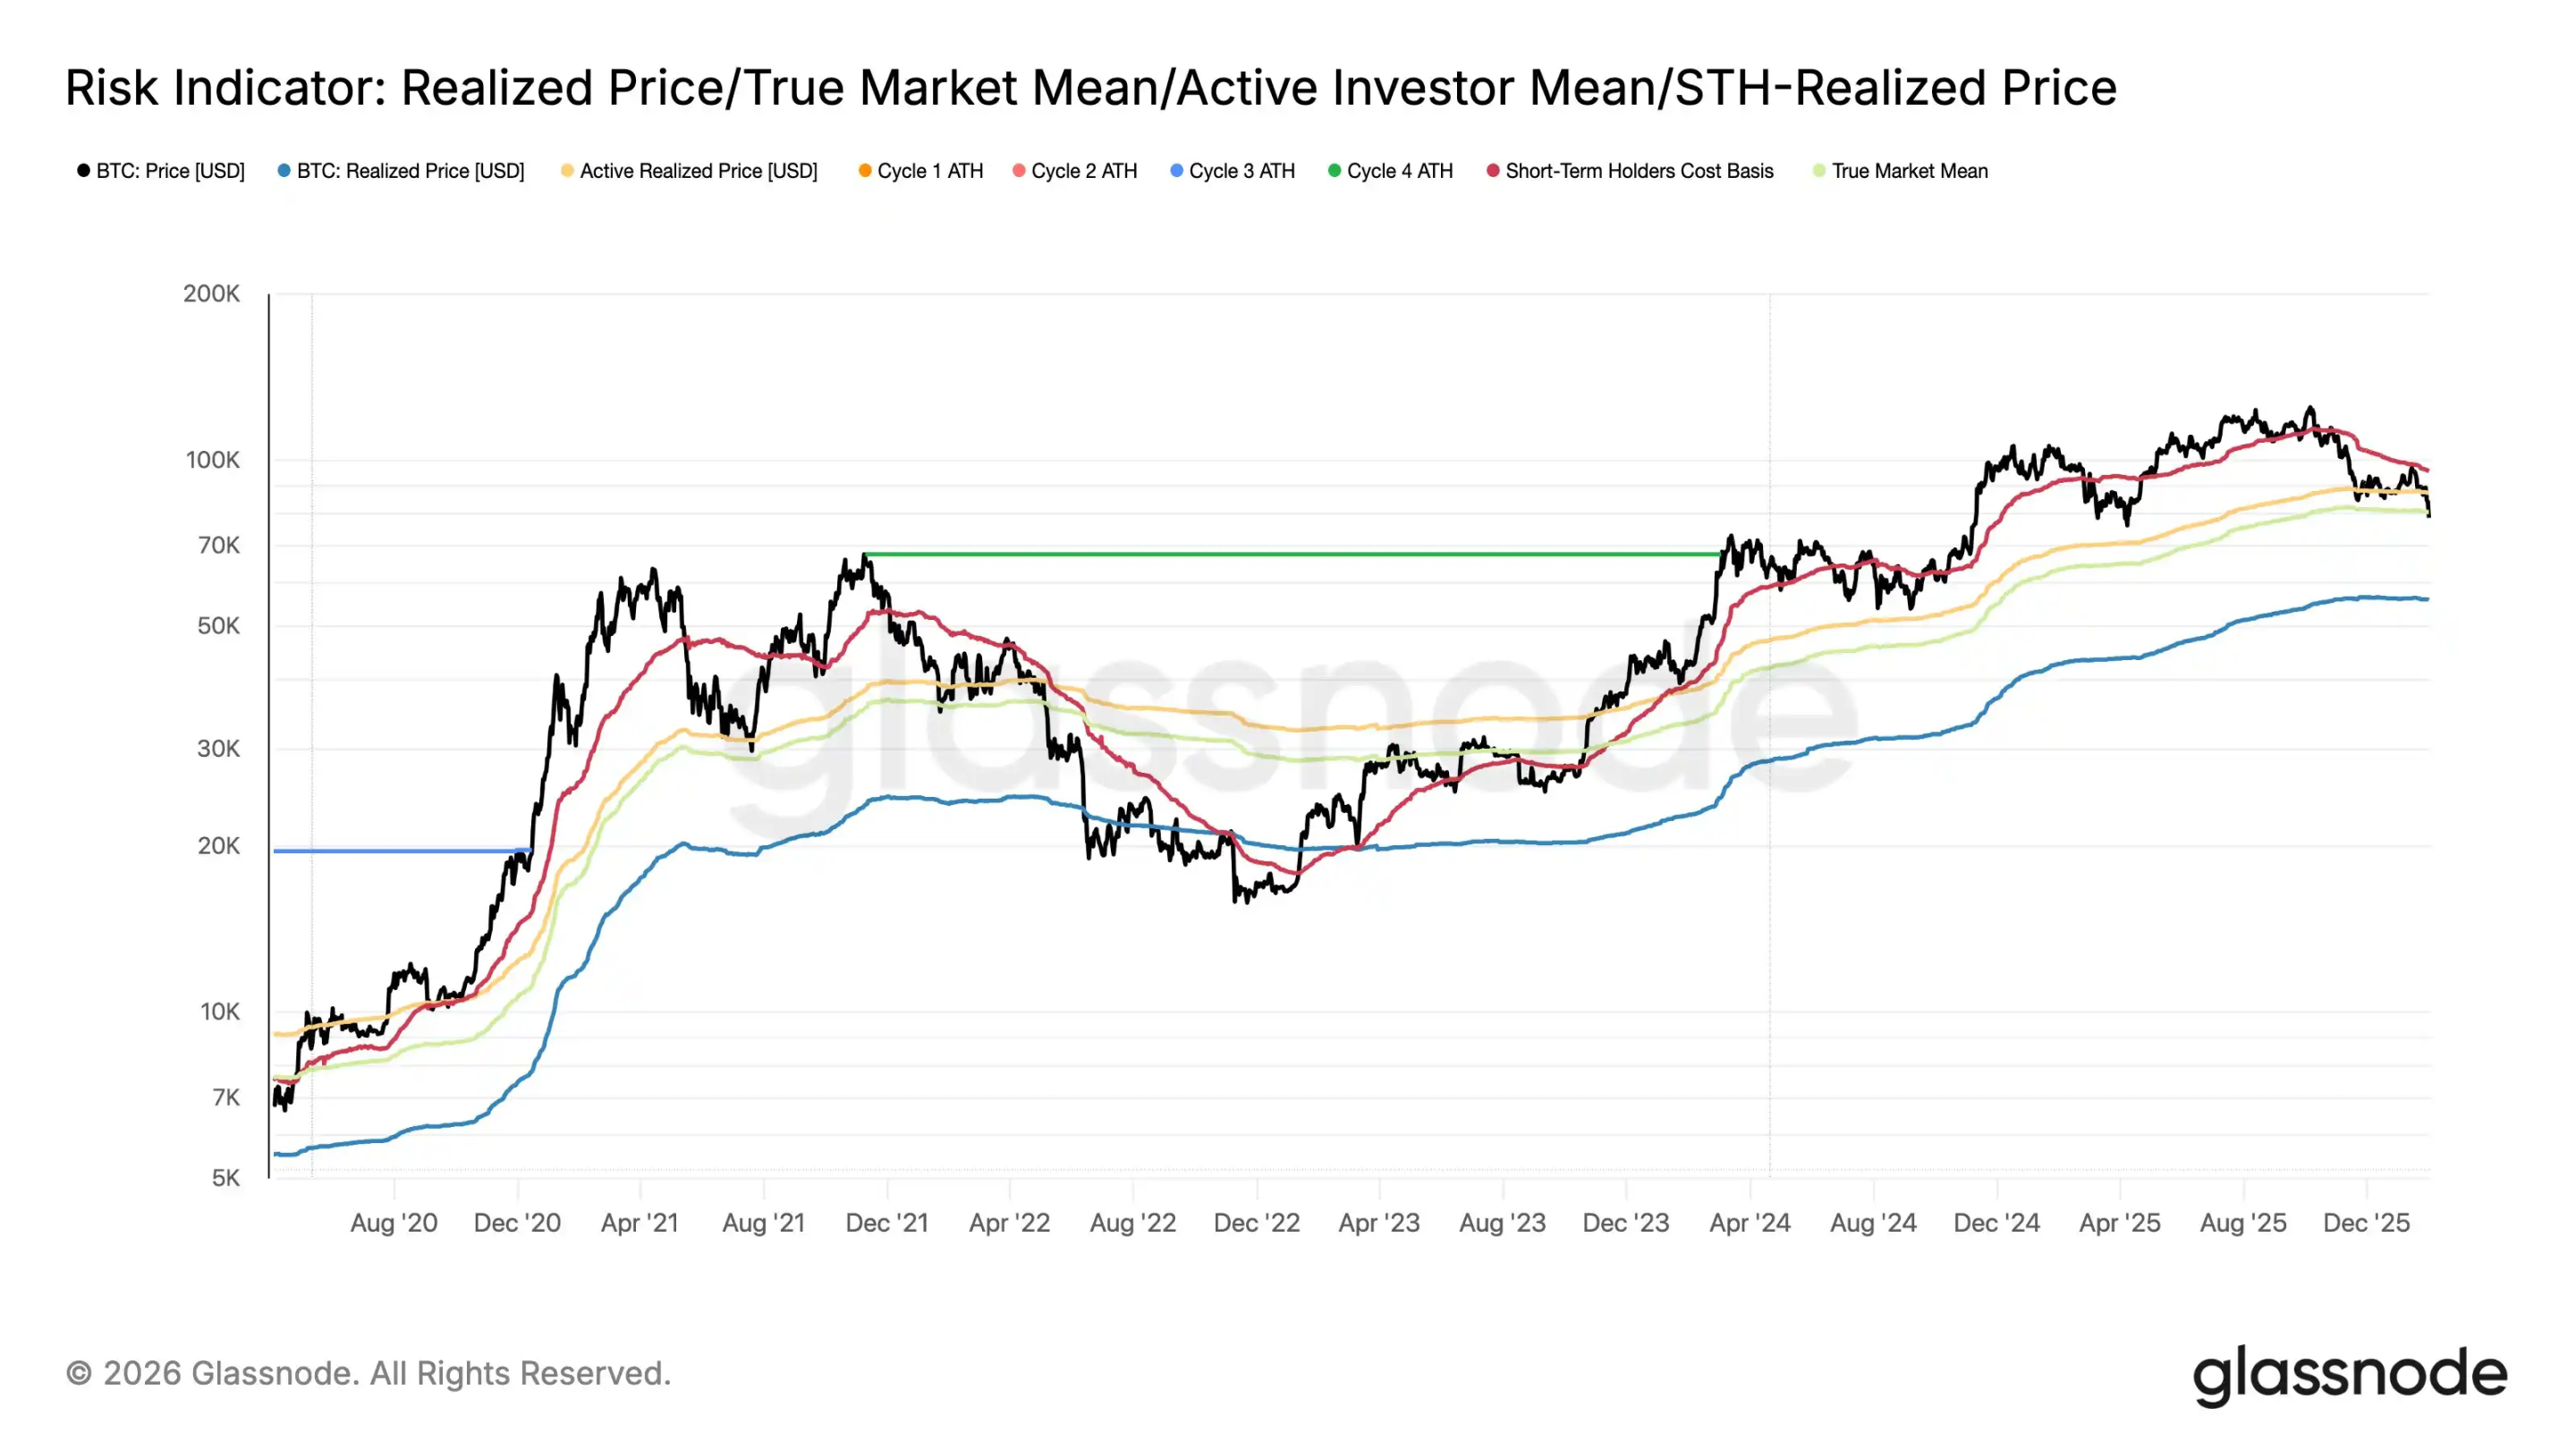
The average investment of active investors, representing the average holding cost of traders currently "on the field," is $87,300; the Realized Price, focusing on the cost basis of actual traders in the secondary market, is $80,500. The Coin Price, representing the average cost basis of all coins across the entire network, is $55,900.

This means that when the BTC price is below $80,500, your purchase price is lower than the cost price of other recent traders. If BTC falls below $55,900, it means your purchase price is already below the average cost of the entire network.

In the 2022 cycle, the BTC price once fell below the entire network's average cost basis. In this cycle, influenced by macro liquidity, spot ETFs, and other factors, whether BTC will fall below $55,900 remains unknown.

Ahr999 Indicator Shows Accumulation Signal

The ahr999 indicator was invented years ago by Weibo user ahr999 to evaluate BTC's short-term returns and price deviations. The calculation formula is (Current Price / 200-day Dollar-Cost Average) × (Current Price / Exponential Growth Valuation), where the exponential growth valuation is based on a fitting curve of historical prices and block height, representing the long-term "fair value." Historical experience shows: ahr999 1.2 is the high-price zone.
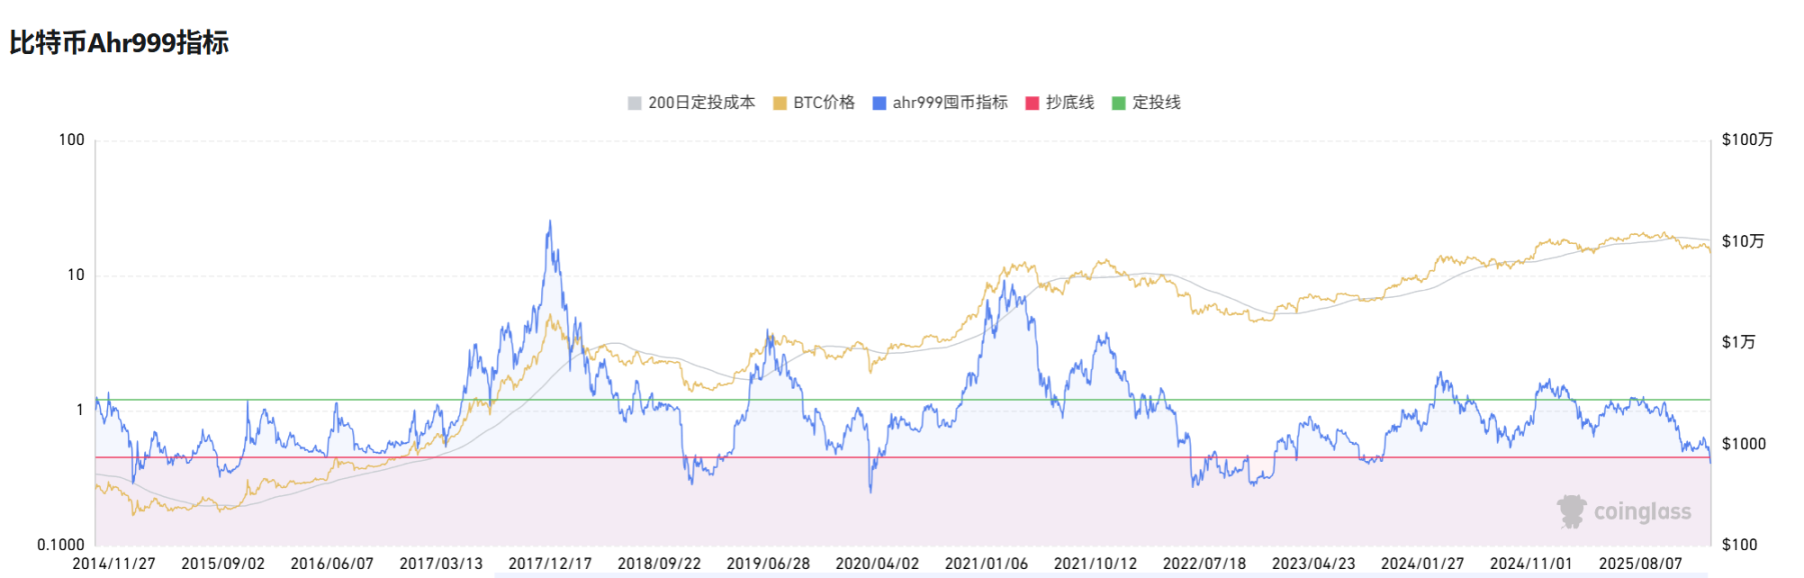
On February 1, 2026, ahr999 fell below 0.45 for the first time, the first occurrence in 839 days since October 16, 2023, marking a potential market bottom. The current break below the threshold suggests the BTC price is significantly below long-term growth expectations, similar to the end of the 2023 bear market. This signal strongly suggests buying the dip, but it needs to be confirmed with trading volume to avoid false breakouts. Buying strategy: If ahr999 stabilizes below 0.45, consider buying in batches below $76,000, and reduce positions when it rebounds above 1.2.

Willy Woo Indicator Shows BTC's Hard Bottom Is $45,000

The indicator developed by renowned analyst Willy Woo is the CVDD model. "When Bitcoin transfers from an old investor who bought at $1 to a new investor who buys at $100,000, the new investor will value these Bitcoins with a higher floor price, which helps raise the perceived floor price of the entire Bitcoin supply globally. Active custodian rotation (i.e., frequent transfers of Bitcoin between different investors or custodians) may also indicate that investors value these Bitcoins highly."

When many whales transfer BTC to new Bitcoin wallet addresses, the market's bottom price is rising.
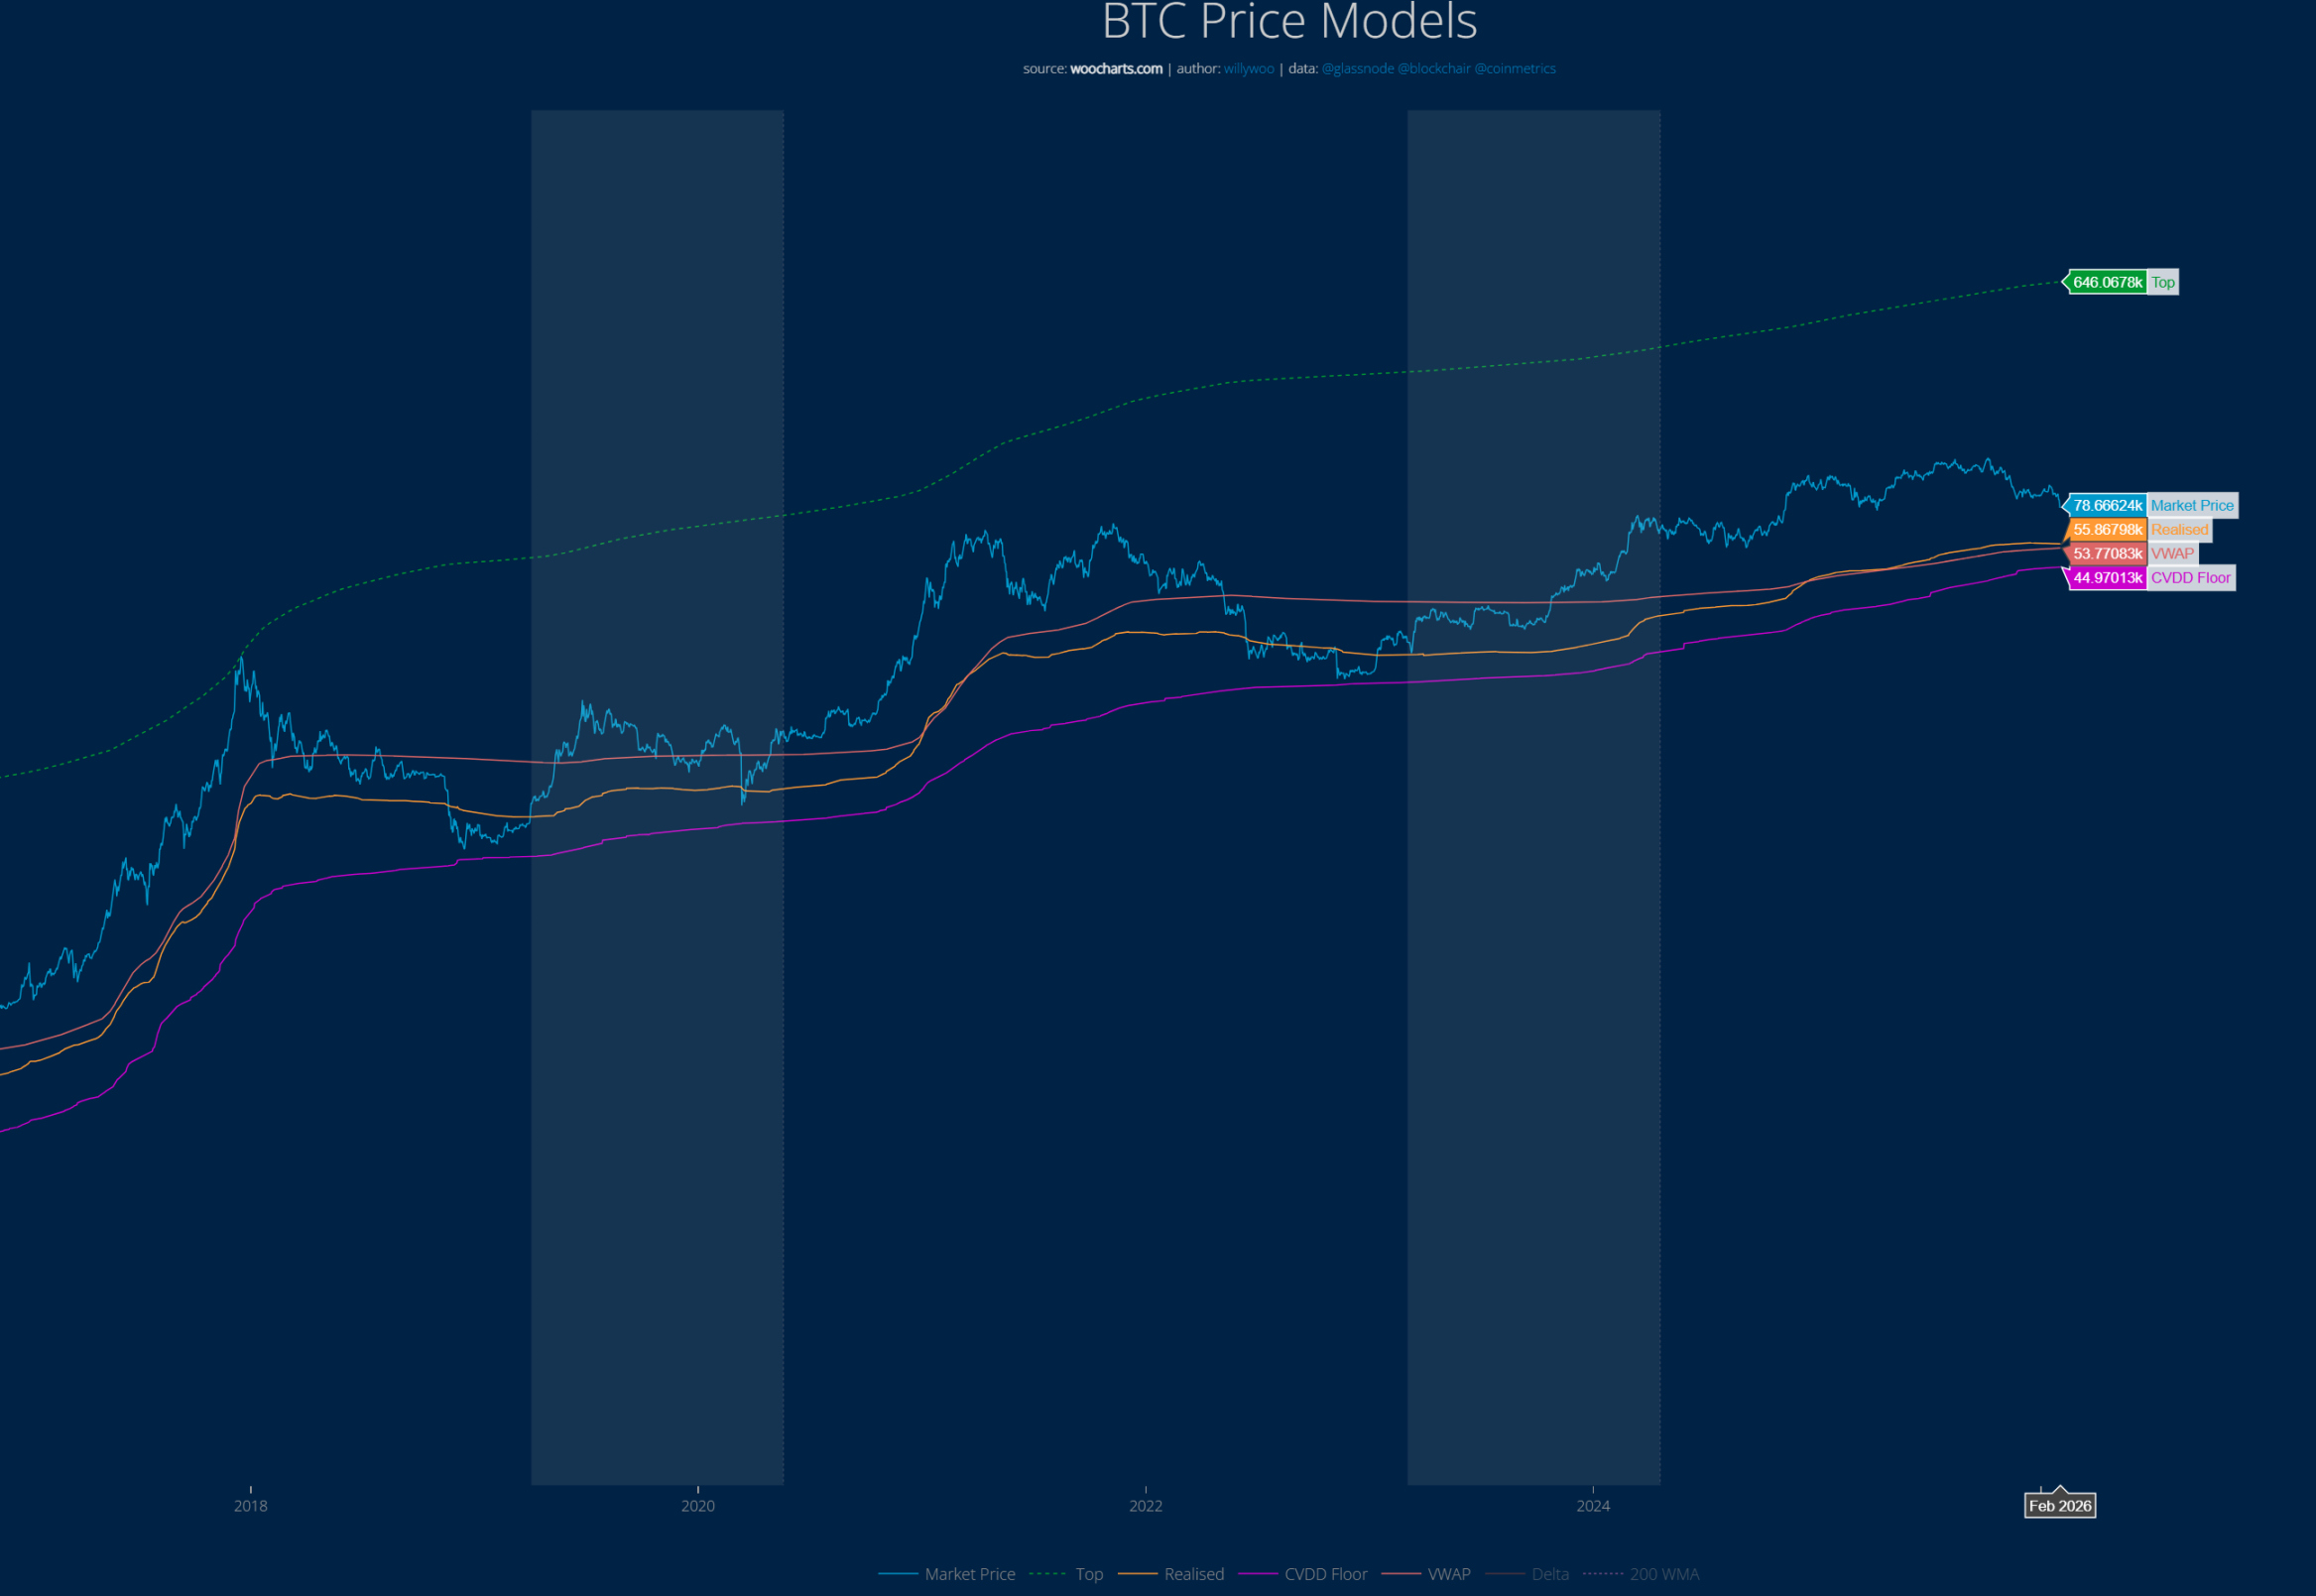
The BTC price has never fallen to the red line (CVDD model). Currently, the CVDD indicator shows a hard bottom of approximately $45,000. In past cycles, BTC once fell below the yellow line in the chart, which currently ranges from $53,000 to $56,000.

Strategy's Bitcoin Cost Price Is $76,040

As of February 2, the well-known Bitcoin accumulation大户 (large holder) Strategy holds a total value of approximately $54.2 billion, with 712,647 BTC. Their average holding cost is about $76,040.
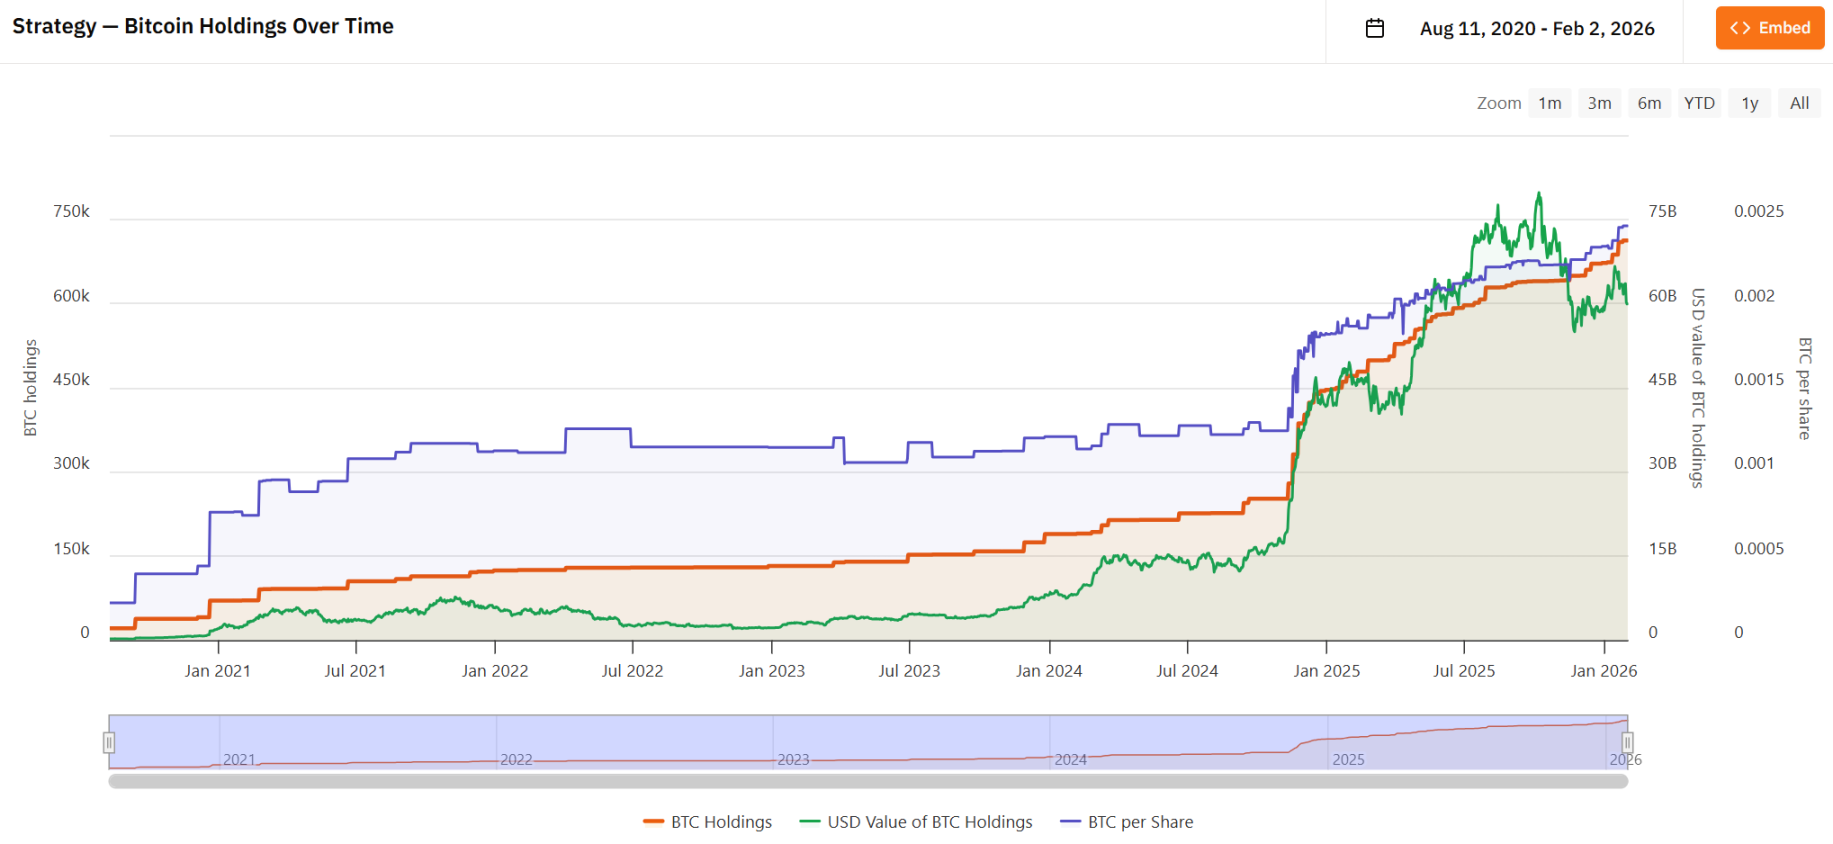
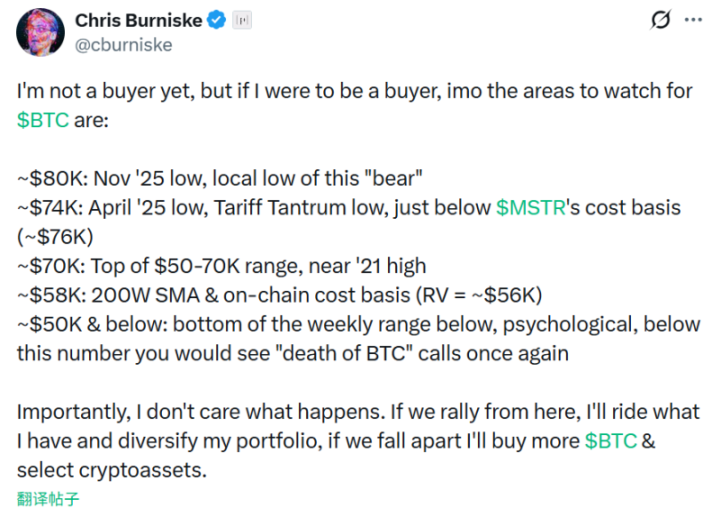
Historically, the area below this average cost has been the bottom range. Placeholder partner Chris previously stated that the $74,000 to $76,000 range is a price line worth paying close attention to.

Twitter:https://twitter.com/BitpushNewsCN

Bitpush TG Discussion Group:https://t.me/BitPushCommunity

Bitpush TG Subscription: https://t.me/bitpush

Original link:https://www.bitpush.news/articles/7608002

Domande pertinenti

QWhat is the current market sentiment according to the Fear & Greed Index mentioned in the article?

AThe market sentiment is at 'Extreme Fear', with a Fear & Greed Index reading of 15.

QAccording to the ahr999 indicator, what is the signal for a potential market bottom and when did it last occur?

AThe ahr999 indicator falling below 0.45 is a signal for a potential market bottom. This last occurred on February 1, 2026, which was the first time in 839 days since October 16, 2023.

QWhat is the 'iron bottom' price for Bitcoin as indicated by Willy Woo's CVDD model?

AWilly Woo's CVDD model indicates an 'iron bottom' price for Bitcoin at approximately $45,000.

QWhat is the average on-chain cost basis for the entire Bitcoin network, as provided by glassnode?

AThe average on-chain cost basis for the entire Bitcoin network is $55,900.

QWhat price range did the majority of respondents in the Foresight News survey believe would be the bottom for BTC in 2026?

AThe majority of respondents (45.6%) believed the bottom price for BTC in 2026 would be in the range of $75,000 to $85,000.

Letture associate

Double Long Hynix ETF Plummets, Halved and Halved Again

On July 29th, shares of South Korean semiconductor firm SK Hynix plummeted over 19% intraday, marking its largest single-day drop on record. The Hong Kong-listed "CSOP SK Hynix Daily Leveraged (2x) Product" (Stock Code: 07709) tumbled more than 28% intraday before closing 13.99% lower at HK$32.70. This leveraged product, designed to deliver twice the daily return of SK Hynix, has seen a catastrophic decline of over 80% from its June 25th high of HK$193.65, far exceeding the underlying stock's roughly 50% drop from its peak. Its assets under management have shrunk dramatically, falling over 70% from a high of HKD 130 billion in June to approximately HKD 31.9 billion. This steep sell-off occurred despite SK Hynix reporting stellar Q2 2026 earnings, with revenue and operating profit surging 257% and 557% year-over-year, respectively. However, the results fell short of market expectations. Analysts cited concerns about potential oversupply from expansion and noted that long-term supply agreements for its high-bandwidth memory (HBM) chips might limit near-term price increases. In response to heightened volatility and regulatory changes, the product's issuer, CSOP Asset Management, announced a transition to a "flexible leverage mechanism" starting August 3rd. Under new Hong Kong SFC rules, the fund's daily leverage multiplier can now be dynamically adjusted between 1.1x and 2x (or -1.1x to -2x for inverse products) based on market conditions, moving away from a fixed 2x target. The fund's name will also be changed to clarify its nature as a daily trading tool unsuitable for long-term holding. Experts warn that this change means investors can no longer assume constant 2x returns and must check the disclosed leverage ratio daily.

marsbit10 min fa

Double Long Hynix ETF Plummets, Halved and Halved Again

marsbit10 min fa

A7 Discusses Accumulated Experience in Using Stablecoins

The Russian State Duma and Federation Council have passed the "Law on Digital Currencies and Digital Rights," which is set to expand the use of stablecoins in cross-border trade settlements starting September 1, 2026. According to the Bank of Russia, exporters and importers will be able to use cryptocurrency in international payments, both directly and through intermediaries, while domestic crypto payments will remain largely prohibited. Company A7, which facilitates operations with the A7A5 stablecoin—Russia's first ruble-pegged stablecoin classified as a Digital Financial Asset (DFA)—commented on the development. Oleg Ogienko, Director of Government Relations and International Affairs for the A7A5 project, stated that while digital asset settlements are still a new practice for many firms, A7 has already accumulated significant expertise in legal documentation, compliance, currency control, and working with infrastructure participants. He added that A7 will continue to apply this expertise for client operations after the law takes effect and will adapt its business processes as the Central Bank issues further regulations. A7 is a Russian international settlement system established in 2024 with participation from PSB Bank. It facilitates cross-border payments and supports foreign trade operations for Russian businesses. Its key instrument, the A7A5 stablecoin, operates on the Tron and Ethereum networks with a market capitalization exceeding $567 million and is circulated in Russia as a DFA via the "Token" platform.

cryptonews.ru24 min fa

A7 Discusses Accumulated Experience in Using Stablecoins

cryptonews.ru24 min fa

Trading

Spot
活动图片