Author: Frank, PANews
After the sharp downturn in the crypto market on October 11th, the market seems to have entered a prolonged "cooling-off period." For most investors, rather than predicting price movements, it might be more important to understand how much the current market liquidity has recovered since the heavy blow on 10.11. Additionally, how do the dominant funds in the market view the future direction?
In response, PANews attempts to analyze the current capital structure of the market through several data points, including order book depth, the options market, and stablecoins. The final conclusion is: the market does not seem to have truly recovered; instead, it has fallen into a state of structural fragmentation with continuously diminishing liquidity and accelerated defensive moves by institutional funds.
Micro Liquidity: Fragile Balance and Disappearing Support Orders
To understand the current liquidity situation, the order depth difference is the most direct indicator.
Taking the depth chart of the Binance BTC/USDT perpetual trading pair as an example, it is clear that since October, the depth of the buy order book has been decreasing, dropping from previously普遍 above $200 million to the $100–200 million range. The depth of sell orders has similarly decreased significantly, remaining below $200 million.
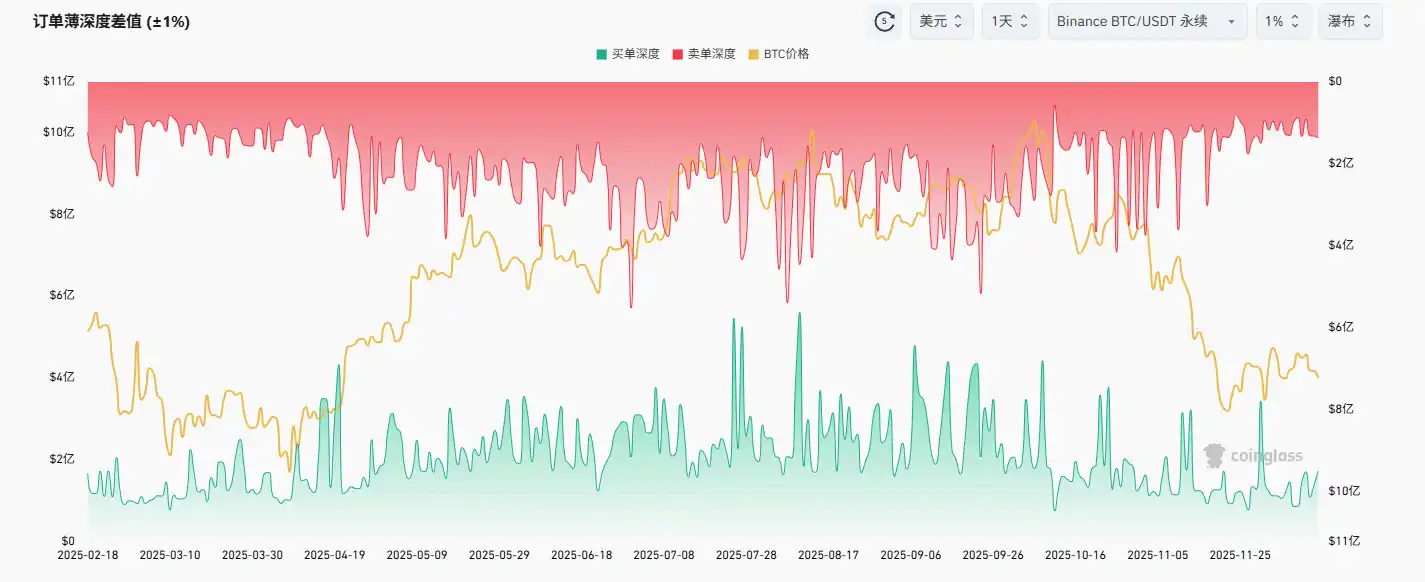
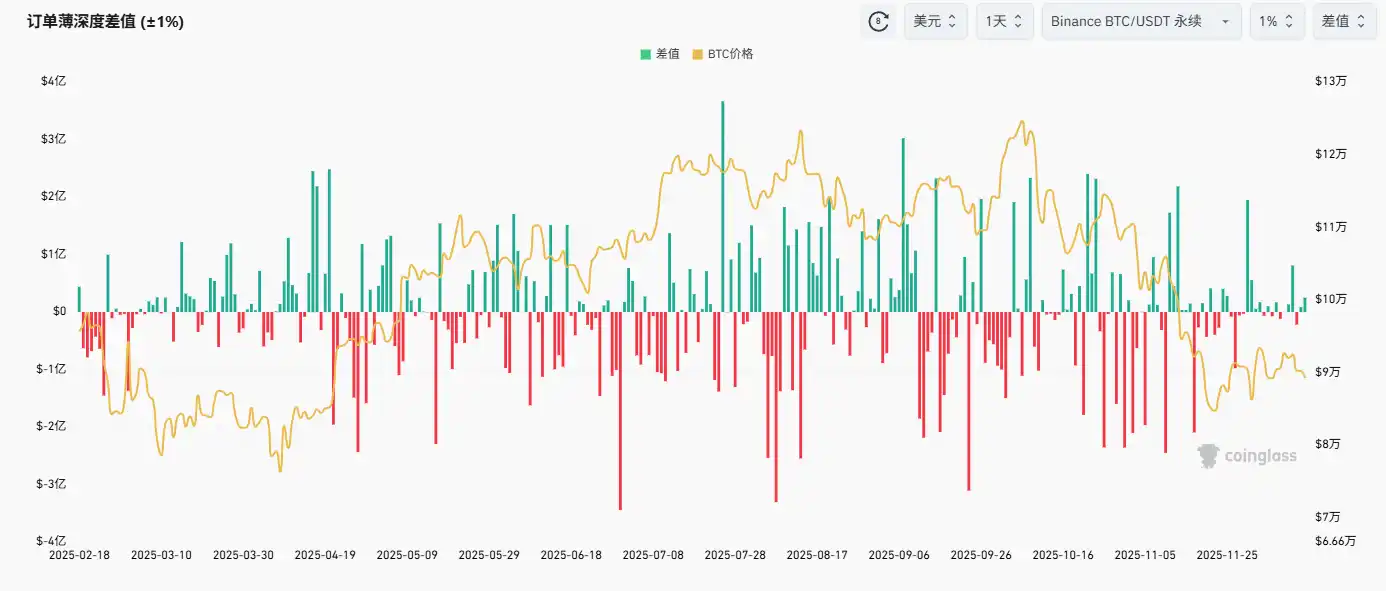
In terms of the difference, the gap between long and short order depths has recently become more balanced, with the difference on many days in November being only around $10 million. These data indicate that the entire market has entered a state of relative balance between long and short positions, but with continuously diminishing liquidity.
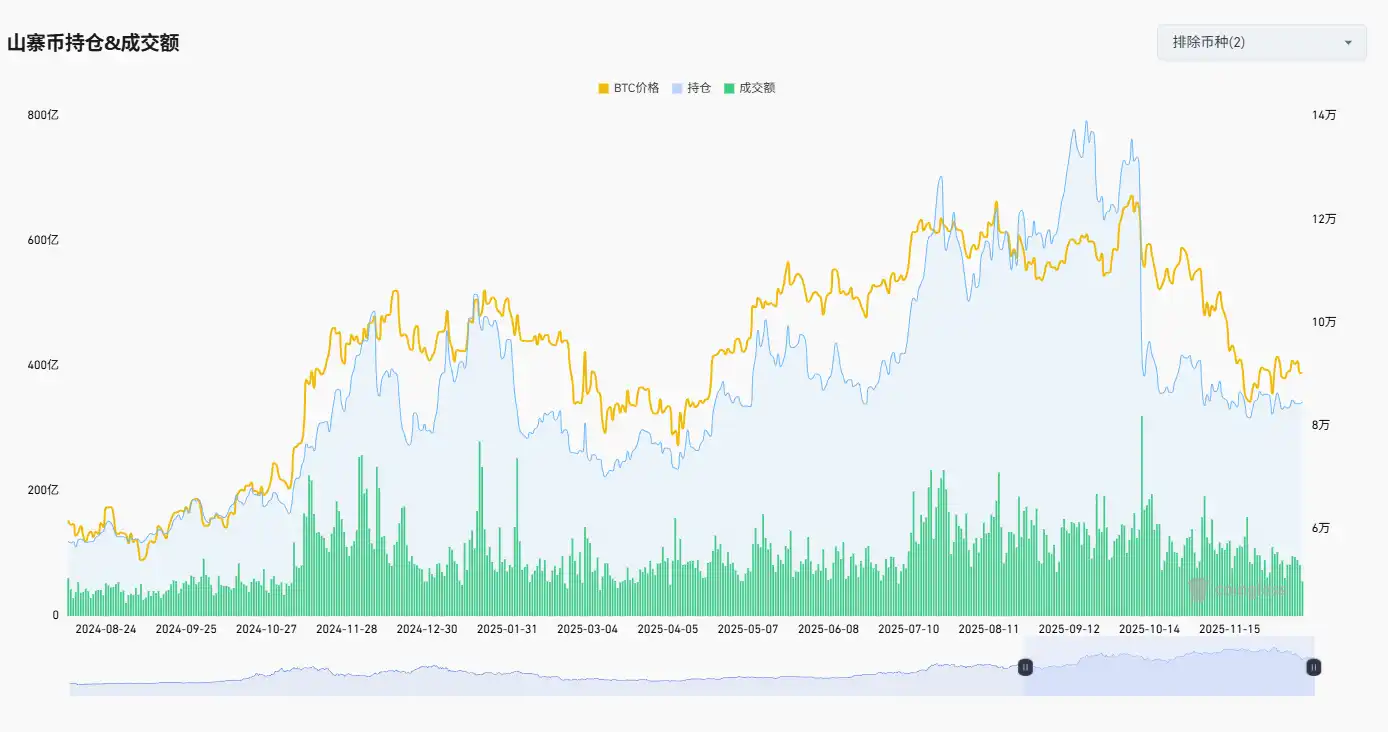
In terms of open interest, the total open interest of altcoins (excluding BTC and ETH) has not shown growth as prices hit lows but has instead also been declining. In contrast, the entire market experienced a deep correction in April, but at that time, after prices hit lows, the market's open interest saw a significant rebound (and this rebound even occurred提前 before prices reached the lowest point).
At the same time, the trading volume in the altcoin futures market is also shrinking, with no significant increase in volume triggered by bottom-fishing. From these data, the altcoin market seems to have entered a state of neglect.
Options Market: Retail Buys Lottery Tickets, Main Players Bet on Decline
Another set of data is quite interesting. The crypto options/crypto futures open interest ratio shows that the proportion of BTC options has been soaring since the beginning of the year, even exceeding 100% at its peak, and currently remains around 90%. Before this, the proportion of BTC options had long been maintained at around 60%. In other words, the BTC market has completely shifted from being dominated by futures contracts to being dominated by options contracts. However, the crypto options/crypto futures open interest ratio for ETH has dropped to a very low level this year, around 30%.
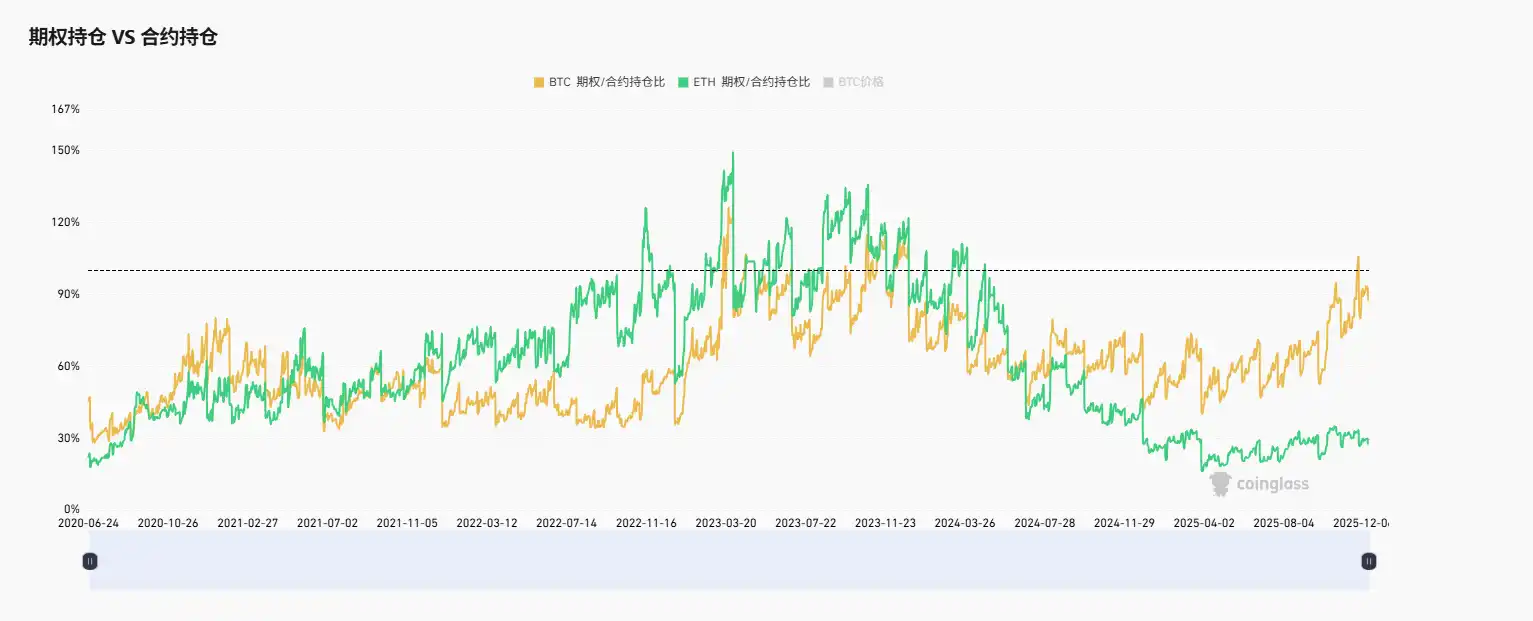
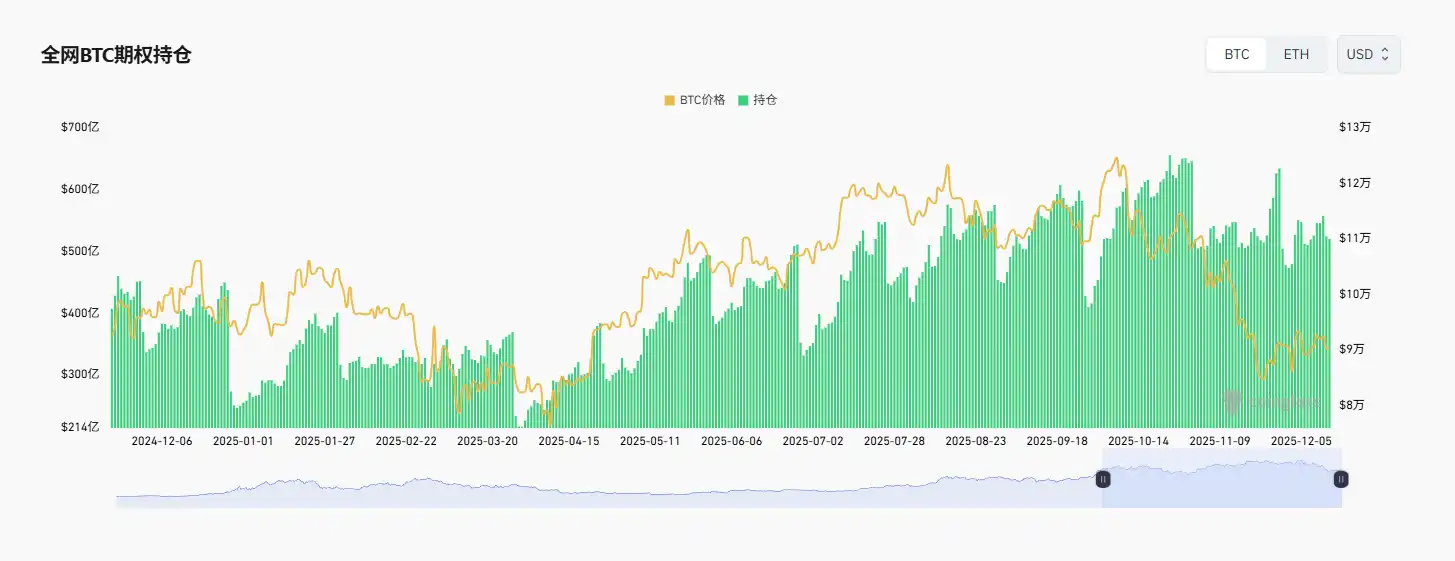
Behind this data, two issues are confirmed. One is that the dominance of the BTC market has been completely seized by institutions and hedge funds, while ETH and other altcoins no longer seem to be trading options for these institutions and hedge funds. Another key point is that in predicting the BTC market, options market data has become more important. We can also see this trend from the total open interest of BTC options; even as prices fall, open interest remains high.
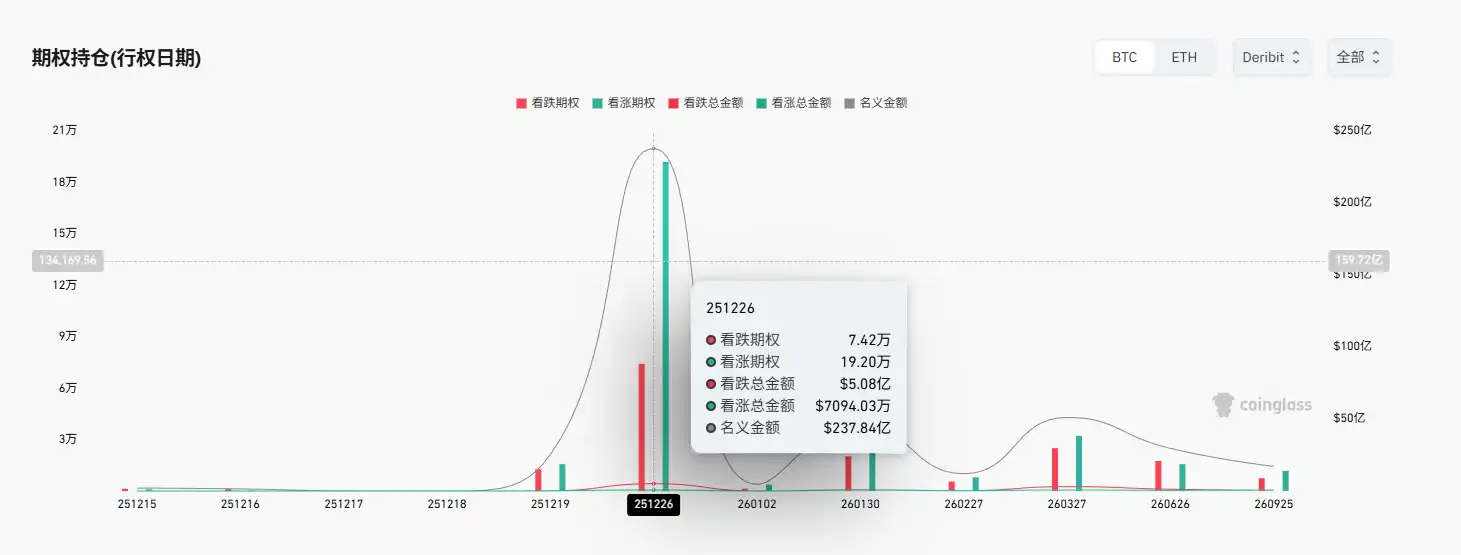
Therefore, options expiration dates and max pain points have become important reference indicators for the current BTC market. According to current data, the next important options expiration date is December 26th. At this point, the total volume of call options reaches 192,000, while the total volume of put options is only 74,200. However, the total notional value of these put options is as high as $508 million, while the total notional value of call options is only $71.25 million. This inverted data indicates that current call options are very cheap (about $370), while put options are very expensive (up to $6800).
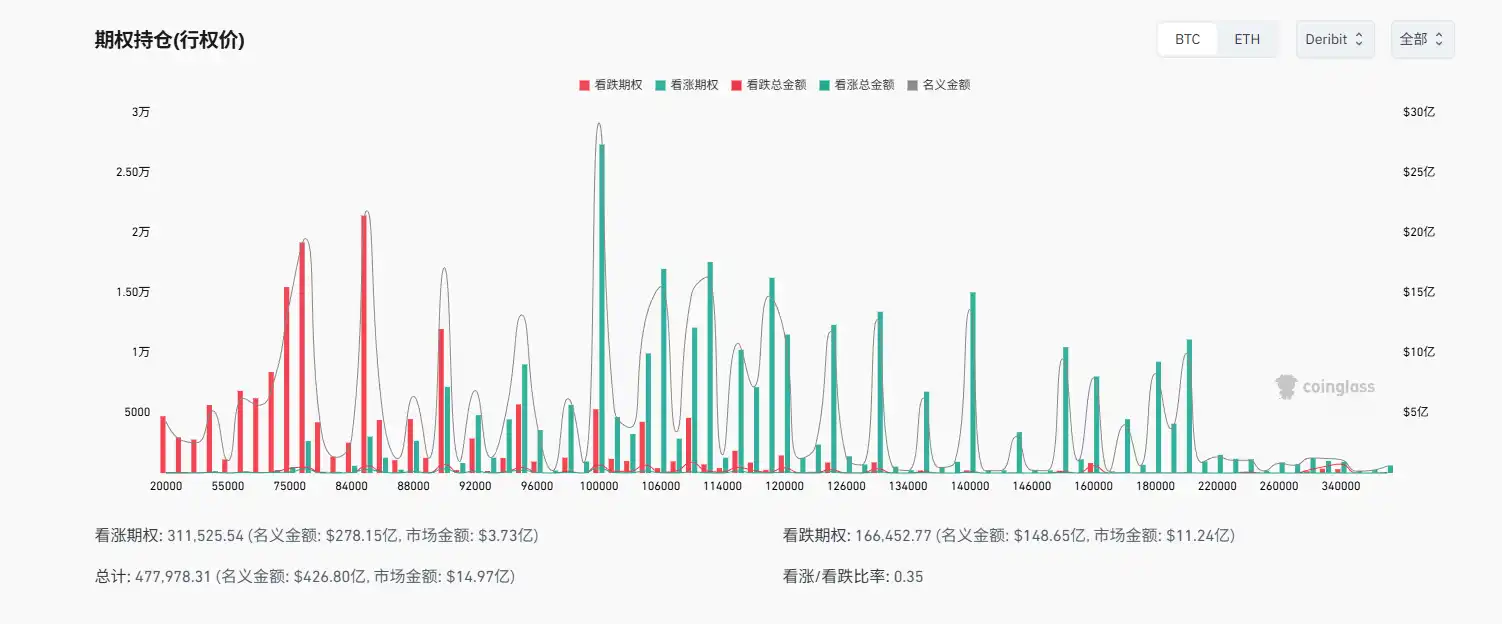
Combined with the distribution of strike prices, we can see that most call options are distributed above the $100,000 price, which makes it very unlikely that these options will be exercised on December 26th. Therefore, although the number of call options is large, they are more偏向于 "lottery ticket"-style speculative targets. A large number of put options have strike prices concentrated at $85,000 and below. At the same time, the market value of put options reached $1.124 billion, while the market value of call options was only $373 million (the premium paid by investors to purchase options). In summary, although there are more people betting on a rise,实际上 more funds (about 75%) are betting on or hedging against a decline.
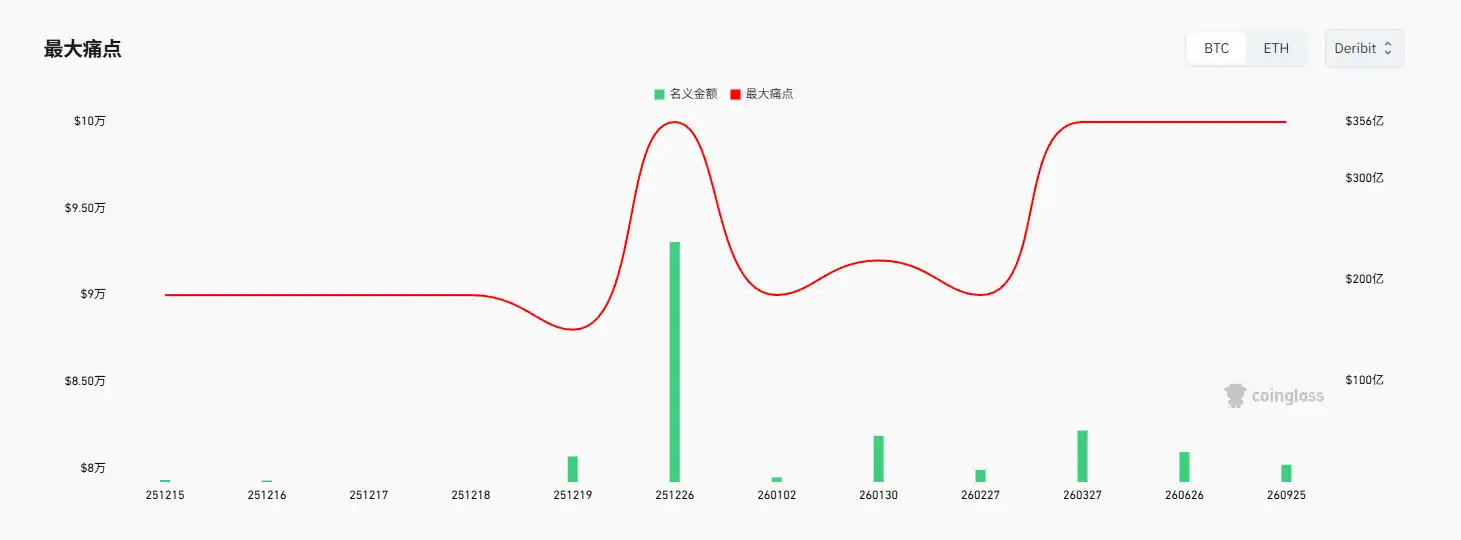
Additionally, the current max pain point is the $100,000 mark. This also indicates that the $100,000 price may become the focus of competition between option sellers and buyers this month. For market makers (option sellers), they are likely the main bulls in the current market; as long as the price can be pushed to around $100,000, they will be the biggest winners.
However, for institutions that have heavily invested in purchasing put options, most may be hedging against the downside risk of their spot holdings. Although本质上 they are mostly defensive in choosing to bet on a decline, the fact that they still put funds into put options despite the high cost indicates that their sentiment towards the future market trend is significantly pessimistic.
Stablecoins: Compliant Retreat, Hot Money Watches and Waits
Besides options data and order book data, stablecoin data is also an important indicator for judging current market liquidity and direction. Especially the flow of stablecoins to exchanges. However, this data also reveals significant divergences in the market.
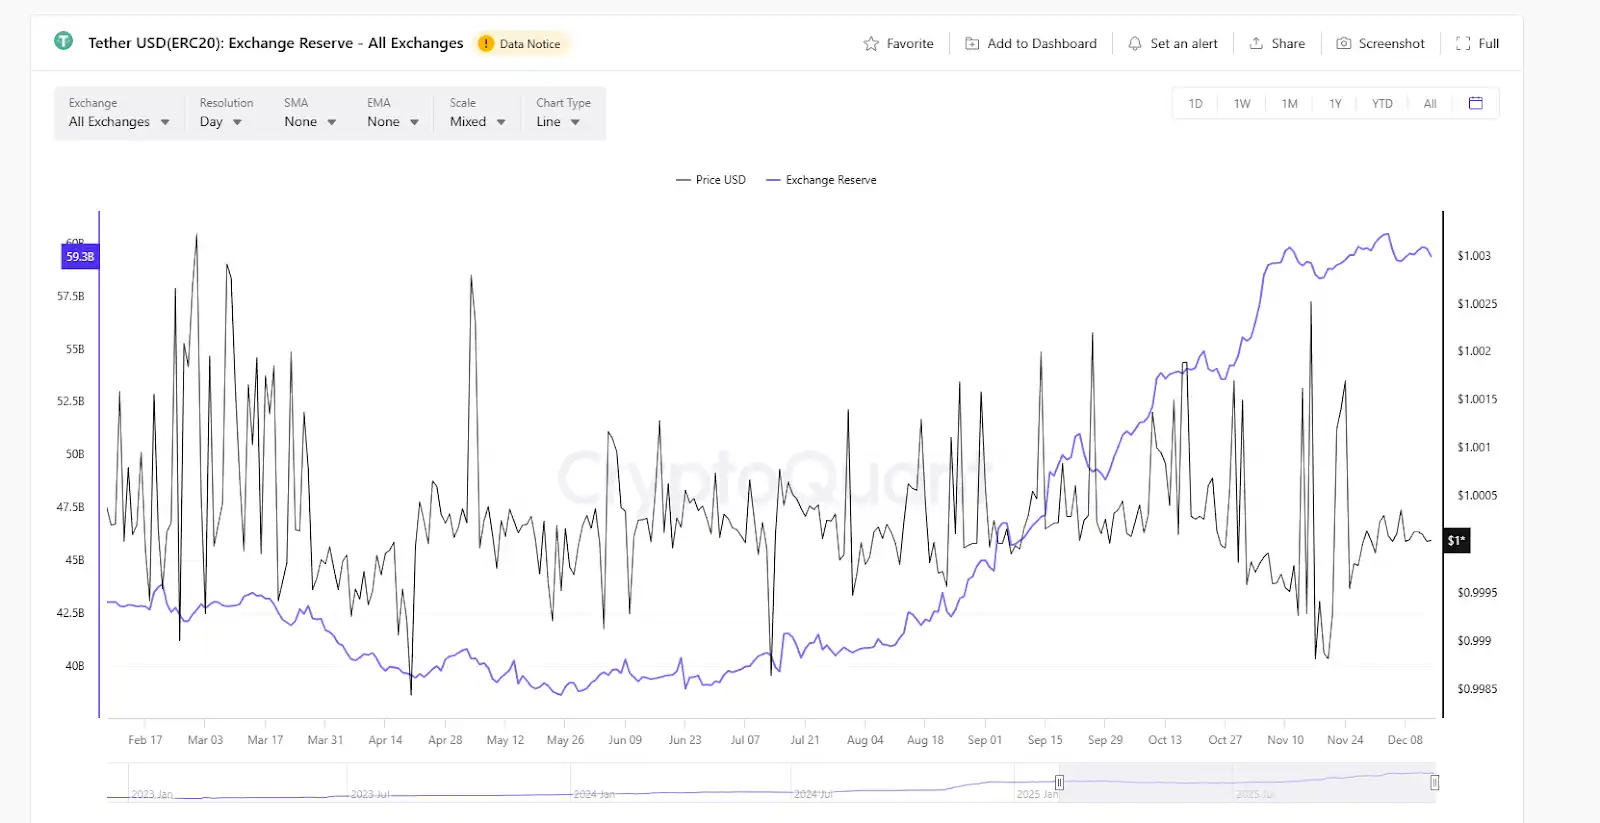
According to CryptoQuant data, the exchange reserves of USDT have been on an upward trend this year and have maintained this momentum recently. On December 4th, USDT reserves on exchanges reached a historical peak of $60.4 billion. And they currently remain near the high of $60 billion. As the main pricing benchmark for non-compliant exchanges within the market, the continuous growth of USDT exchange reserves indicates that a large amount of speculative capital remains in a state of betting or preparing to buy the dip. Combined with the current decline in open interest, it can be felt that a large amount of speculative capital is in a wait-and-see mode.
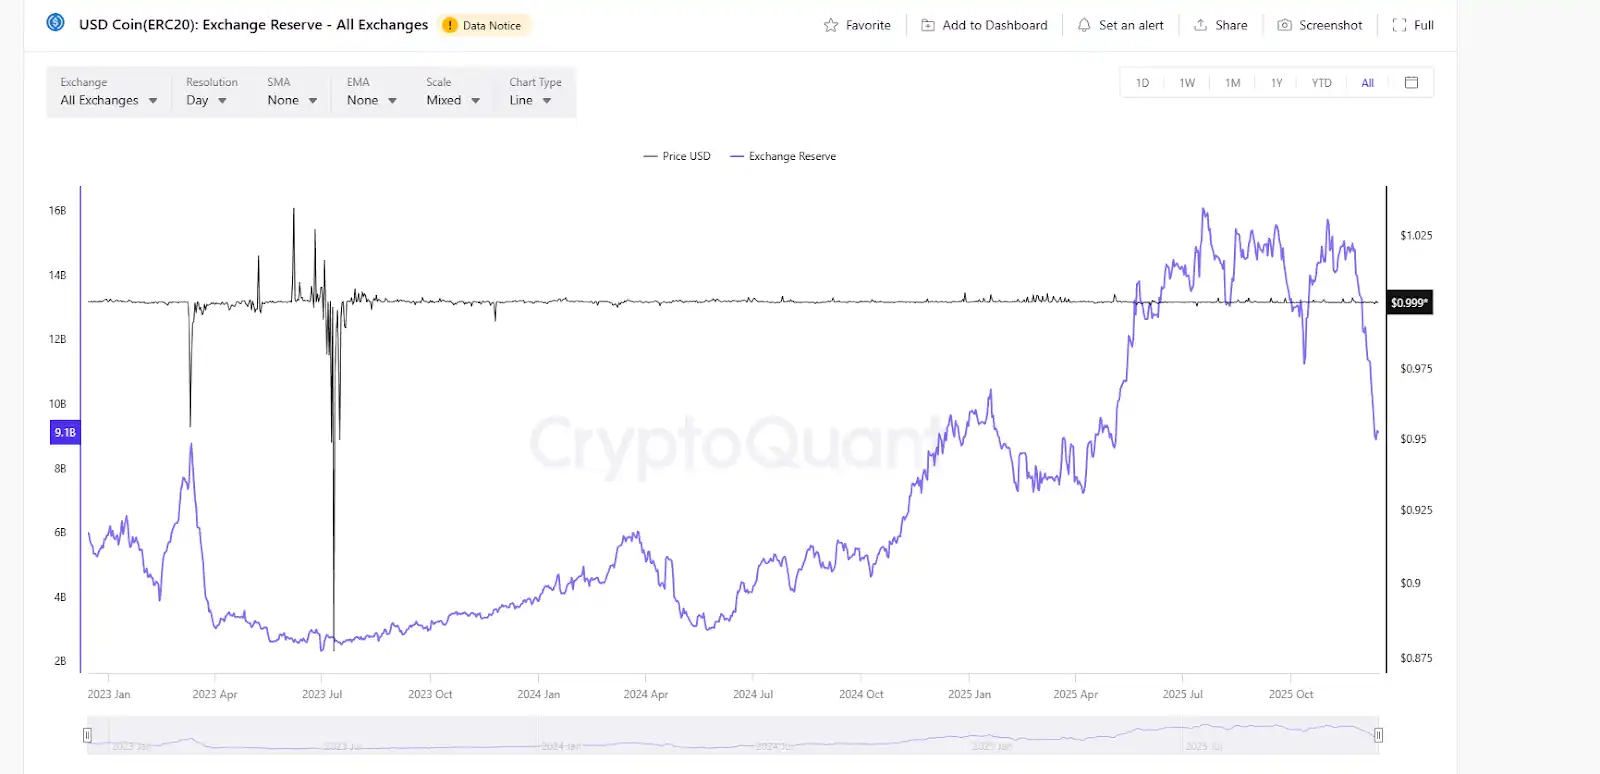
USDC shows a completely different picture. Since the end of November, a large amount of USDC has been withdrawn from exchanges, with exchange reserves plummeting from $15 billion to around $9 billion, a drop of 40%. As the leading compliant stablecoin, USDC's main users are来自 US institutions, compliant funds, etc. They are the representatives of the institutional faction in the market. Currently, it is clear that this group is accelerating their exit.
From the contrasting changes of these two, the current market seems to have retail investors and hot money waiting to buy the dip, while compliant institutions are retreating. This point also forms a similar conclusion to the changes in the BTC options market described earlier. Of course, another possibility is that under the downward risk of the market, a large amount of funds are converting crypto asset holdings into stablecoins for避险.
In fact, there are far more data and indicators to judge the market than those mentioned above, but overall, they almost all lead to similar conclusions. That is, the market after the 10.11 crash has not truly recovered; what we are seeing is a market with insufficient liquidity and significant divergence between main players and retail investors. Retail investors and hot money hold筹码观望 within the market, while compliant institutions or main funds are accelerating their withdrawal on the spot side and building short defenses in the options market by paying high premiums.
The current market does not seem to be a bottom gathering momentum for a takeoff, but更像 a defensive battle of "institutions exiting, hot money gambling." At this time, paying attention to whether the institutional defense line below $85,000 is breached is far more practical than expecting a breakthrough above $100,000.


