Mapping Out The 4.5X Move That Will Send Dogecoin To New All-Time Highs

bitcoinistPubblicato 2026-01-13Pubblicato ultima volta 2026-01-13

Introduzione

Dogecoin's technical structure is stabilizing after recent volatility, with analysis pointing to a potential major bullish continuation based on historical patterns. A long-term 6-day candlestick chart analysis reveals a consistent pattern of higher lows since 2024, similar to cycles dating back to 2016. This trend of ascending support levels suggests the macro trend remains intact and supportive of future price increases, with current support holding above $0.13. The analysis projects that this consolidation could resolve in a significant upward move, similar to historical breakouts. A rally of approximately 369% from current levels would push Dogecoin back to its all-time high of around $0.739. Furthermore, a move of at least 4.5x from the current price of $0.14 is projected, potentially driving the cryptocurrency to a new all-time high above $0.80.

Dogecoin has changed back to its technical structure as the price action digests the recent price rally. After the initial volatility seen earlier in the month, price action has begun to stabilize, and recent technical analyses are evaluating what the larger trend is revealing.

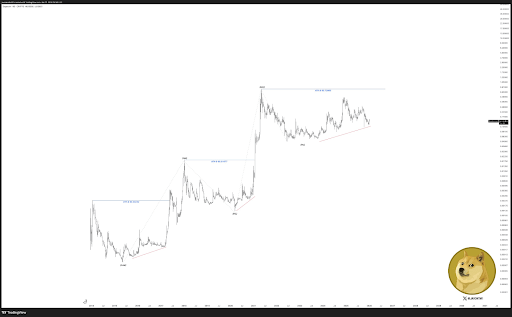
Based on that context, a higher-timeframe technical analysis shared on X by Javon Marks has outlined a scenario that frames the current price action as part of a wider bullish continuation built on repeating historical patterns on Dogecoin’s long-term chart.

Higher Lows Shaping The Trend

Technical analysis of Dogecoin’s 6-day candlestick timeframe chart shows an interesting formation taking place in its price action since 2024, and this goes back to how it traded much earlier cycles stretching as far back as 2016.

The main idea behind this long-term technical analysis is Dogecoin’s ability to maintain a sequence of higher lows throughout different market cycles. The 6-day candlestick chart by the analyst shows that each major pullback in the Dogecoin price over the years has found support along a rising trend line, which has allowed the price to consolidate and reset without breaking the broader structure.

The present setup reflects that same behavior, with recent pullbacks holding above ascending support. Dogecoin’s recent price action is holding above $0.13, and this can be considered a higher low compared to the lows in 2024 and 2025. As long as this pattern of higher lows is intact, then the macro trend can be viewed as supportive of higher prices over time.
Source: X

Projecting A 369% Push Back To The All-Time High

The technical analysis on the chart also shows how earlier periods of consolidations and higher lows eventually resolved into powerful upward moves. Playouts of the previous rallies broke above their previous all-time highs and then created a new all-time high. The first case was a break above the 2014 high of $0.00232 in 2017 to finally end at a new high of $0.01877. This high was then broken again in 2021 to finally reach a new peak, which serves as the current reference level for current price action.

In this case, the reference level is Dogecoin’s all-time high around $0.73905. Based on current price levels, a rally of roughly 369% would be enough to carry Dogecoin back to that zone.

Interestingly, the analysis goes a step further to predict a move past the current all-time high with a move of at least 4.5X from the current price level. Dogecoin’s current price level is trading at $0.14 at the time of writing, and this would put it trading at a price target of at least $0.8 when the move finally plays out.

DOGE pushes lower with decline | Source: DOGEUSDT on Tradingview.com

Crypto di tendenza

Domande pertinenti

QWhat is the main technical pattern identified in Dogecoin's long-term price action that supports a bullish outlook?

AThe main technical pattern is a sequence of higher lows throughout different market cycles, with each major pullback finding support along a rising trend line, indicating a broader bullish continuation structure.

QAccording to the analysis, what price level is Dogecoin currently holding above to maintain the higher low pattern?

ADogecoin is currently holding above $0.13, which is considered a higher low compared to the lows in 2024 and 2025.

QWhat percentage increase is required for Dogecoin to reach its previous all-time high of approximately $0.73905 from current levels?

AA rally of roughly 369% would be required to carry Dogecoin back to its previous all-time high zone of $0.73905.

QWhat is the analyst's predicted price target for Dogecoin if it achieves a 4.5X move from its current price?

AThe predicted price target is at least $0.8 if Dogecoin achieves a 4.5X move from its current price of $0.14.

QWhich previous Dogecoin all-time highs were broken in the analysis to illustrate the pattern of powerful upward moves?

AThe 2014 high of $0.00232 was broken in 2017 to reach a new high of $0.01877, which was then broken again in 2021 to set the current all-time high around $0.73905.

Letture associate

Why Bitcoin Holds Above $64,000 After Fed's Hard Pause

**Bitcoin Stabilizes Near $64,000 Following Hawkish Fed Pause** The cryptocurrency market, led by Bitcoin, remained stable around $64,000 despite a volatile reaction to the latest U.S. Federal Reserve meeting. The Fed paused interest rates but signaled a hawkish stance, with three committee members voting for an increase—the highest dissent since 2016. This limits risk appetite but hasn't triggered panic selling. Key market highlights include Bitcoin ETFs seeing a net inflow of $32.1 million, breaking a streak of outflows, while Ethereum ETFs experienced outflows of $18.65 million. Liquidations affected about 90,000 traders. Technically, Bitcoin finds support around $63,000-$63,500, with major resistance near $66,000. While its price is about 49% below its all-time high, institutional demand via ETFs and the absence of mass capitulation support a potential recovery scenario in the second half of the year. Major altcoins showed mixed movements, with Solana attracting capital while Ethereum faced selling pressure despite strong on-chain metrics like a growing staking queue. Regulatory news took a pause as the U.S. Senate delayed the CLARITY Act vote until at least autumn. For the final trading day of July, U.S. inflation and consumer spending data will be crucial. Bitcoin's key levels to watch are $63,000 support and $66,000 resistance. Sustained ETF inflows and Bitcoin holding above $63,000 are seen as positive signs for a potential market recovery later in the year.

cryptonews.ru3 h fa

Why Bitcoin Holds Above $64,000 After Fed's Hard Pause

cryptonews.ru3 h fa

Trading

Spot

Articoli Popolari

Come comprare MOVE

Benvenuto in HTX.com! Abbiamo reso l'acquisto di Movement (MOVE) semplice e conveniente. Segui la nostra guida passo passo per intraprendere il tuo viaggio nel mondo delle criptovalute.Step 1: Crea il tuo Account HTXUsa la tua email o numero di telefono per registrarti il tuo account gratuito su HTX. Vivi un'esperienza facile e sblocca tutte le funzionalità,Crea il mio accountStep 2: Vai in Acquista crypto e seleziona il tuo metodo di pagamentoCarta di credito/debito: utilizza la tua Visa o Mastercard per acquistare immediatamente MovementMOVE.Bilancio: Usa i fondi dal bilancio del tuo account HTX per fare trading senza problemi.Terze parti: abbiamo aggiunto metodi di pagamento molto utilizzati come Google Pay e Apple Pay per maggiore comodità.P2P: Fai trading direttamente con altri utenti HTX.Over-the-Counter (OTC): Offriamo servizi su misura e tassi di cambio competitivi per i trader.Step 3: Conserva Movement (MOVE)Dopo aver acquistato Movement (MOVE), conserva nel tuo account HTX. In alternativa, puoi inviare tramite trasferimento blockchain o scambiare per altre criptovalute.Step 4: Scambia Movement (MOVE)Scambia facilmente Movement (MOVE) nel mercato spot di HTX. Accedi al tuo account, seleziona la tua coppia di trading, esegui le tue operazioni e monitora in tempo reale. Offriamo un'esperienza user-friendly sia per chi ha appena iniziato che per i trader più esperti.

299 Totale visualizzazioniPubblicato il 2024.12.13Aggiornato il 2026.06.02

Come comprare MOVE

Discussioni

Benvenuto nella Community HTX. Qui puoi rimanere informato sugli ultimi sviluppi della piattaforma e accedere ad approfondimenti esperti sul mercato. Le opinioni degli utenti sul prezzo di MOVE MOVE sono presentate come di seguito.

活动图片













