MACD Real Backtest: Can Technical Indicators Lead You to Profit?

marsbitPubblicato 2026-01-17Pubblicato ultima volta 2026-01-17

Introduzione

Based on a comprehensive 5-year backtest of the MACD trading strategy on BTC and ETH, this analysis delivers a sobering reality check for traders. The key finding is that 90% of short-term trading activity, particularly lower timeframes (15m, 30m, 1h), underperforms a simple "buy and hold" strategy due to transaction costs, noise, and psychological strain. The "benchmark" returns for simply holding the assets were +48.86% for BTC and +53.00% for ETH. The data reveals that MACD strategy performance is highly dependent on timeframe and leverage: * **Short Timeframes (15m, 30m, 1h):** Nearly all configurations resulted in significant losses or complete liquidation (-100%), severely underperforming the buy-and-hold benchmark. * **4-Hour Timeframe:** This was the only timeframe where the MACD strategy consistently generated alpha. * **BTC 4h (1x leverage):** ~+96% return, successfully outperforming buy-and-hold by avoiding major bear markets. * **ETH 4h (1x leverage):** ~+205% return, dramatically outperforming its buy-and-hold benchmark due to ETH's strong trend-following characteristics. * **Leverage Impact:** Leverage (2x, 3x) on the 4h timeframe amplified these gains effectively (e.g., ETH 4h 3x leverage yielded +552%). However, higher leverage (5x) often led to diminished returns due to funding fees and volatility decay, despite increased risk. The "Death Matrix" of results shows that short-term, high-leverage trading is akin to gambling" with a near-...

Author: Michel Athayde

Warning: This is a sobering report

Have you ever had these illusions:

  • "The 4-hour chart is too slow, I'll do 5-minute short-term trading, 1% compound interest per day, and I'll be the world's richest person in a year."

  • "Spot trading earns too slowly, I'll use 3x, 5x leverage. As long as the direction is right, the money I make will be several times that of others."

To verify these "get-rich-quick fantasies," we not only backtested the 4-hour chart but also dragged out the 15-minute (15m), 30-minute (30m), and 1-hour (1H) charts to "whip their corpses";

We not only looked at spot trading but also simulated the real outcomes of 200% (2x), 300% (3x), and 500% (5x) leveraged positions in extreme market conditions.

The conclusion is extremely brutal: Without leverage, 90% of us, after messing around for these 5 years, wouldn't even beat "foolishly hoarding coins."

Baseline Data: The "Passing Grade" You Must Beat

Before evaluating any strategy, we must first see how much you can earn by "doing nothing." Based on spot data from the past 5 years:

  • BTC Pure Spot: +48.86%

  • ETH Pure Spot: +53.00%

    (Note: This means if you bought 5 years ago and uninstalled the APP, you would now have about a 50% profit. This is the "passing grade" that any strategy must beat.)

MACD Strategy Data Summary

I backtested the performance of MACD on BTC/ETH over different timeframes and leverage levels for the past 5 years:
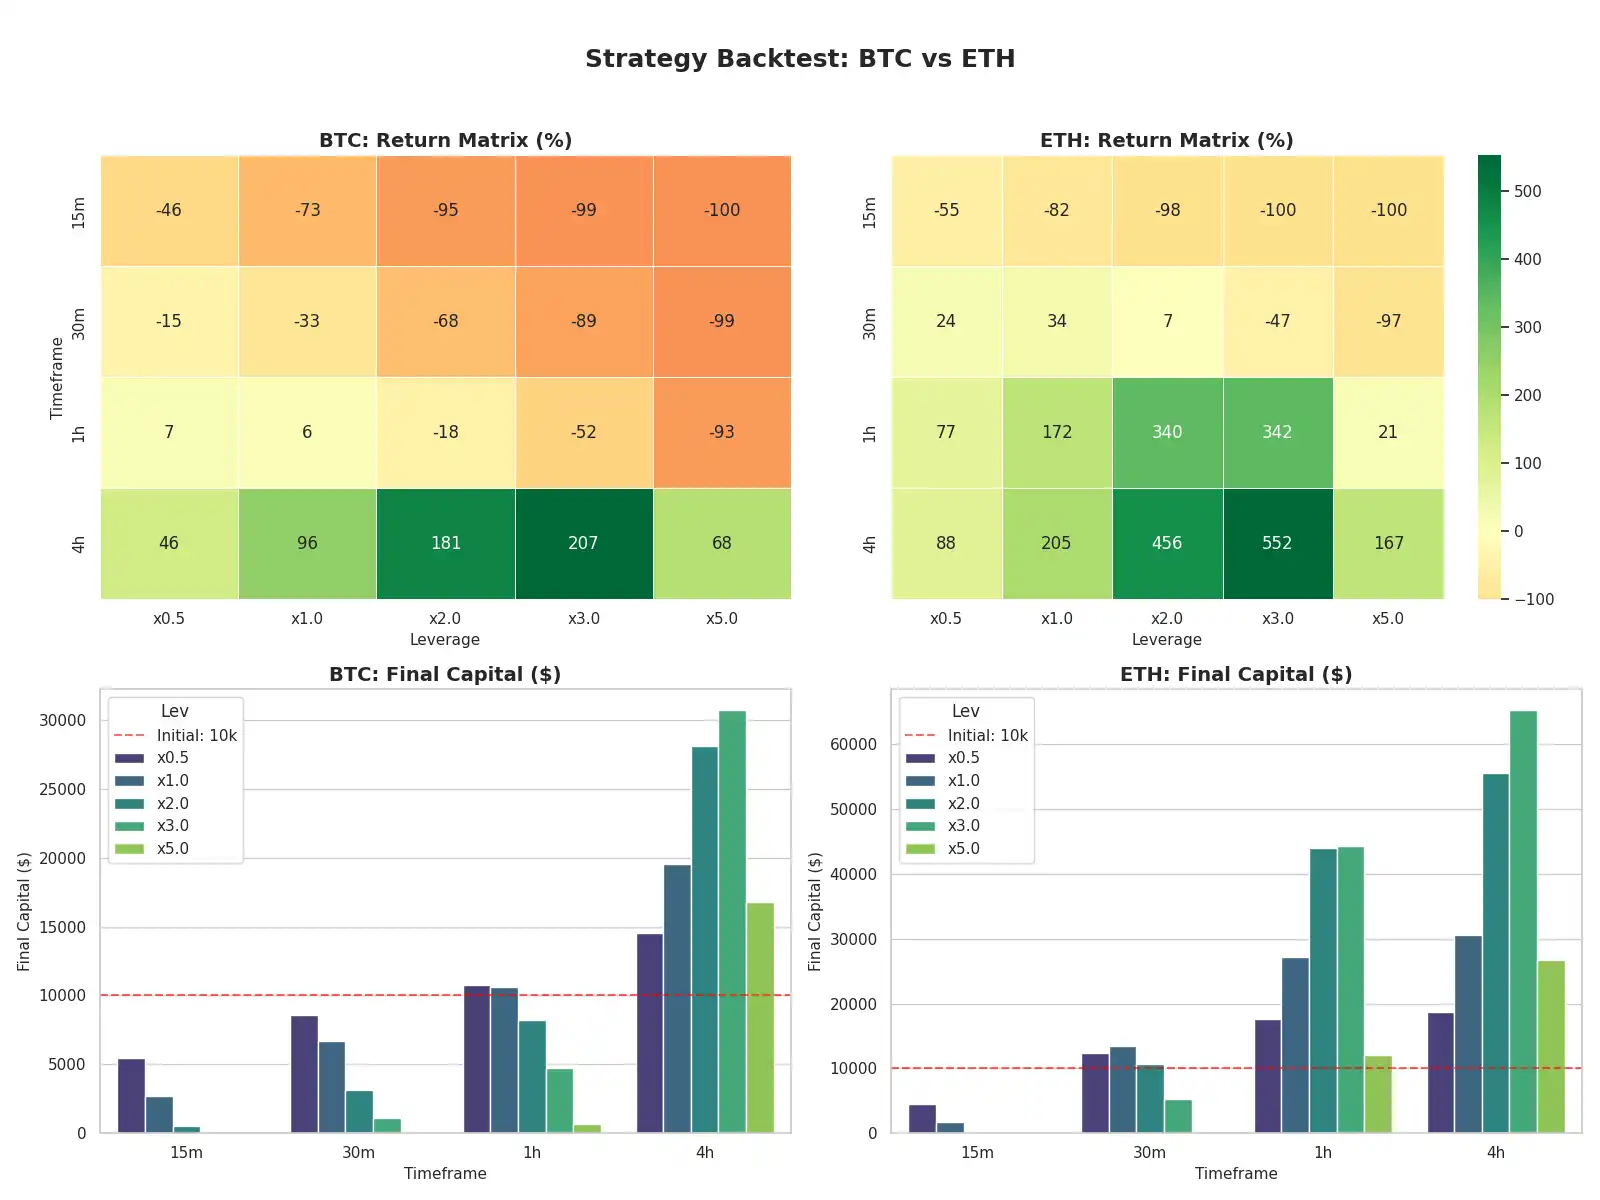
English Label (Chart Label) Chinese Meaning (Meaning)
Strategy Backtest Strategy Backtest Analysis
Return Matrix (%) Return Heatmap (Redder colors indicate more loss, greener colors indicate more profit)
Final Capital ($) Final Capital (Initial capital is 10,000 U)
Timeframe (TF) Timeframe (15m, 30m, 1h, 4h)
Leverage (Lev) Leverage Multiplier (x0.5, x1.0, x2.0, x3.0, x5.0)
Initial: 10k Initial Capital (Red dashed baseline)
  1. Top Left & Top Right (Heatmap - Return Rate):

    • Danger Zone (Red/Dark Orange): Concentrated in short timeframes like 15m and 30m. Especially with high leverage (x3.0, x5.0), capital is almost wiped out (-99%, -100%).

    • Golden Zone (Dark Green): Concentrated in the 4h timeframe. ETH's performance on the 4h chart is particularly outstanding, with almost all blocks being green.

  2. Bottom Left & Bottom Right (Bar Chart - Final Capital):

    • Red Dashed Line (10k): This is the break-even line. Bars below the red line represent losses, bars above represent profits.

    • BTC vs ETH: Notice the ETH 4h bars in the bottom right corner. When using x2.0 or x3.0 leverage, the capital bars are extremely tall, far exceeding BTC's performance. This verifies that ETH's volatility brings higher excess returns during trending markets.

I. Painful Lesson: 90% of Short-Term Operations Are "Negative Optimization"

The data reveals a brutal fact: On small and medium timeframes (15m, 30m, 1h), the MACD strategy not only failed to create excess returns (Alpha) but also significantly underperformed "foolish coin hoarding" due to overtrading and friction costs.

1. BTC 1-Hour Timeframe's "Busy Work"

  • Strategy Performance: BTC 1h x1.0 return rate is +6%.

  • Benchmark Performance: BTC spot hoarding return rate is +48.86%.

  • In-depth Interpretation:

    At the 1-hour level, you stared at the charts diligently for 5 years, executed thousands of golden cross/death cross trades with MACD, paid huge fees to the exchange, and only made 6% in the end. If you had done nothing, you would have made 49%.

    Conclusion: Running the MACD strategy on the 1H timeframe essentially destroys value. Your frantic operations look impressive, but the收益 turns from positive to negative (relative to opportunity cost).

2. The Complete Rout of Short-Term Trading (15m / 30m)

  • All Strategies: All resulted in losses or liquidation.

  • Compared to Benchmark: Compared to the +50% positive return of hoarding, short-term strategies represent a -100% devastating blow.

  • Cause of Death Analysis:

    • Noise: Most fluctuations at the 15m level are meaningless random walks.

    • Fee Erosion: Frequent opening positions incur手续费 and slippage, eating away at the principal like termites.

    • Mental Breakdown: High-frequency stop-losses lead to operational distortion.

II. The Only Way to Outperform: "Excess Returns" on the 4-Hour Timeframe

Only when the timeframe is extended to 4 hours does the MACD strategy demonstrate the ability to beat "coin hoarding." This is the only reason quantitative trading exists.

1. BTC 4h: A Narrow Victory

  • MACD x1.0 (Spot): Return approximately +96%.

  • Hoarding Benchmark: +48.86%.

  • Winning Logic:

    MACD successfully helped BTC avoid the main下跌浪 of the deep bear market (e.g., the big drop in 2022) at the 4H level. Although it made a little less during the bull market's initial and final phases, the advantage gained from being空仓 for risk avoidance ultimately allowed it to outperform buy-and-hold.

2. ETH 4h: Absolute Crushing

  • MACD x1.0 (Spot): Return approximately +205%.

  • Hoarding Benchmark: +53.00%.

  • MACD x3.0 (Optimal Leverage): Return +552%.

  • Winning Logic:

    ETH has extremely strong trend characteristics. Hoarders enjoyed the rise but also fully endured the -80% drawdown. The MACD strategy preserved profits by being空仓 during the bear market and compounded them in the next bull market. A return 4 times that of hoarding (205% vs 53%) proves the huge value of timing on ETH.

III. The True Meaning of Leverage: Amplifying "Win Rate" or Amplifying "Gambling Nature"?

Combined with the baseline data, we can redefine the role of leverage.

1. x2.0 - x3.0: The Secret of the Golden Zone

  • BTC 4h x3.0 (+207%) vs BTC Hoarding (+48.86%):

    With 3x leverage, the strategy放大 the return by 4 times. This is a healthy放大 ratio, indicating the strategy captured the real trend, and leverage played a "pushing the boat with the current" role.

  • ETH 4h x3.0 (+552%) vs ETH Hoarding (+53.00%):

    The return was放大 by 10 times! This is the peak performance of quantitative trading - achieving class-leaping returns on high-volatility assets with reasonable leverage and the correct timeframe.

2. x5.0: The "Inversion" of Return Rate

  • ETH 4h x5.0 (+167%):

    Note! Although it beat hoarding (+53%), it significantly underperformed the low-leverage strategy (+552%).

  • Warning: When you increase leverage to 5x, you are essentially working for the exchange (high funding fees) and giving money to the market (high volatility erosion). You bear the risk of liquidation and归零, but only get mediocre returns.

IV. Your "Death Matrix" Report (The Death Matrix)

To make you give up hope, we list the final outcomes under different configurations.

Asset Timeframe Leverage Status Final Return Rate Outcome Evaluation
BTC 15m x5.0 💥 Liquidated -100% Certain Death. Pure gambling, fees alone can eat you alive.
BTC 15m x1.0 -73% Slow suicide. Worse than putting money in the bank.
BTC 1h x1.0 +6% Busy work. Underperformed hoarding (+49%), wasted 5 years of youth.
BTC 4h x1.0 +96% Excellent. Beat hoarding by double, stable mentality.
BTC 4h x3.0 +207% Outstanding. Maximized returns, controllable risk.
--- --- --- --- --- ---
ETH 15m x5.极0 💥 Liquidated -100% Certain Death. Victim of noise trading.
ETH 1h x1.0 +172% Acceptable. ETH is volatile, can make some money short-term, but tiring.
ETH 4h x1.0 +205% Excellent. 4 times the return of hoarding, and no need to stay up late.
ETH 4h x3.0 +552% King. This is the holy grail zone of quantitative trading.
ETH 4h x5.0 +167% Mediocre. Risk increases dramatically, returns反而 decrease (funding fees + erosion).

V. Final Decision Guide: What Should You Do?

Based on the passing grade of hoarding (+50%), we give the final strategy recommendations:

  1. If you don't want to bother / have no time / have a weak mentality:

    • Strategy: Pure Hoarding (Buy & Hold) or MACD 4h x1.0 (Spot).

    • Expectation: ~50% - 100% return.

    • Cost: Need to endure asset drawdowns, but this is infinitely better than losing money through胡乱操作.

  2. If you want to beat the market (BTC):

    • Strategy: MACD 4h (x1.5 - x2.0).

    • Expectation: ~150% - 200% return.

    • Key: Must strictly stop loss, only trade the 4H large timeframe, never look at 15m.

  3. If you pursue excess returns (ETH):

    • Strategy: MACD 4h (x2.0 - x3.0).

    • Expectation: ~400% - 550% return.

    • Key: This is the optimal sweet spot. Utilize ETH's high volatility + moderate leverage. Remember, do not exceed 3x.

  4. If you are a gambler / short-term trader:

    • Strategy: MACD 15m/1h + x5.0 or higher.

    • Expectation: -100% (Zero out).

    • Warning: Data proves this cannot beat hoarding, and is even worse than donating the money.

Core Conclusion

"Since spot hoarding only yielded about 50% over 5 years, this反而 proves the value of excellent quantitative strategies."

However, this value is limited to the 4-hour level.

On timeframes below 1 hour, all your efforts are counterproductive, worse than simply doing nothing.

Only by standing at the golden intersection of 4H + 3x can you truly laugh at those who "hold until death."

(The data in this article is based on historical backtesting and does not represent future returns. The market is risky, use leverage cautiously.)


Domande pertinenti

QWhat is the key finding of the MACD backtest regarding short-term trading on smaller timeframes like 15m and 30m?

AThe backtest reveals that MACD strategies on short-term timeframes (15m, 30m, and even 1h) are disastrous. They resulted in significant losses or complete liquidation (-100%), severely underperforming the simple 'buy and hold' strategy. This is due to market noise, high transaction fee erosion, and the psychological strain of frequent stop-losses.

QWhat was the performance of the simple 'buy and hold' (HODL) strategy for BTC and ETH over the 5-year period?

AThe 'buy and hold' strategy, which serves as the performance benchmark, yielded a return of +48.86% for BTC and +53.00% for ETH over the past 5 years.

QUnder which specific conditions did the MACD strategy generate significant alpha and outperform the 'buy and hold' benchmark?

AThe MACD strategy significantly outperformed the benchmark only on the 4-hour (4h) timeframe. For BTC 4h with 1x leverage, it achieved about +96% return. For ETH 4h, it was even more successful, achieving approximately +205% with 1x leverage and a stellar +552% with 3x leverage, by effectively avoiding major bear market drawdowns.

QWhy does the 5x leverage strategy on ETH 4h underperform the 3x leverage strategy, according to the article?

AThe 5x leverage strategy on ETH 4h underperforms the 3x strategy (yielding +167% vs. +552%) because the higher leverage leads to excessive funding fee costs and increased volatility drag, significantly eating into profits and increasing the risk of ruin without providing a commensurate return.

QWhat is the final recommended strategy for someone seeking alpha on ETH, and what is the critical warning associated with it?

AThe recommended strategy for seeking alpha on ETH is using the MACD indicator on the 4-hour timeframe with 2.0x to 3.0x leverage, targeting returns of ~400% to 550%. The critical warning is to never exceed 3x leverage, as higher leverage (like 5x) increases risk dramatically while reducing potential returns due to fees and磨损 (wear and tear).

Letture associate

Must-Watch Events Next Week|CLARITY Act Could Face Senate Vote; SpaceX, Circle to Report Earnings (8.3-8.9)

**Summary: Key Events and Developments to Watch (August 3-9)** The upcoming week is marked by significant financial disclosures, key legislative deadlines, and notable product updates. **Major Financial Events:** Several companies are scheduled to release their Q2 2026 earnings. American Bitcoin (ABTC) will report on August 3, followed by SpaceX and Hut 8 Mining Corp. on August 4, and Circle on August 5. Notably, a significant portion of SpaceX shares (up to 12% of total shares) will be unlocked on August 6 following their earnings release. **Key Legislative Deadline:** The U.S. Senate faces an August 7 deadline to secure 60 votes for the CLARITY Act, a bipartisan bill aiming to establish a federal regulatory framework for cryptocurrencies. The Senate may hold a full vote on the bill during the week. **Economic Data:** The U.S. July Non-Farm Payrolls report will be released on August 7, providing crucial labor market data. **Technology & Product Updates:** * **Shutdowns:** DeFi portfolio tracker Zapper and wallet app Ctrl Wallet will cease operations on August 3. * **Upgrades:** LayerZero will deprecate its v1 relayers on August 3. XRP Ledger's new version 3.3.0, featuring five new functions, is expected next week. * **AI:** Elon Musk announced that the advanced Grok 4.6 AI model is set for release around August 7. * **Bitcoin:** The BIP-110 forced signaling for a potential Bitcoin network change is scheduled to begin around August 8. **Other Notable Events:** Chinese robotics firm Unitree Tech has set its preliminary price inquiry for its IPO for August 5. South Korean exchange Upbit will delist AQT and AERGO tokens on August 3.

marsbit1 h fa

Must-Watch Events Next Week|CLARITY Act Could Face Senate Vote; SpaceX, Circle to Report Earnings (8.3-8.9)

marsbit1 h fa

Stocks Are Plummeting More Sharply Than Cryptocurrencies. Where Has the Money Gone?

Stock Markets Plunge Deeper Than Cryptocurrencies: Where Did the Money Go? In late July, Seoul's Kospi index triggered circuit breakers for two consecutive days, plummeting over 40% from its June high. The collapse was led by heavyweight stocks like SK Hynix, whose record profits still disappointed investors, and devastating leveraged ETFs, with one major product losing over 83% of its value. This signaled a global, forced deleveraging targeting the most crowded trades. Interestingly, while stocks exhibited extreme volatility akin to crypto markets, Bitcoin rose nearly 15% in July after a prior steep drop. Analysis shows the money fleeing equities did not flow into Bitcoin. Instead, Bitcoin had already absorbed its sell-off in May-June, when U.S. spot Bitcoin ETFs saw historic outflows. The true safe-haven beneficiary was gold, whose price rose over 20% year-on-year, highlighting a decoupling between Bitcoin and gold as "digital gold." The sell-off was a targeted unwinding of leveraged positions in tech and semiconductors, accelerated by broker-dealer risk management and shifts in the AI narrative, including new competition from Chinese memory chipmakers. The retreat path was clear: from high-valuation tech stocks to cash and U.S. Treasuries, then to gold. For Bitcoin to attract sustained institutional inflows, conditions like eased global liquidity pressure, a "soft-landing" Fed rate cut, and U.S. regulatory clarity via legislation like the stalled CLARITY Act are needed. Currently, Bitcoin is not a safe haven but an already-cleared asset. Its low correlation with tech stocks, however, makes it a potential diversification play for institutional portfolios once the storm passes. The money isn't here yet, but the positioning is underway.

marsbit1 h fa

Stocks Are Plummeting More Sharply Than Cryptocurrencies. Where Has the Money Gone?

marsbit1 h fa

In Conversation with Ray Dalio: We Are Currently in an AI Bubble, with 1% of My Portfolio in Bitcoin

Ray Dalio, founder of Bridgewater Associates, warns in an interview that the current AI boom shows classic bubble characteristics, which could lead to significant economic downturns as seen in past cycles like 1929 or 2000. He explains that speculative enthusiasm, fueled by debt and overvaluation, often precedes a crash when rising rates or taxation force asset sales, causing widespread losses and recession. Dalio also outlines his "Big Cycle" theory, describing an approximate 80-year pattern where widening wealth gaps, massive government deficits, and shifting geopolitical power (like China's rise) create internal conflict and global instability. He emphasizes that we are in a late-cycle, transitional phase where traditional powers like the US and UK face decline. For personal wealth protection, Dalio advises diversification beyond cash into assets like stocks, bonds, real estate, and particularly gold, which he prefers over Bitcoin. While he holds about 1% of his portfolio in Bitcoin as a non-printable hard asset, he views gold as more secure from technological or governmental threats. Regarding AI's impact, Dalio believes it will disproportionately benefit capital owners, worsening inequality by replacing both physical and cognitive labor. He suggests that human intuition and emotional intelligence, combined with AI, will be key for future workers. On taxation, Dalio argues that wealth taxes are impractical and risk triggering asset sell-offs, reducing productive investment. He points to the UK as a cautionary example of debt, low productivity, and political strife. Geopolitically, Dalio foresees a more regionalized world, with the US showing weakness in prolonged conflicts like with Iran, akin to past imperial declines. The ideal outcome, he suggests, is coexisting powerful blocs (e.g., Americas, China-Asia Pacific) without major war.

marsbit5 h fa

In Conversation with Ray Dalio: We Are Currently in an AI Bubble, with 1% of My Portfolio in Bitcoin

marsbit5 h fa

Trading

Spot
活动图片




