Original Author: Ma He, Foresight News
On May 28, after repeated battles around the $75,000 mark, the price of Bitcoin finally lost its footing, now sliding to around $74,000. ETH is oscillating repeatedly around $2,000. Previously strong performers like NEAR, WLD, and ONDO have all seen pullbacks.
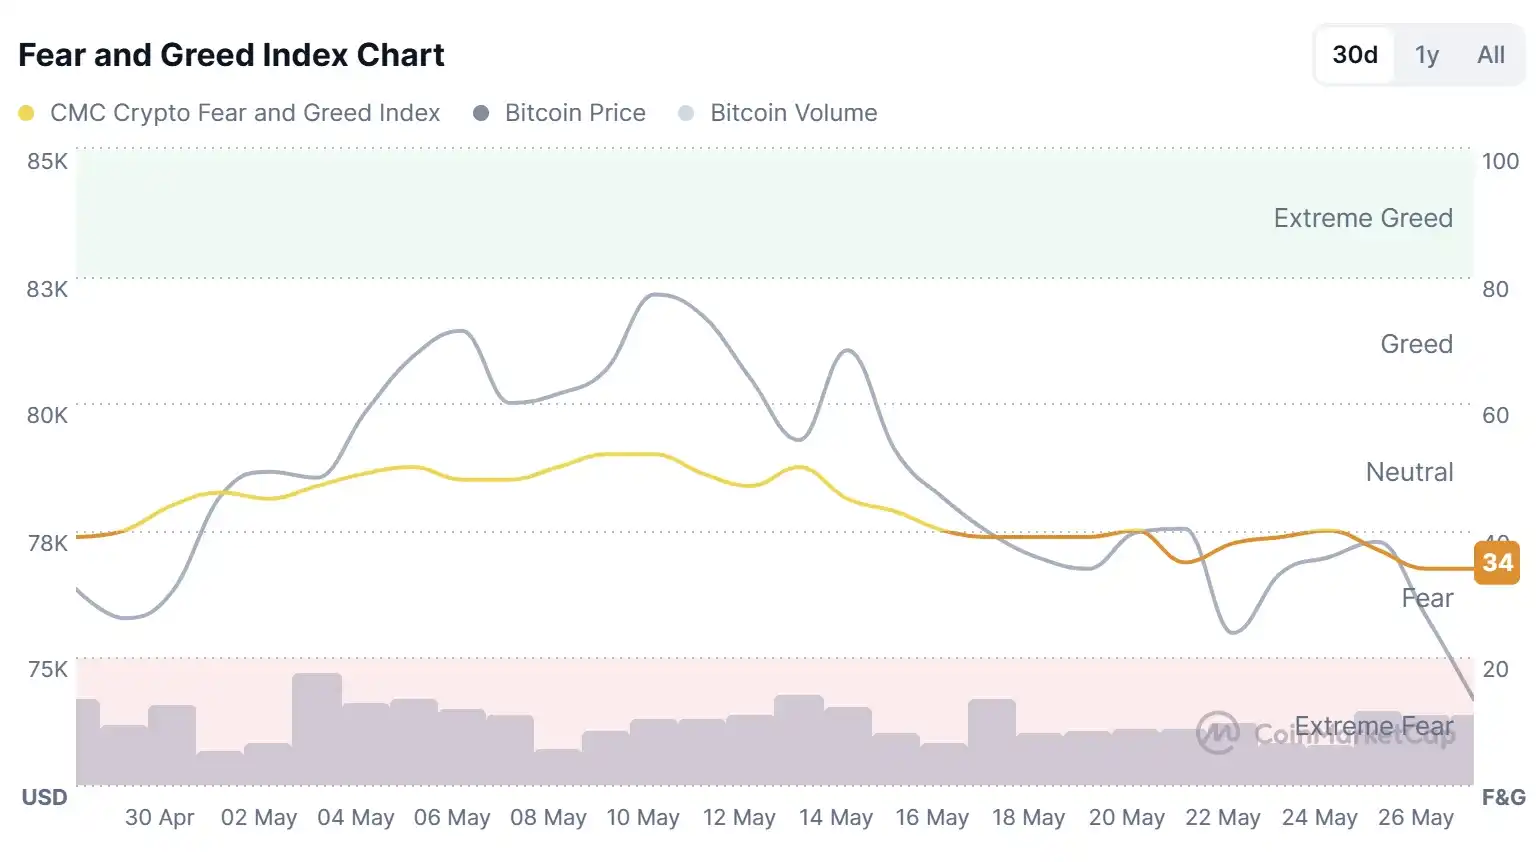
The market fear and greed index has currently fallen back to 34, indicating a state of panic.
Data from Coinglass shows that in the past 24 hours, $470 million worth of open interest contracts were liquidated across the network, with long positions accounting for $420 million of that.
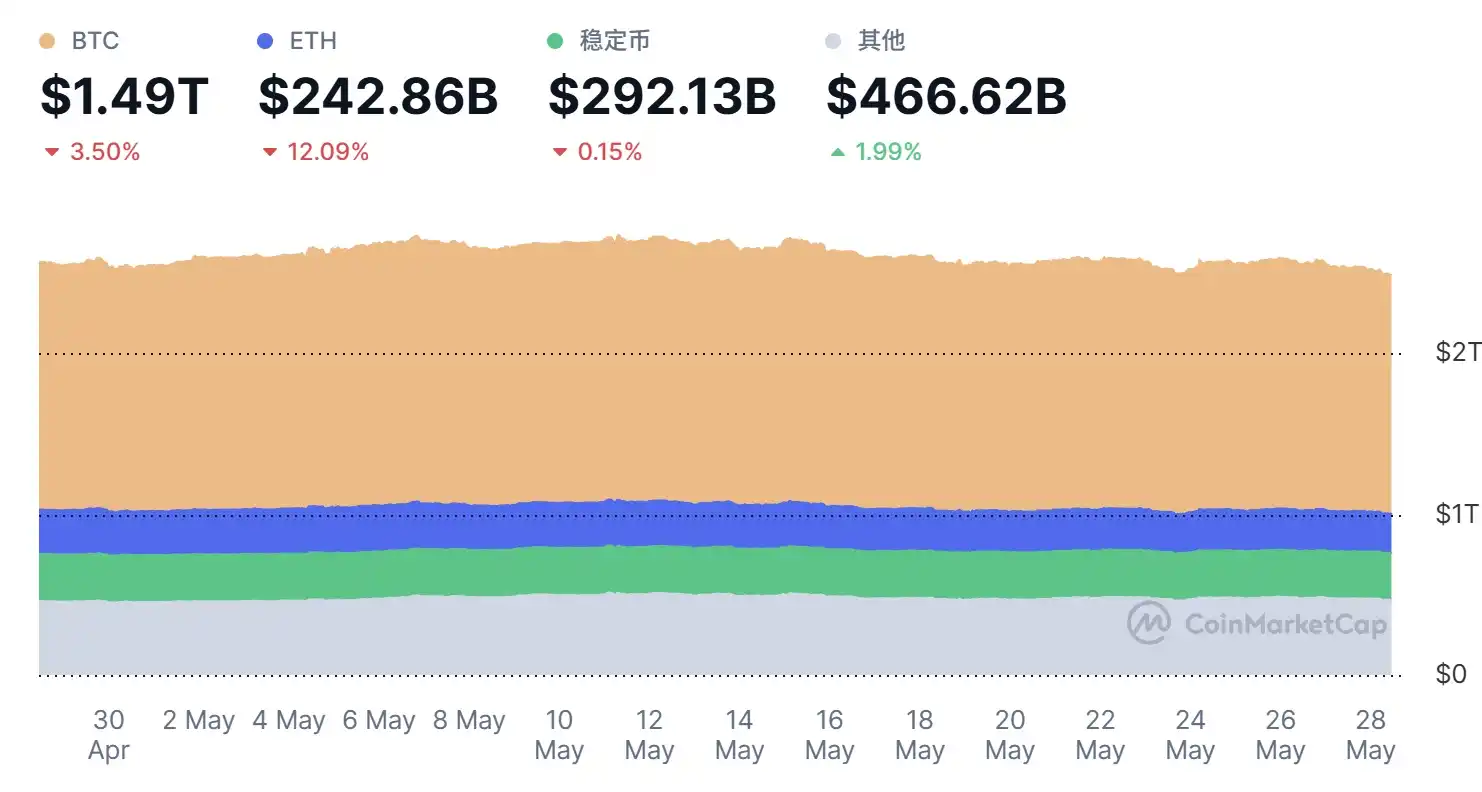
Over the past several weeks, Bitcoin has been oscillating repeatedly between $75,000 and $80,000. It briefly attempted to break above $78,000 but failed to hold. In the past 30 days, BTC has fallen by 3.5%, ETH by about 12%, and stablecoins have also declined by 0.15%.
Regarding macro data, Brent crude oil rose slightly to $97 per barrel, silver fell slightly to $73, the Dow Jones Industrial Average rose 182.60 points (+0.36%) to a new record high. The S&P 500 index rose 1.24 points (+0.02%). The Nasdaq Composite Index stood at 26,674.73 points, up 18.55 points (+0.07%). Spot gold fell below $4,400 per ounce, the first time since March 27, losing over $50 intraday, a drop of 1.25%.
US-Iran Conflict "Reignites"
Geopolitical risks in the Middle East have become another significant external variable. Since 2026, tensions between the US, Iran, and related parties over issues like Iran's nuclear facilities and shipping security in the Strait of Hormuz have repeatedly escalated and eased. In recent months, the US has adopted a strategy combining military action with diplomatic pressure, accompanied by airstrikes, port blockade rumors, and repeated ceasefire negotiations.
Even during windows of ceasefire or diplomatic progress, market pricing for the risk of "reignition" has not completely subsided.
Early on May 28, US President Trump stated that the United States would continue to control Iran's assets. Iran has begun to provide us with what we want. If things don't go well, US Secretary of Defense Hagesse will finish the job. We can end the war with Iran very quickly, and perhaps we must do so. However, I don't think we need to.
Around 5:00 AM Beijing Time, according to reports from Iranian media Fars News, local residents said explosions were heard at Bandar Abbas port in southern Iran.
A US official told Reuters that the US military conducted new strikes on an Iranian military base posing a threat to US forces and commercial navigation in the Strait of Hormuz. US forces also intercepted and shot down multiple Iranian drones posing a threat to US forces and commercial maritime traffic.
Renewed tensions related to the Strait of Hormuz have come into focus, intensifying oil price volatility and putting pressure on global risk assets. In this environment, Bitcoin has exhibited more risk-asset characteristics rather than the traditional "digital gold" safe-haven function—geopolitical uncertainty boosts demand for the US dollar and US Treasuries while suppressing risk appetite, leading to capital outflows from the crypto market.
ETF Net Outflows Reveal Institutional Profit-Taking
Since their launch in early 2024, US spot Bitcoin ETFs have seen cumulative net inflows once exceeding $57 billion, becoming a major channel for institutional Bitcoin allocation. However, a clear reversal in flows has emerged since May 2026.
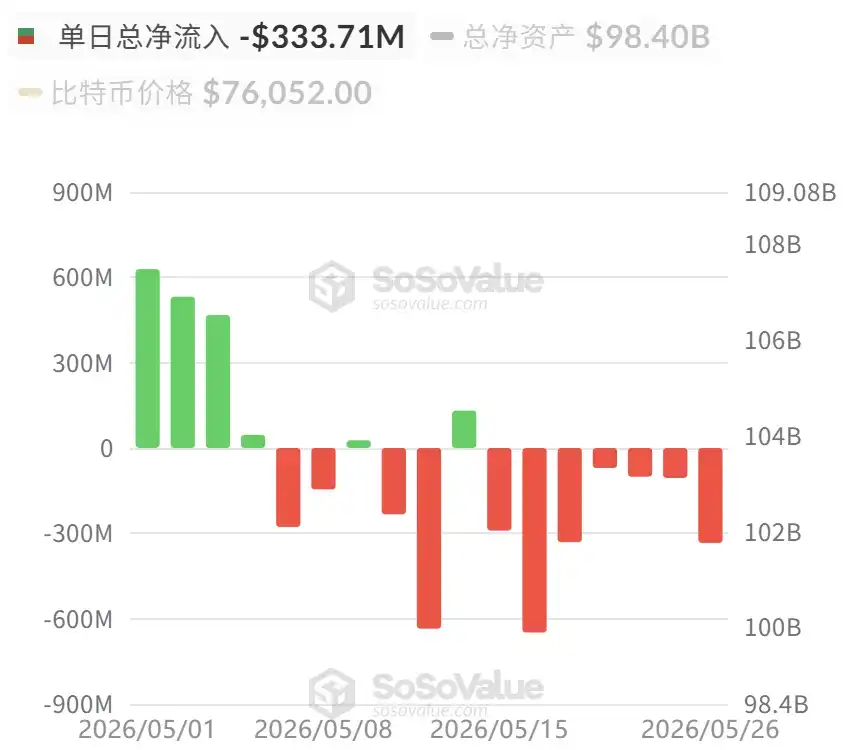
According to tracking data from SoSoValue, between May 5 and 26, US Bitcoin ETFs recorded consecutive net outflows, with daily outflow amounts ranging from tens of millions of dollars to a peak of $600 million, occurring twice.
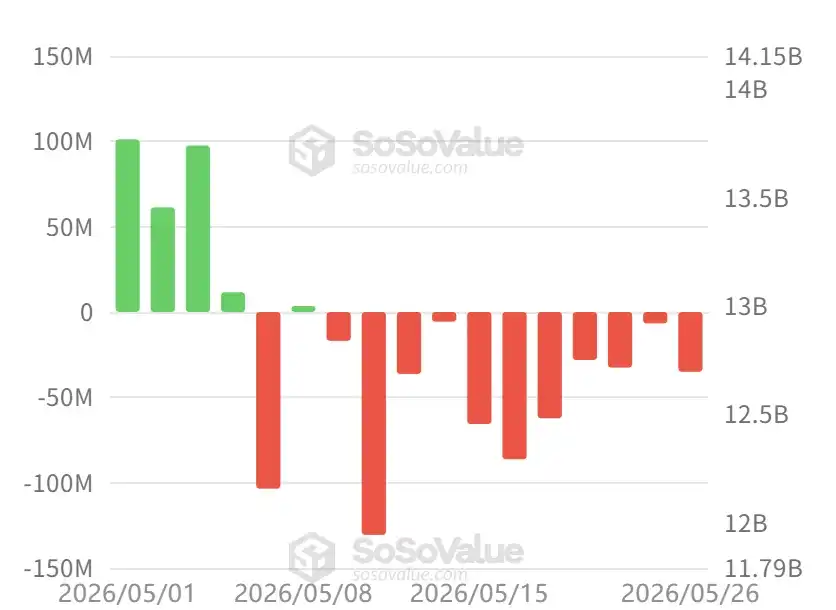
The situation for spot Ethereum ETFs is similarly pessimistic, mirroring Bitcoin with substantial net outflows since early May.
This may not be simple "panic selling," but more likely systematic profit-taking by earlier gainers. ETF holders include traditional asset managers, family offices, and hedge funds, who have chosen to lock in profits via the redemption mechanism after Bitcoin's recovery from lows to the $75,000-$80,000 range. Some funds may have rotated into better-performing AI-related tech stocks—the S&P 500 and Nasdaq indices hitting new highs during the same period, while the crypto market underperformed overall, highlighting capital reallocation within risk assets.
Subsequent Trends
Wintermute published a post stating that BTC's consecutive two weeks of over $1 billion in ETF outflows (following six weeks of inflows) indicate institutions are capitalizing on strength to realize some recent positive returns. More noteworthy is AI. Nvidia delivered a textbook-level performance exceeding expectations, but there was almost no post-market movement. Incremental beats are no longer moving the needle. If the AI momentum fades, the macro picture (record-low consumer confidence, sticky inflation, a hawkish Fed under Governor Waller) will gain more weight, and cryptocurrencies will not be immune.
BTC's long-term structure remains sound (reserves at multi-year lows, long-term holders continue accumulating, CLARITY progressing, HYPE doing what major tokens should do early on). But short-term price is driven by capital flows, and currently, they are negative. The $75,000 to $76,000 range is a key line for BTC. Holding here, BTC will reattempt to assault $80,000; breaking below this range could lead to a quick slide towards $70,000 to $72,000.
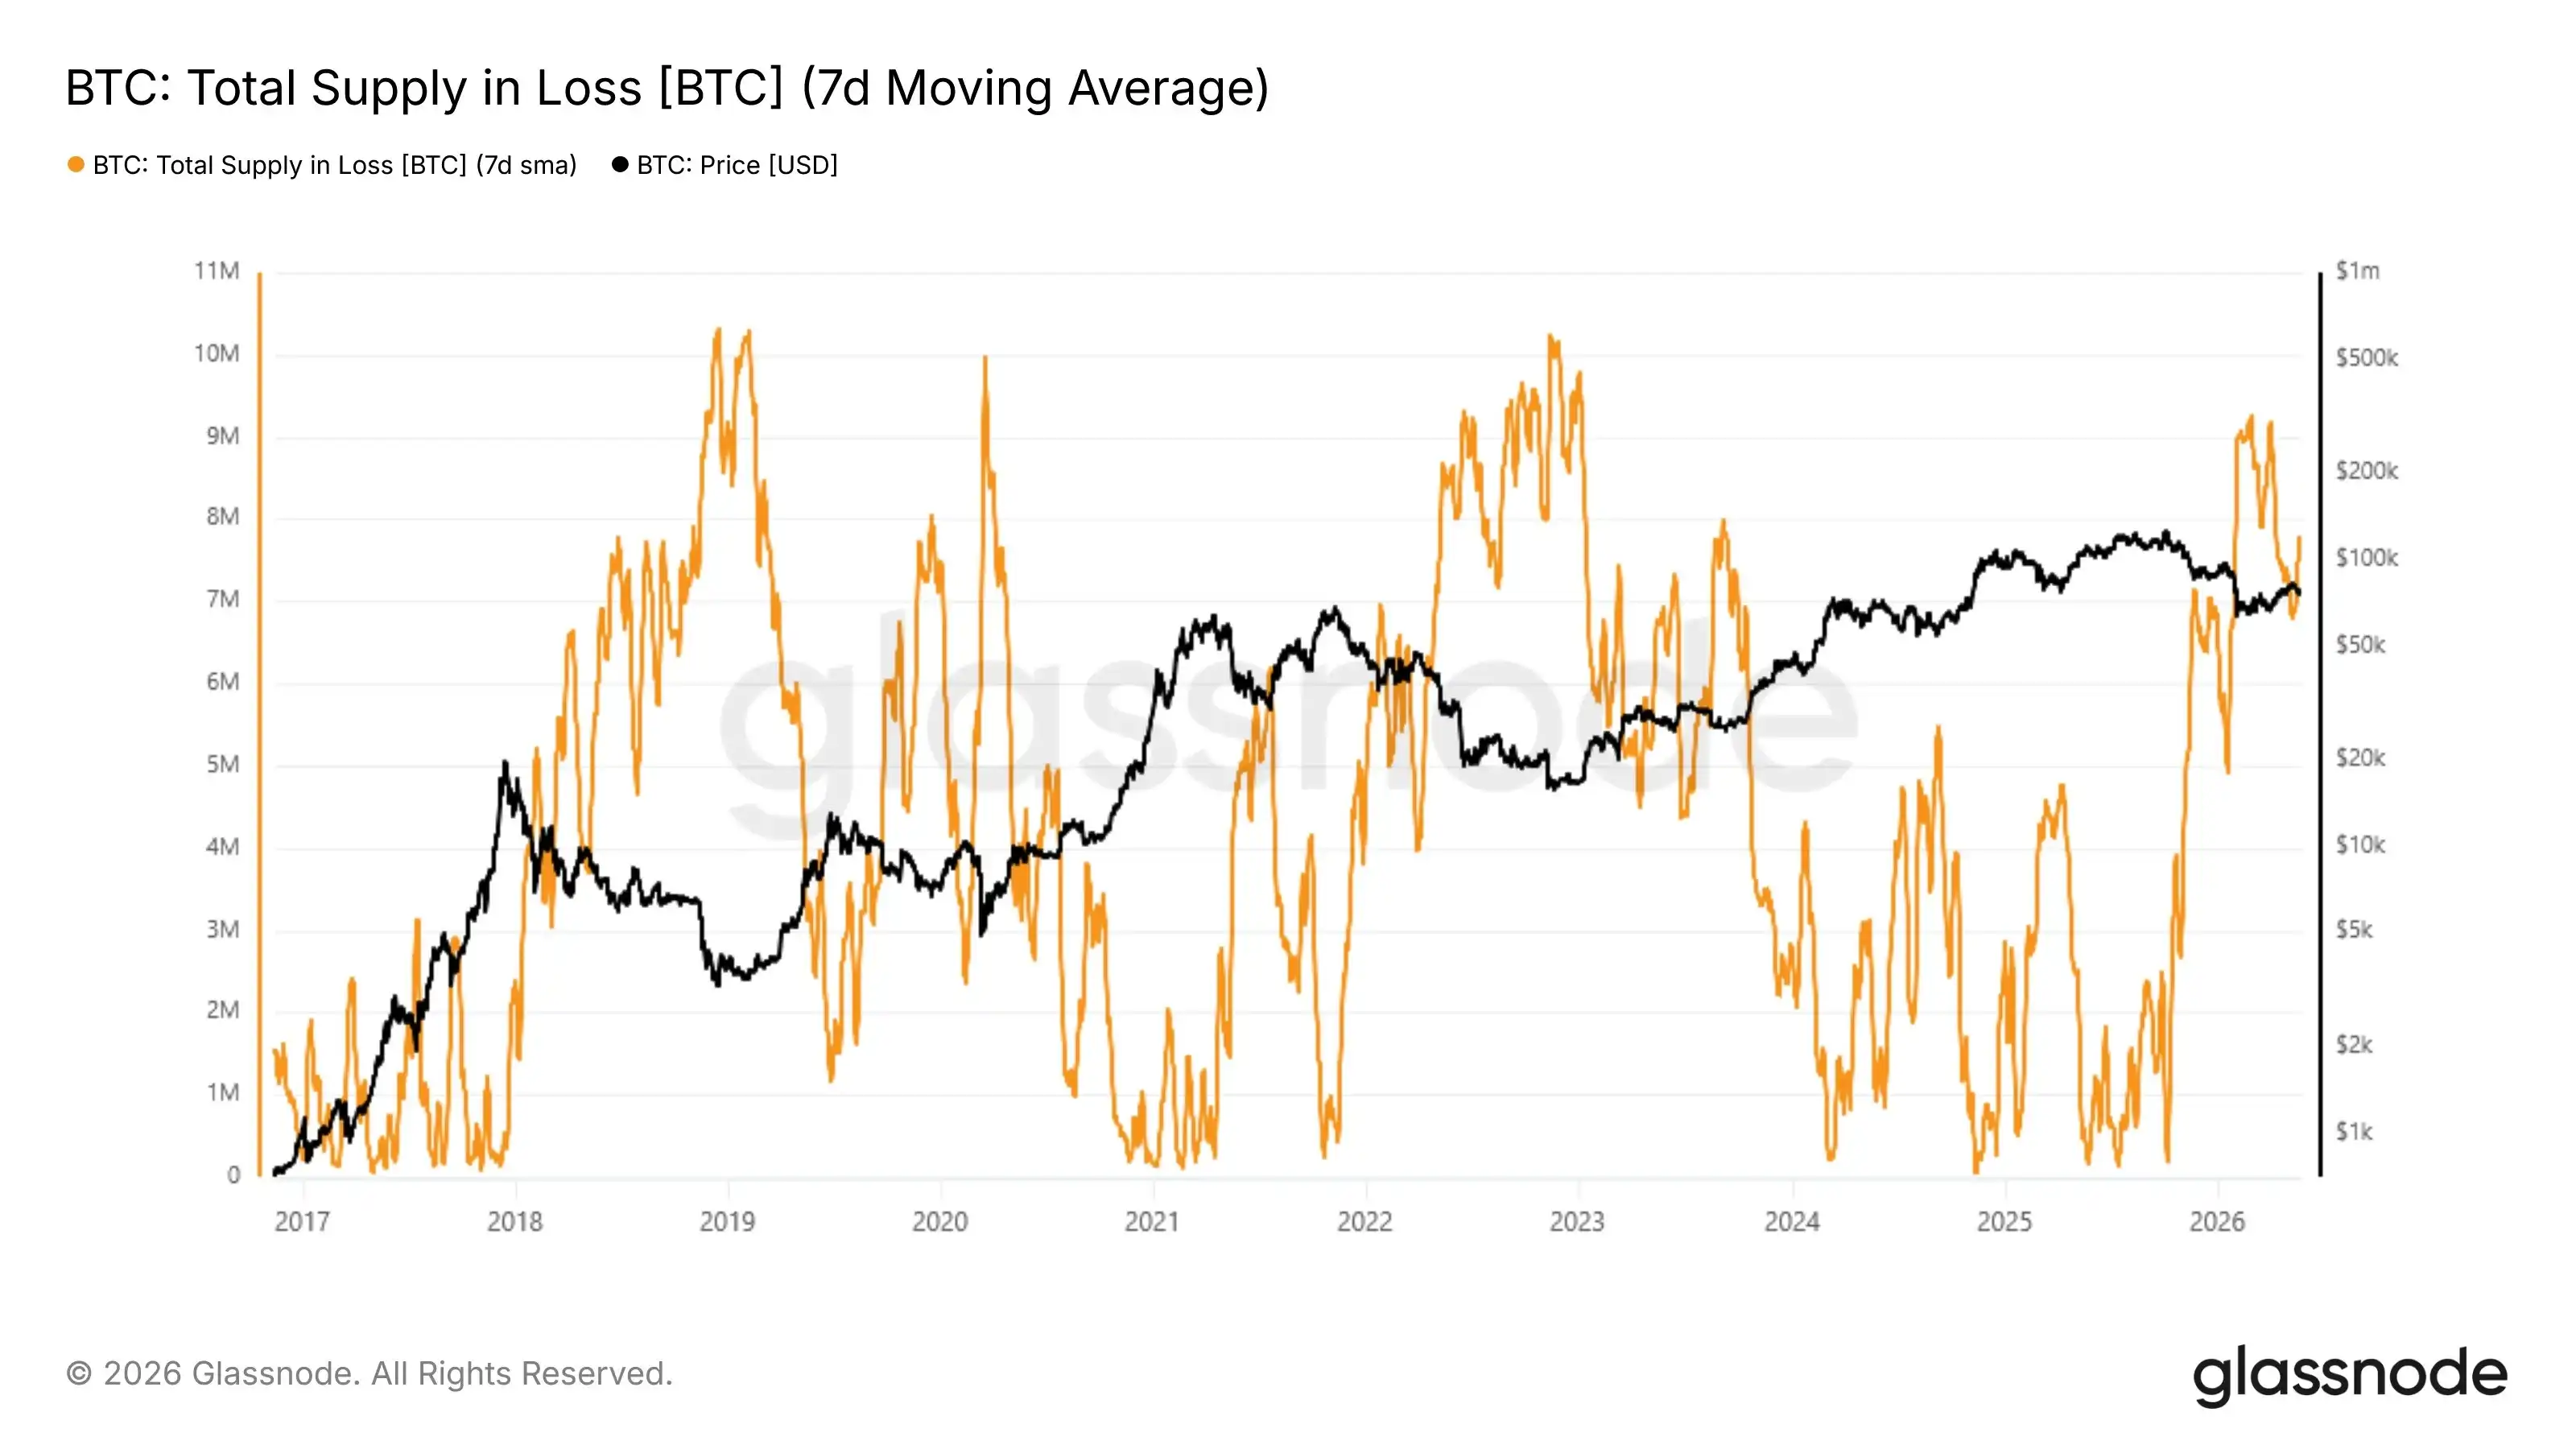
glassnode tweeted that at a price of $76,000, approximately 7.75 million BTC are in a loss position. This supply overhang is a structural feature of bear markets and is typically only resolved when weak hands capitulate.
BIT tweeted that, regarding Bitcoin, the sustained rally over the past period largely depended on the interplay between institutional demand and market supply available for sale. Over the past year, Bitcoin spot ETFs and Strategy have been significant sources of such demand. When ETF inflows accelerated and Strategy continuously increased Bitcoin holdings, Bitcoin prices typically continued to rise.
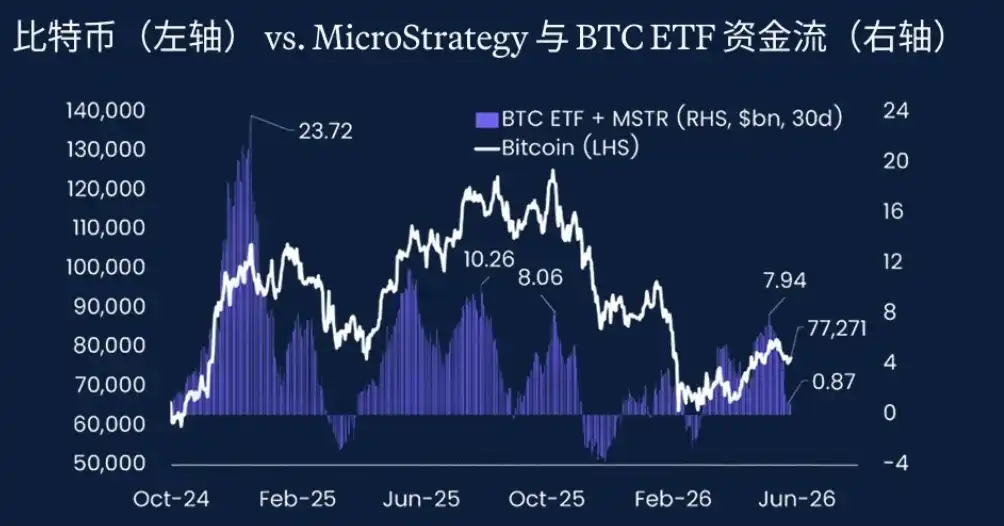
BIT stated that the combined net purchases of ETFs and Strategy have now fallen to only $870 million, primarily due to significant ETF outflows, shifting from net buying to net selling. Before ETF inflows stabilize and rebound, Bitcoin may remain in a consolidation phase in the short term.
Analyst Murphy stated that using the on-chain indicator "Weight of Short-Term Capital Activity" (i.e., the USD value proportion represented by short-term coin turnover), one can observe the current state of the BTC market. This indicator reflects the latest short-term trading behaviors like speculation, arbitrage, profit-taking, or panic selling. Currently, this weight has fallen to historically extreme lows, only seen at the absolute bottom of bear markets in the past 15 years. This means short-term turnover has significantly cooled down, economic value is sedimenting towards long-term holdings, and the market is in a phase of low volatility, accumulation, or with pronounced bottoming characteristics.
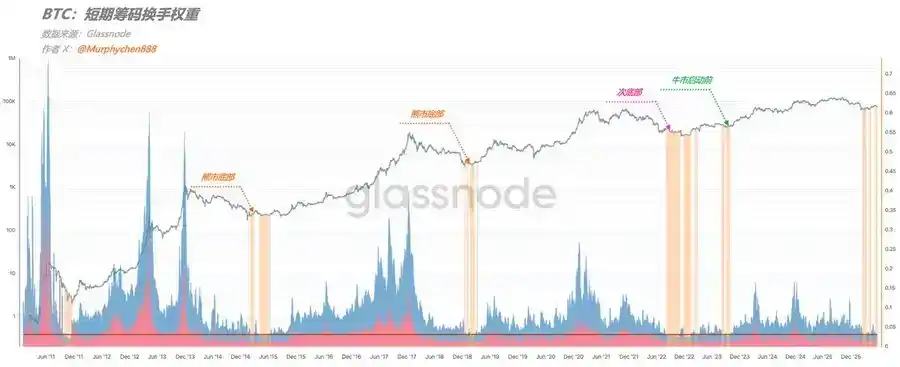
Murphy's judgment, based on this, is that the current market might be in one of three phases: the bottom of a bear market; a sub-bottom, possibly with one last drop; or accumulation before a bull market launch. However, rational judgment can temporarily rule out pre-bull accumulation. It's currently not advisable to fully bet on a single scenario; a diversified portfolio strategy to cope with different outcomes is recommended. The relative position on the long-term macro direction indicates Bitcoin is near a bottom.