LayerZero rallies 11% as market activity overheats: Can ZRO push past $2.28?

ambcryptoPubblicato 2026-03-17Pubblicato ultima volta 2026-03-17

Introduzione

LayerZero (ZRO) surged over 11% in 24 hours, with trading volume jumping more than 140%, pushing its price toward the key $2.286 resistance level. The token recovered from a February low below $1.60, showing a sequence of higher lows and improved trend stability. Technical indicators like the positive MACD crossover and green histogram bars suggest growing buying momentum. However, spot market data signals overheating, with high speculative activity and persistent taker sell dominance creating short-term imbalance. Derivatives data shows higher short liquidations, amplifying volatility. While buyer interest is strong, overcoming the $2.286 barrier remains uncertain due to potential selling pressure. A breakout depends on sustained demand versus speculative activity.

LayerZero rallied more than 11% in the last 24 hours as trading activity intensified and 24-hour volume jumped over 140%, pushing ZRO toward key resistance.

Rising participation has pushed ZRO back into focus across spot and derivatives markets. Buyers have returned aggressively after weeks of choppy consolidation.

At the time of press, LayerZero [ZRO] traded at around $2.20, reflecting renewed speculative interest. Volume expansion usually signals strong participation; however, overheated conditions sometimes follow rapid spikes.

Traders therefore continue monitoring whether this surge reflects sustained demand or short-term speculation.

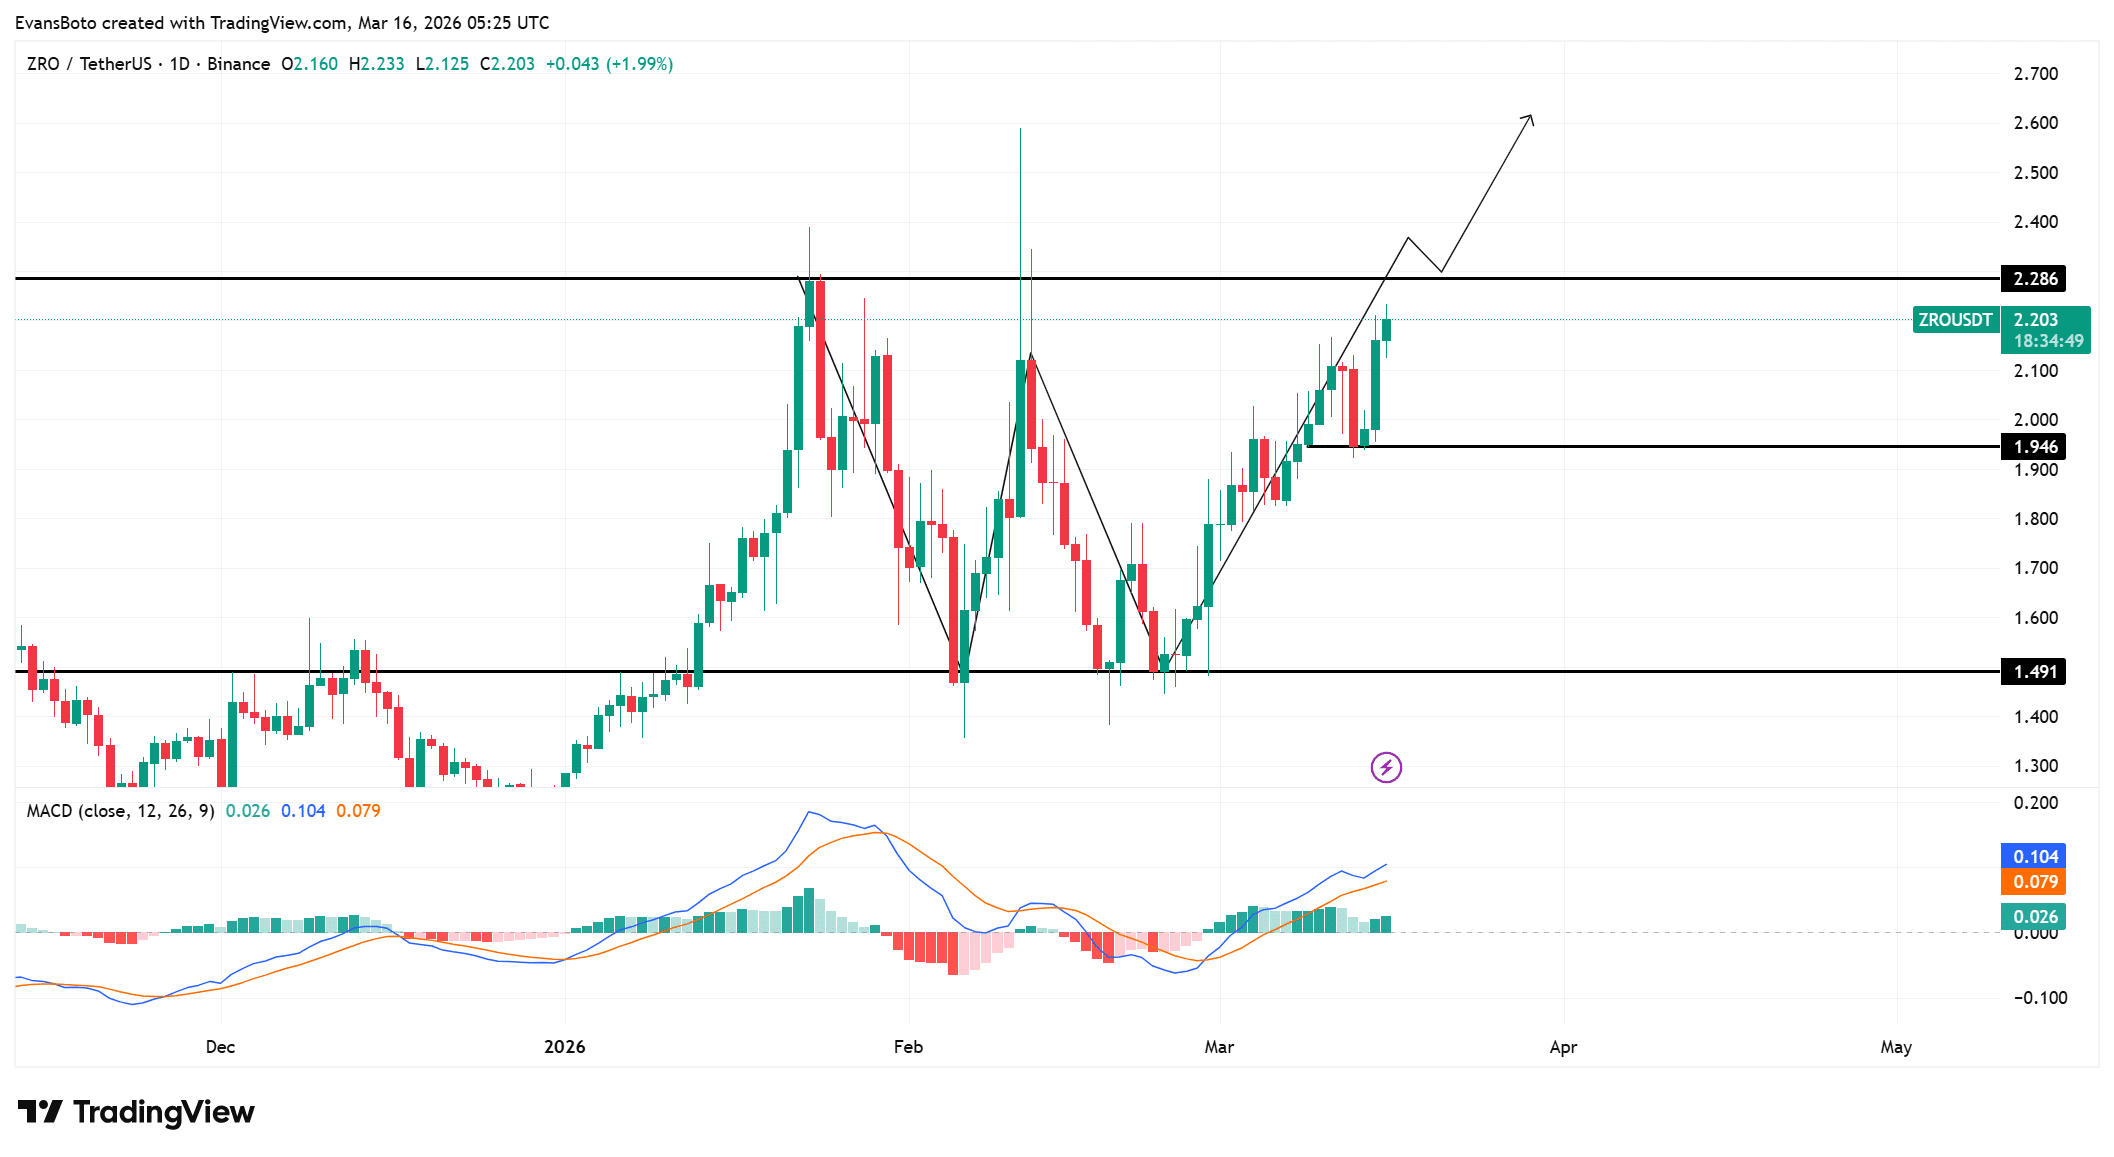
ZRO climbs toward major resistance barrier

Recent price action shows LayerZero recovering strongly from the $1.491 support level and steadily advancing toward the $2.286 resistance zone.

Buyers regained control after the February decline pushed the price briefly below $1.60. Since then, a sequence of higher lows has developed across the daily chart.

This structure reflects improving trend stability. Price has already reclaimed the intermediate $1.946 level, which now acts as a support pivot.

However, the $2.286 region represents a major barrier where previous rallies stalled earlier this year. Sellers previously defended that zone aggressively.

If buyers maintain pressure near current levels, price could attempt another breakout toward higher targets.

The MACD line currently sits around 0.104, while the signal line remains near 0.079, confirming a positive crossover.

Histogram bars have also turned green near 0.026, showing strengthening buying pressure over recent sessions. This configuration normally appears during early trend recovery phases.

Source: TradingView

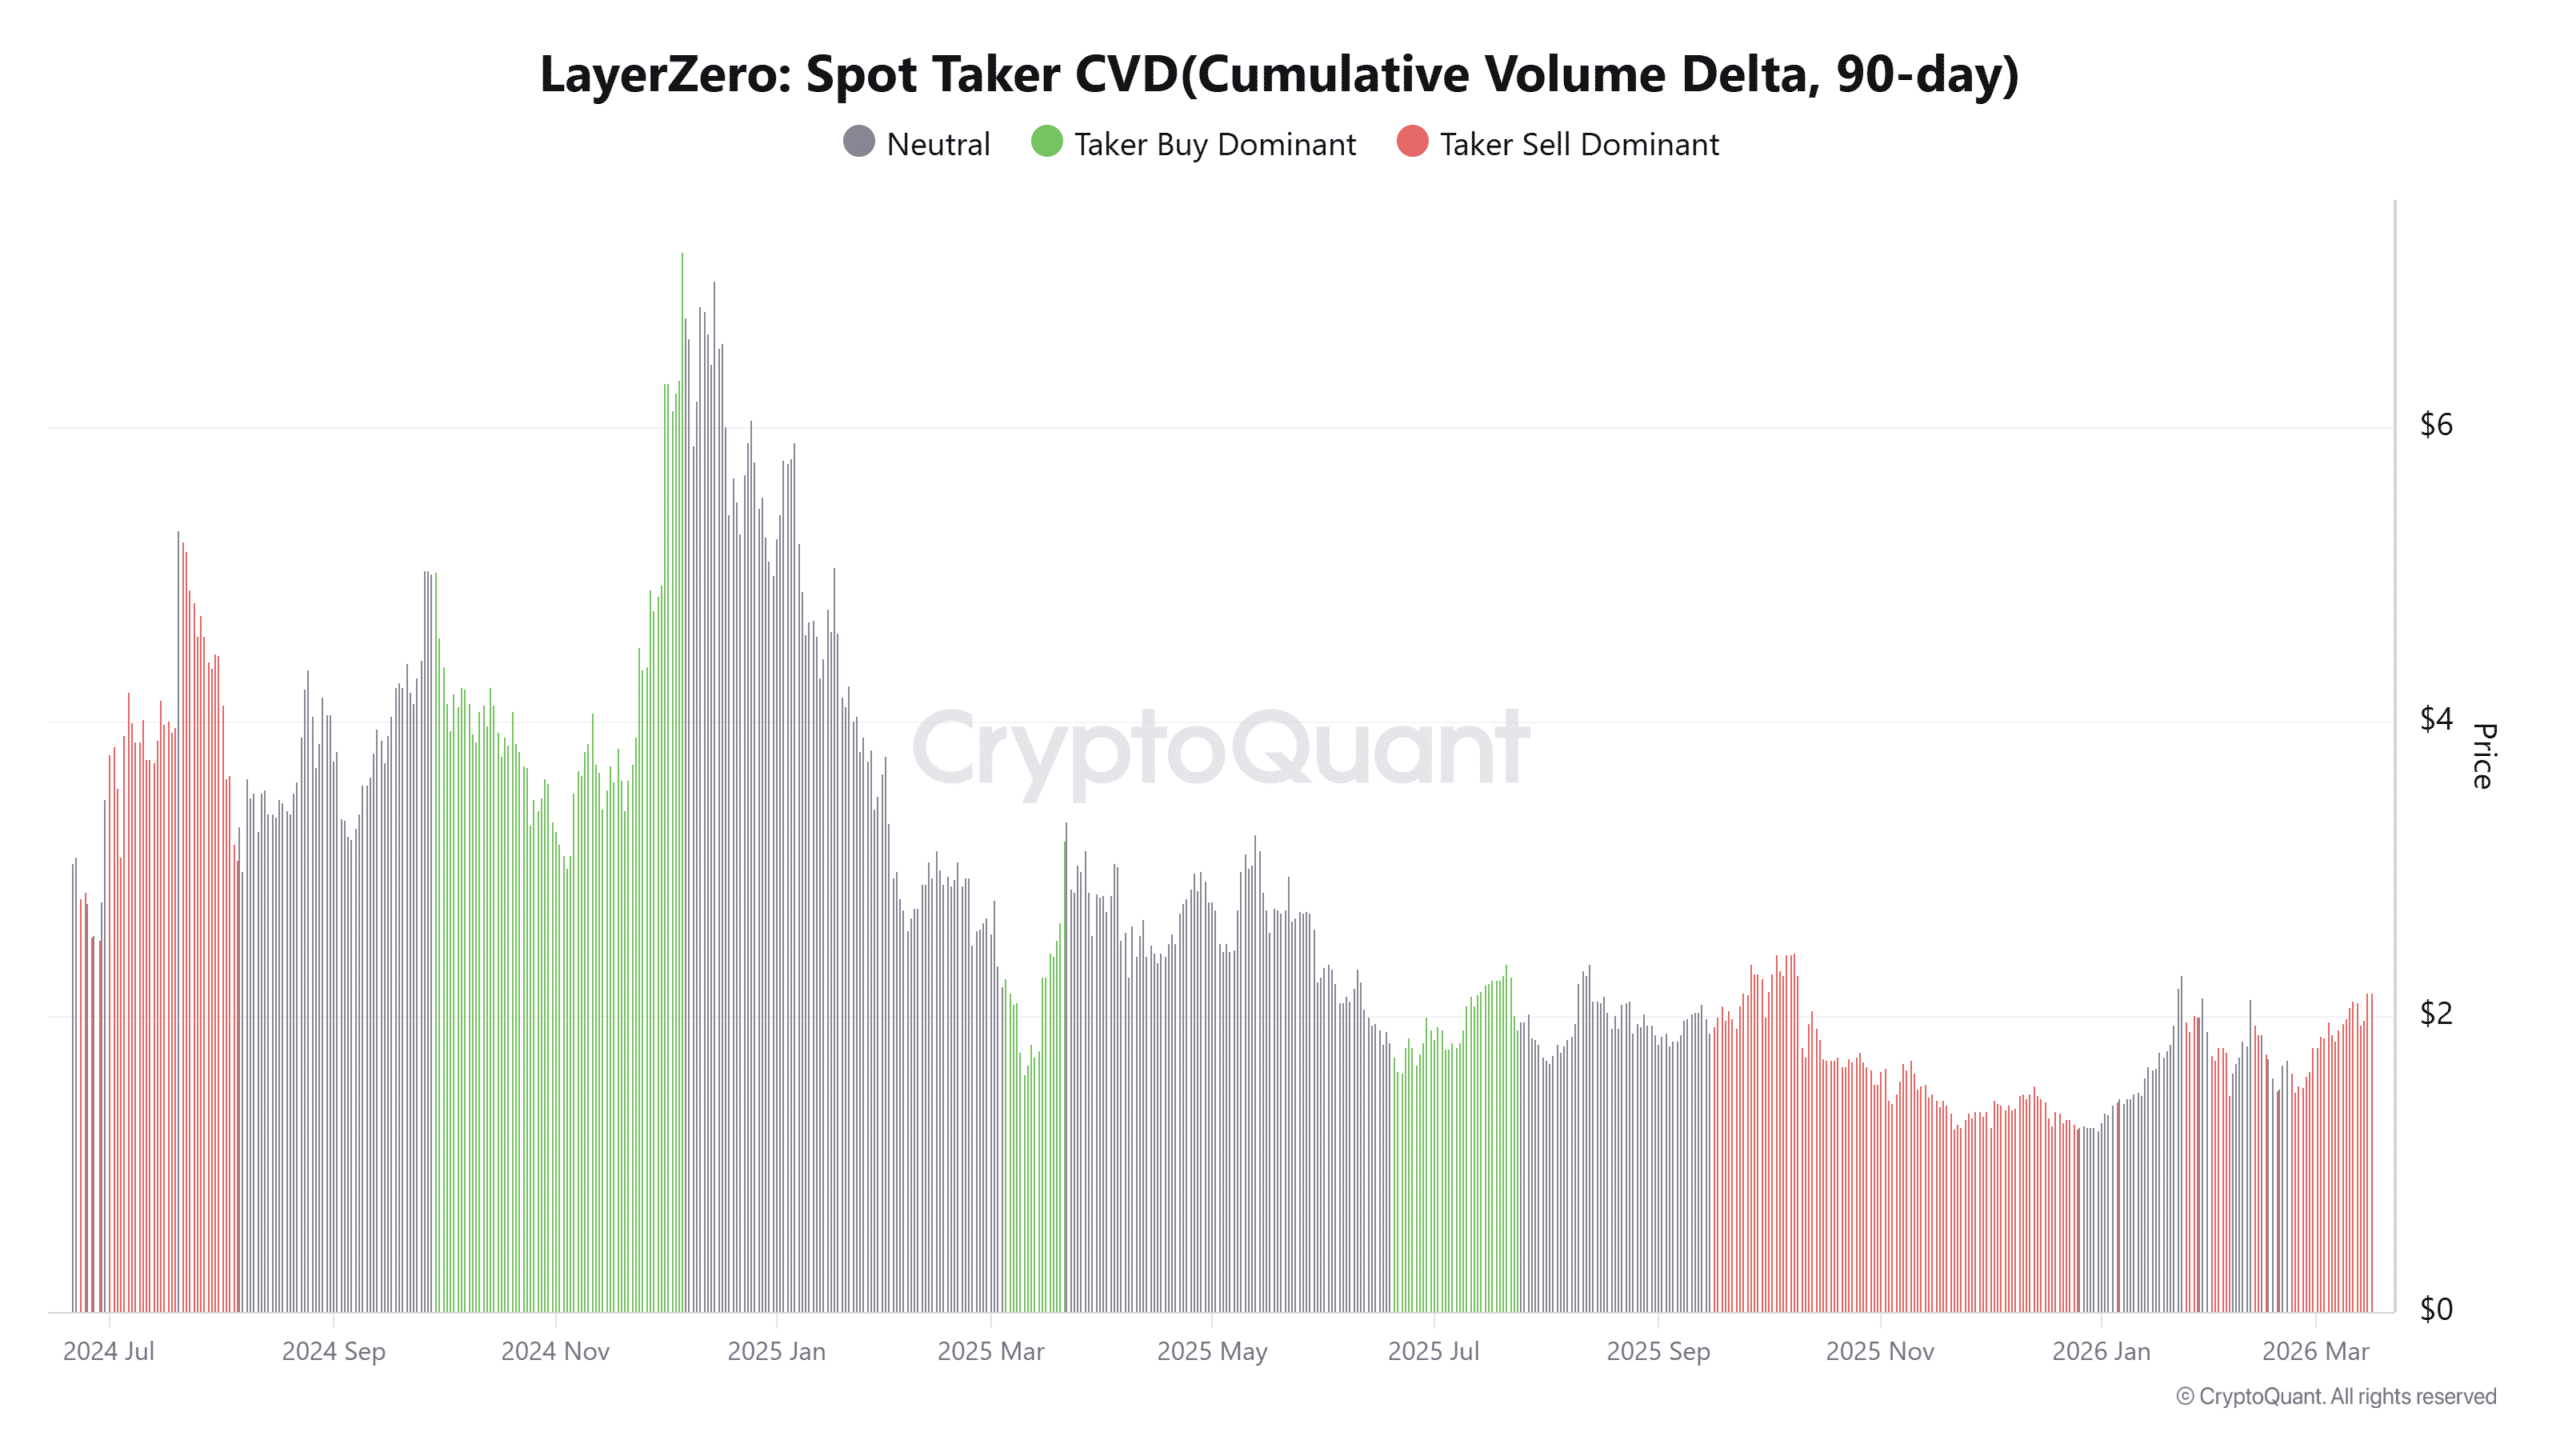
Spot market overheating raises caution signals

While price strength has attracted buyers, Spot market data suggests traders have started pushing activity into overheated territory.

The Spot Volume Bubble Map currently signals overheating conditions following the rapid surge in trading activity. Large bursts of volume often appear when speculative interest intensifies.

However, the 90-day Spot Taker CVD continues reflecting taker sell dominance, indicating that market sell orders still outweigh aggressive buying.

This imbalance creates a conflicting signal for short-term direction. Price rises while sellers remain active, which sometimes leads to brief volatility spikes.

Source: CryptoQuant

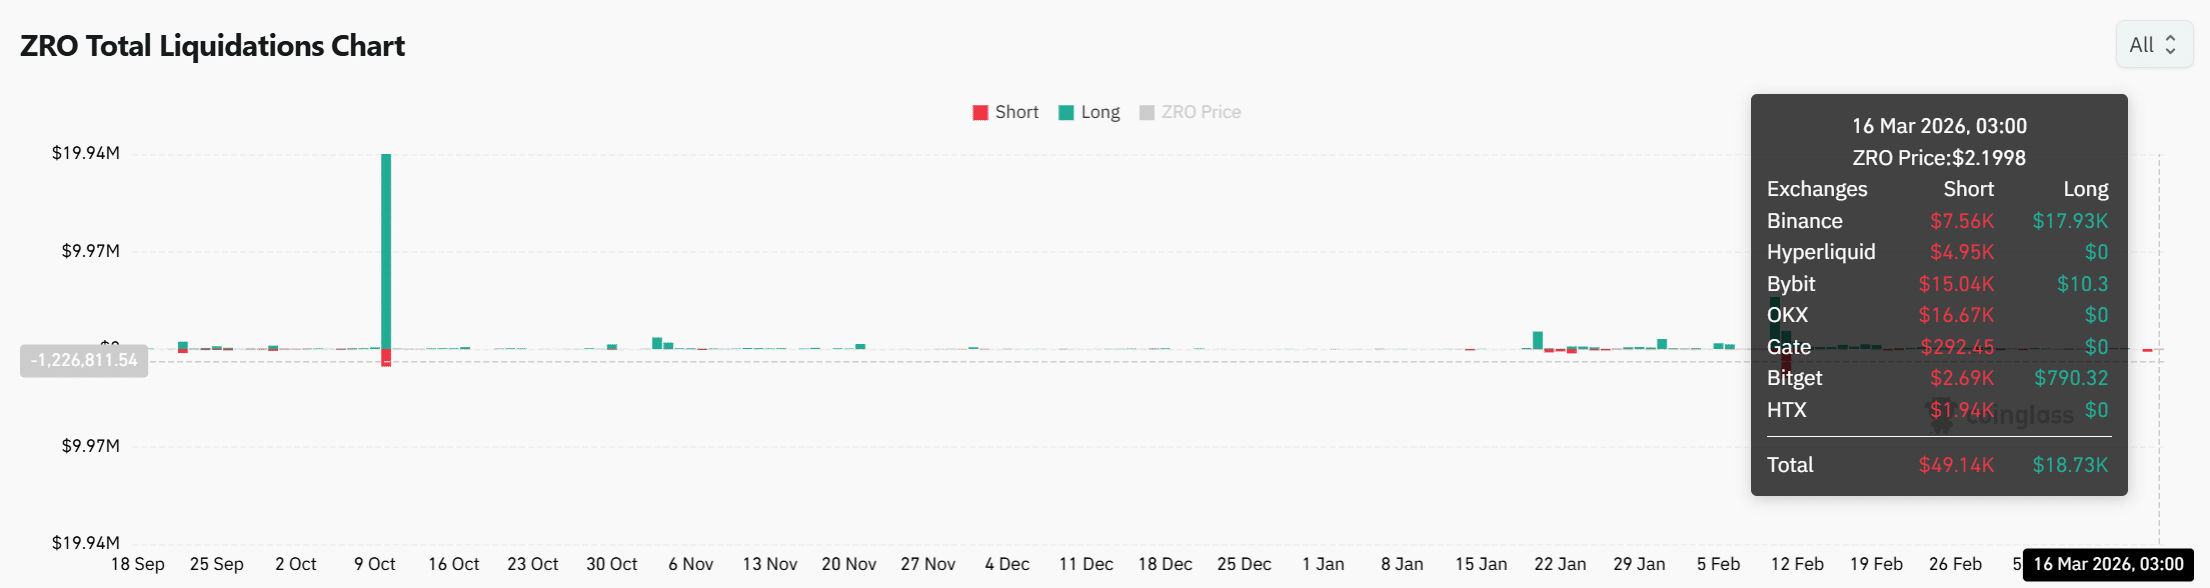
Short liquidations hint at growing volatility

Derivatives data has also started reflecting the renewed price expansion across LayerZero markets. The total liquidation chart shows short positions absorbing slightly higher pressure during the latest move.

At the latest data point, short liquidations reached about $49.14K, while long liquidations remained near $18.73K.

This imbalance shows that rising prices have forced several short traders to close positions. Forced exits usually amplify volatility because liquidations trigger additional buying pressure.

Exchanges such as OKX and Bybit have recorded some of the largest short liquidations. However, the overall scale of liquidations remains moderate compared with earlier spikes.

Source: CoinGlass

LayerZero’s rally has pushed the price close to the $2.286 resistance, while indicators and liquidation data suggest strengthening market activity.

However, overheating spot signals and persistent taker sell dominance introduce short-term uncertainty.

If buyers sustain pressure near current levels, ZRO could challenge resistance again. However, heavy selling activity may still slow the advance before a confirmed breakout.


Final Summary

  • Growing participation has revived LayerZero interest; however, resistance pressure could still challenge sustained upside continuation soon.
  • Rising volatility and strong buyer activity could sustain ZRO’s recovery if resistance pressure weakens across markets.

Domande pertinenti

QWhat was the percentage increase in LayerZero (ZRO) over the last 24 hours and what key resistance level is it approaching?

ALayerZero rallied more than 11% in the last 24 hours and is approaching the key resistance level of $2.286.

QWhat technical indicator is mentioned as confirming a positive crossover and what does this signal?

AThe MACD indicator is mentioned, with the MACD line at 0.104 and the signal line at 0.079, confirming a positive crossover which is a signal that often appears during early trend recovery phases.

QAccording to the Spot Volume Bubble Map, what condition is the market signaling and what does a 90-day metric show?

AThe Spot Volume Bubble Map is signaling overheating conditions, while the 90-day Spot Taker CVD continues to reflect taker sell dominance, indicating that market sell orders still outweigh aggressive buying.

QWhat does the imbalance between short and long liquidations suggest about recent market activity?

AThe imbalance, with short liquidations at $49.14K and long liquidations at $18.73K, suggests that rising prices have forced short traders to close positions, which can amplify volatility by triggering additional buying pressure.

QWhat are the two potential outcomes for ZRO's price mentioned in the final summary regarding resistance?

AThe final summary states that if buyers sustain pressure, ZRO could challenge the $2.286 resistance again, but heavy selling activity may slow the advance before a confirmed breakout occurs.

Letture associate

Exclusive from Yingke | Tang Wenbin's 'Yuanli Lingji' Merges with Logistics Robotics Company, and Secures Investment from Zhipu, SenseTime, Jieyue, and Others

Exclusive report: Embodied AI company "Yuanli Lingji" recently completed a new round of financing from major AI model firms including Zhipu AI, Stepfun, and SenseTime, alongside continued investments from industrial backers like Huaqin and SAIC Hengxu. Founded in March 2025 by Tang Wenbin, former co-founder and CTO of Megvii, Yuanli Lingji is a general-purpose embodied AI model company. In a notable move, the company has merged with logistics robotics firm "Atomix" (formerly known as Yuanli Juhe) through a share acquisition. Atomix, which originated from Megvii's logistics robotics business led by Tang in 2016 and was spun off in July 2024, has grown to become the world's second-largest supplier of pallet shuttle robots, with annual revenue nearing 1 billion RMB and over 500 projects globally for clients like Uniqlo and CATL. This merger aims to break the industry's "data deadlock" by combining Atomix's extensive real-world operational data from more than 20 countries with Yuanli Lingji's model training capabilities. The company's embodied AI model "DM0" utilizes a cross-domain training approach, integrating internet semantics, autonomous driving rules, and robotics data to achieve hardware-agnostic, precise manipulation even with a compact 2.4B parameter size. The collective investment from key AI players and the strategic merger signal a shift in the competitive landscape, as major model companies pivot from language tokens to physical actions ("from Token to Action"). The industry is entering a consolidation phase where hardware, AI models, data, and application scenarios converge to scale embodied intelligence, a trend mirrored by recent moves from giants like ByteDance and Skild AI.

marsbit4 min fa

Exclusive from Yingke | Tang Wenbin's 'Yuanli Lingji' Merges with Logistics Robotics Company, and Secures Investment from Zhipu, SenseTime, Jieyue, and Others

marsbit4 min fa

U.S. Stock Market Trends: Dow Hits New High, Nasdaq Falls, Whom Did Broadcom's Slap Wake Up?

U.S. Stocks Split: Dow Hits Record High as Nasdaq Slips; Broadcom's Plunge Sparks Rotation On June 4, the U.S. stock market saw a sharp divergence. The Dow Jones surged 875 points (+1.73%) to a record high of 51,561.93, while the Nasdaq Composite edged down 0.09%. The S&P 500 rose 0.41%. The primary catalyst was a sharp sell-off in AI-related chip stocks, led by Broadcom (AVGO). Despite reporting a 143% year-over-year jump in AI semiconductor revenue to $10.8 billion, the company's shares plunged about 14%. This was triggered by its maintained long-term AI revenue target, which failed to meet heightened expectations for a stock that had gained 55% this quarter and traded at a high P/E ratio. The slide dragged down the broader semiconductor sector and the technology板块. Conversely, money rotated into sectors like Healthcare (+3.14%), Financials (+2.67%), and Real Estate (+1.87%). UnitedHealth and Goldman Sachs were major contributors to the Dow's gains. The rotation was attributed to a search for value outside overheated tech names and a slight dip in Treasury yields. In other major news, SpaceX confirmed its IPO for June 12, targeting a record $75 billion raise at a ~$1.75 trillion valuation. Additionally, initial jobless claims rose to a four-month high, adding nuance to the labor market narrative ahead of the key May non-farm payrolls report. The day's action signaled that while the AI growth story remains intact, excessive valuations are prompting a market reassessment. Funds are moving, at least temporarily, from high-flying tech to more defensive and value-oriented sectors. The sustainability of this rotation hinges on upcoming economic data, particularly the jobs report, and the market's absorption of the massive SpaceX IPO.

marsbit7 min fa

U.S. Stock Market Trends: Dow Hits New High, Nasdaq Falls, Whom Did Broadcom's Slap Wake Up?

marsbit7 min fa

From 'Old Dogs' to 'New Darlings': How AI is Revaluing Old Infrastructure, from Dell to Nokia

"Old Dogs" Become AI's New Darlings: Revaluing Legacy Infrastructure The AI investment narrative is shifting. Beyond the spotlight on core chipmakers like Nvidia, a new wave of interest is rising for legacy tech companies—Dell, HPE, Nokia, Cisco, Corning, Western Digital—once labeled as slow-growth, outdated stories. This resurgence stems from AI's evolution from model development to real-world deployment, creating massive demand for physical infrastructure. As AI moves into data center construction and enterprise adoption, the focus turns to who can actually build and deliver complex systems. These established players hold decades of experience in supply chains, integration, networking, and enterprise delivery—assets now critical for scaling AI. The revaluation can be grouped into three key infrastructure areas: 1. **Servers & Integration (e.g., Dell, HPE):** They are becoming essential system integrators, transforming GPUs into full-scale AI servers with networking, power, and cooling, then delivering them to clients. Strong recent earnings and AI-specific revenue/order growth for Dell and HPE underscore this shift. 2. **Networking & Connectivity (e.g., Corning, Nokia, Cisco):** As AI clusters grow, high-speed data transfer becomes paramount. Corning benefits from fiber demand for data center links, Nokia is exploring AI-integrated wireless networks (AI-RAN), and Cisco sees surging orders for data center switches—all critical for efficient AI operations. 3. **Storage (e.g., Western Digital, Seagate):** The AI data explosion requires vast capacity. Beyond high-speed memory (HBM), there's growing need for high-capacity HDDs to store training data, logs, video, and cold/archival data cost-effectively. This revaluation, however, is not a blanket endorsement. True reassessment requires concrete proof: AI-driven orders and revenue growth, upward revisions to company guidance, and sustainable improvements in profit quality, not just top-line sales. In essence, AI is not turning all old tech firms into high-growth stocks; it is selectively re-pricing the "old assets" of companies that are mission-critical for building the new AI infrastructure, transforming their legacy capabilities into renewed growth engines.

marsbit16 min fa

From 'Old Dogs' to 'New Darlings': How AI is Revaluing Old Infrastructure, from Dell to Nokia

marsbit16 min fa

Trading

Spot
Futures
活动图片