Kaspa: Can KAS target $0.055 after breaking KEY price hurdle?

ambcryptoPubblicato 2026-03-17Pubblicato ultima volta 2026-03-17

Introduzione

Kaspa (KAS) has gained significant attention with an 11.50% price surge, breaking a key resistance level at $0.035. Trading at $0.03609, its volume spiked over 130% to $36.88 million, indicating strong market interest. A daily close above this level could propel KAS toward $0.055, though $0.040 poses the next resistance. The RSI at 72.02 suggests overbought conditions, hinting at a possible correction, while the ADX indicates weak trend momentum. Derivatives data show mixed sentiment: short-term traders are bullish with $1.02M in long positions, but long-term holders may be profit-taking, as $1.22M worth of KAS moved to exchanges, signaling potential selling pressure.

Kaspa [KAS] is garnering widespread attention from crypto enthusiasts due to its impressive performance. The asset has not only gained amid the broader market recovery but has also broken a key hurdle. This signals that a massive upside rally may be on the horizon.

According to CoinMarketCap data, KAS has climbed over 11.50% in the past 24 hours and was trading at $0.03609 at press time. Additionally, market participation has seen a significant increase. This was reflected in trading volume, which surged by more than 130% to $36.88 million.

Rising trading volume shows heightened participation from traders and investors during the price recovery and suggests that market participants are increasingly interested in the current trend.

Kaspa price action and technical analysis

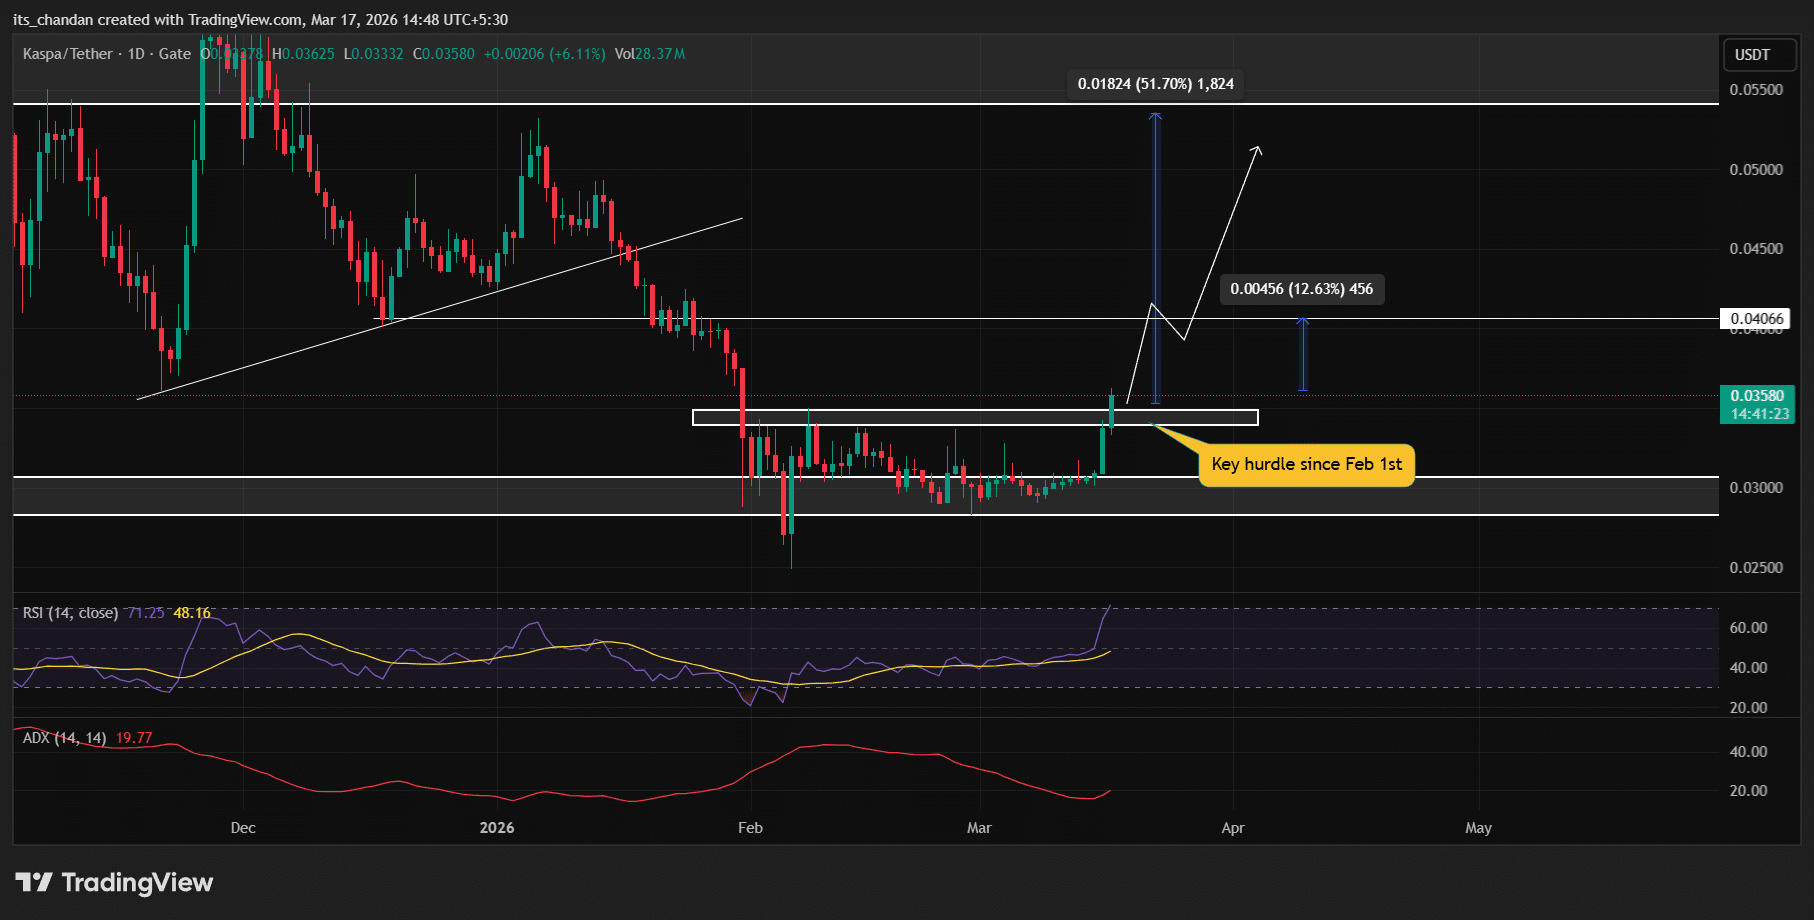
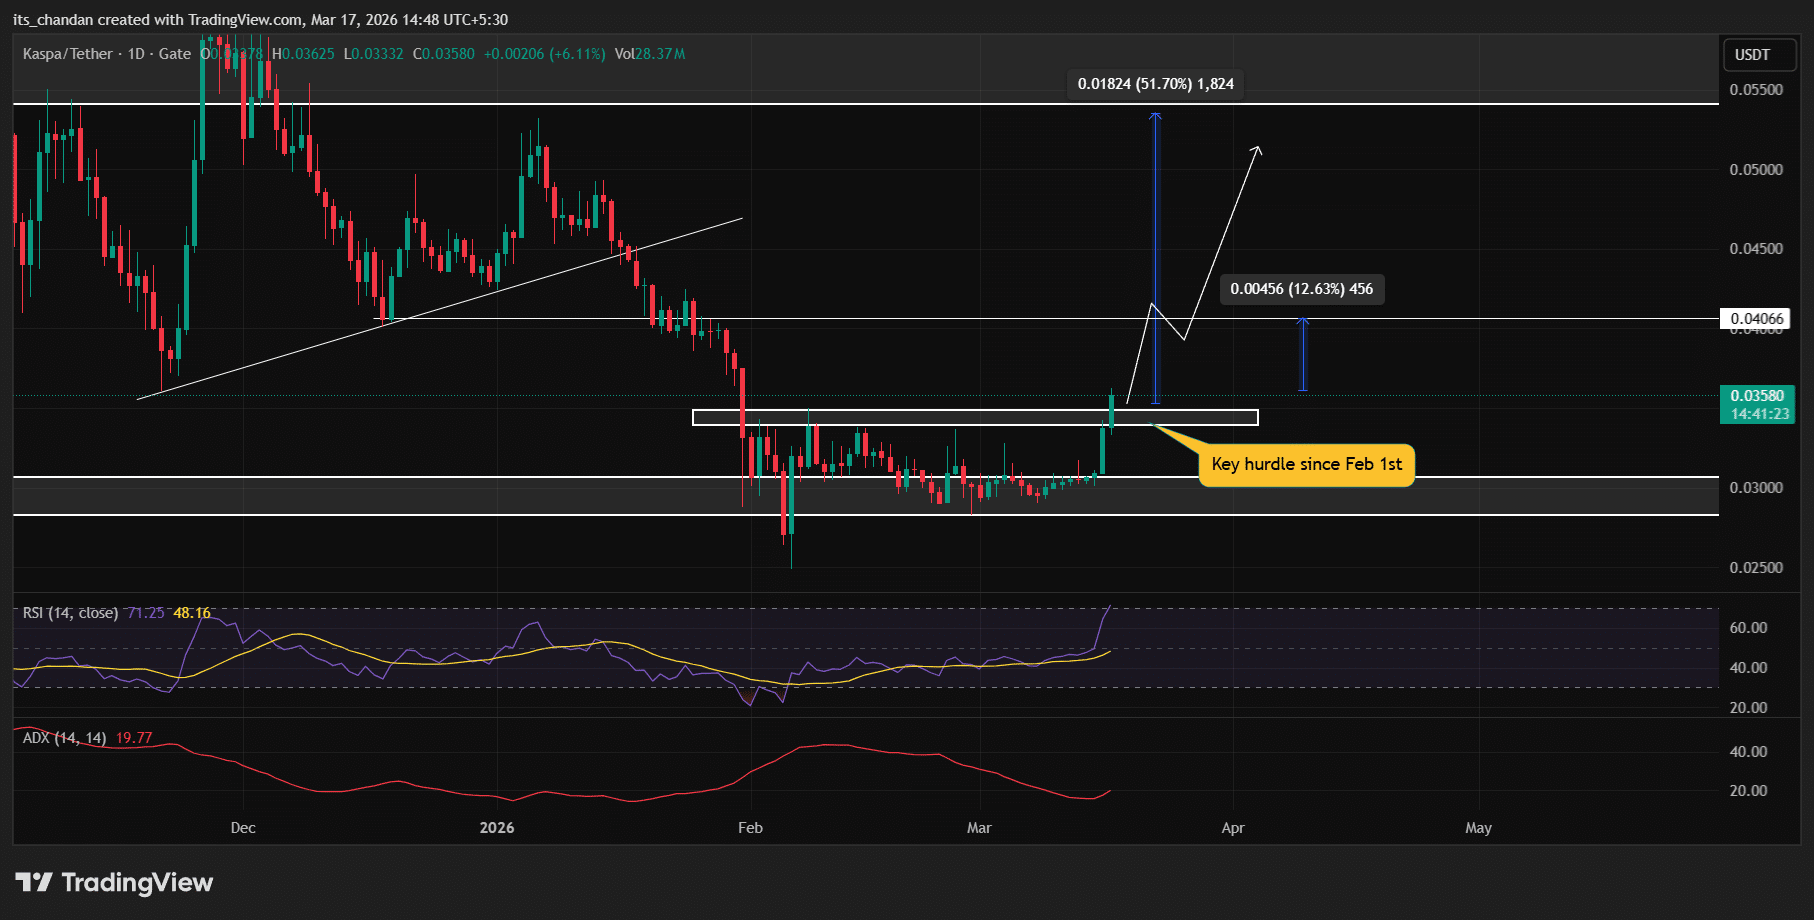
AMBCrypto’s daily chart analysis shows KAS turning bullish and primed for a major rally. With the recent upside move, the asset has broken out of a key resistance level of $0.035. A level that it had been facing since the 1st of February 2026.
Source: TradingView

If KAS closes a daily candle above this key level, it could see a price jump of 51% and may reach the $0.055 level. However, $0.040 appears to be a key resistance level that could act as a hurdle for the asset in its upcoming rally.

Despite the bullish breakout, the technical indicator Relative Strength Index (RSI) has reached 72.02 at the time of writing. This indicates that the asset is in overbought territory, suggesting that the asset might see a potential correction before the next leg up.

Meanwhile, the Average Directional Index (ADX), which measures trend strength, stood at 19.77, below the key threshold of 25, indicating weak directional momentum in the asset.

KAS sees mixed sentiment among market participants

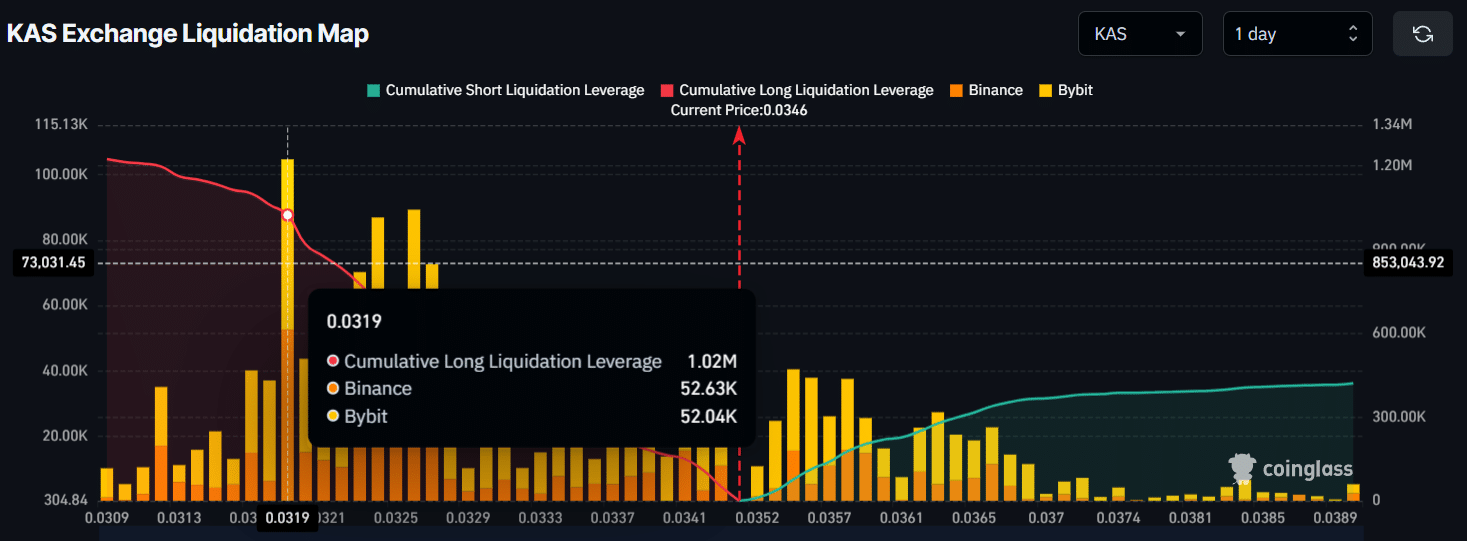
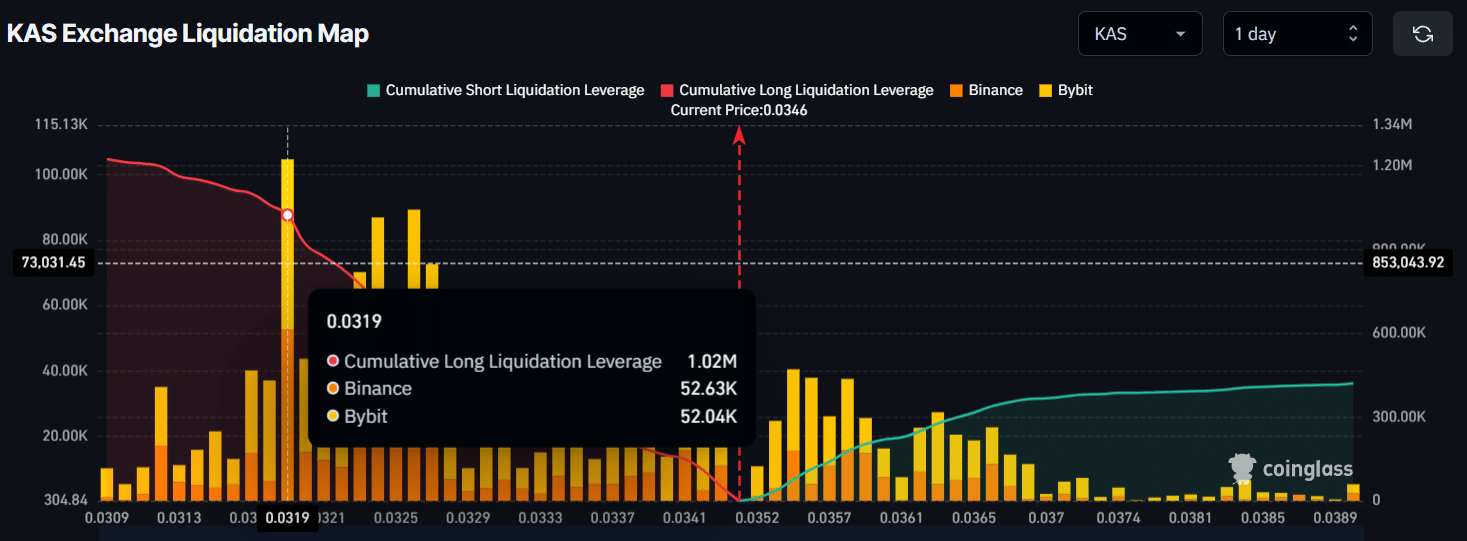
In addition to the price action, CoinGlass reveals that both investors and traders have mixed sentiment, as short-term participants are following the trend while long-term holders appear to be booking profits.

Data shows that $0.0319 on the lower side (support) and $0.0358 on the upper side (resistance) are two major levels where traders are overleveraged. In fact, traders at these levels have built $1.02 million in long leveraged positions and $177.6K in short leveraged positions.

However, these positions could be liquidated if the KAS price moves in either direction. Based on this data, it appears that bulls are dominating the asset, while sellers’ interest seems to be fading.
Source: CoinGlass

Meanwhile, data on KAS spot inflows/outflows shows that over the past 48 hours, a massive $1.22 million worth of the asset has flowed into exchanges. The movement of assets from wallets to exchanges typically indicates that long-term holders may be preparing for a sell-off. This sign is considered a bearish sign for the asset.
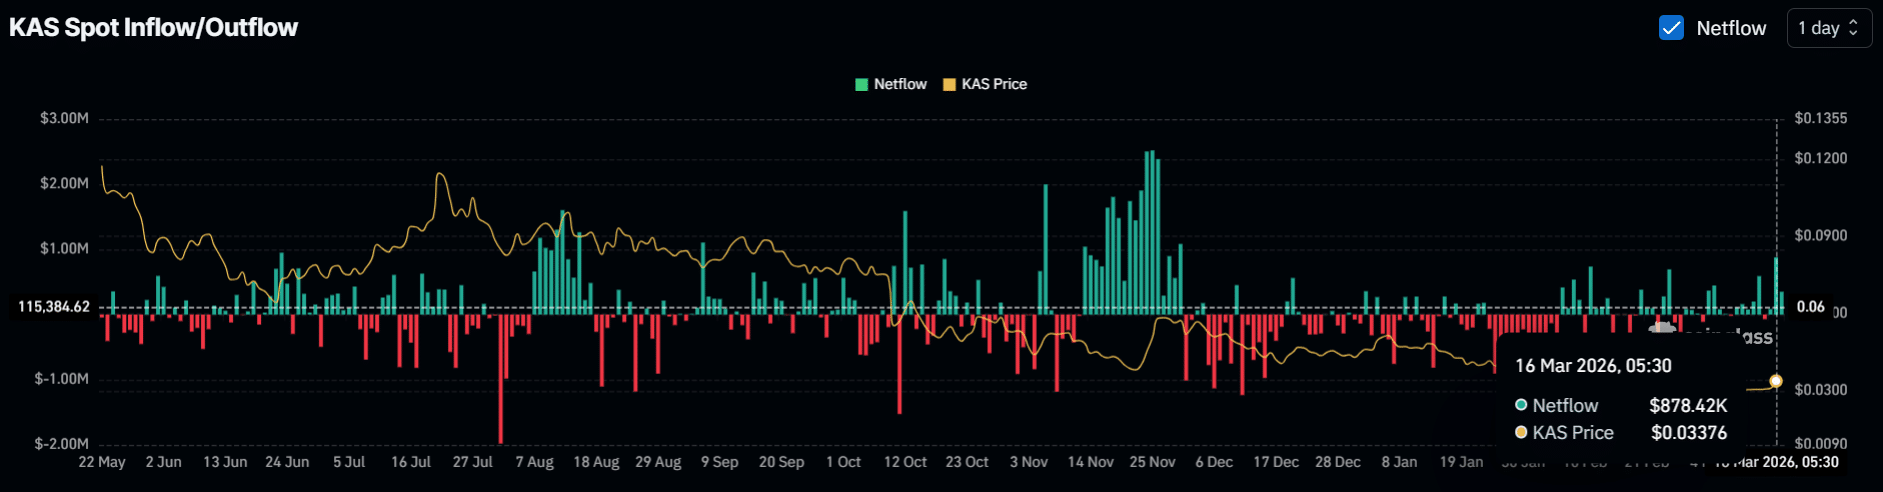
Source: CoinGlass

Final Summary

  • With an 11.50% price jump, Kaspa has broken out of a key resistance level.
  • Derivatives data indicate that short-term participants are following the trend, while long-term holders appear to be showing fading interest.


Crypto di tendenza

Letture associate

Interview with Robinhood Executive: Meme + Tokenized US Stocks as "Barbell" Customer Acquisition Strategy, All Business Lines Achieve Hundreds of Millions in Revenue

Interview with Robinhood executive Johann Kerbrat reveals the company's "barbell" customer acquisition strategy for its new Robinhood Chain, combining meme tokens with tokenized stocks. Three weeks after mainnet launch, the chain has seen over $3B in weekly DEX volume and 105M transactions. Kerbrat explains the logic behind the permissionless chain: meme tokens attract DeFi users, while tokenized real-world assets (RWA), currently over 90 US stocks and ETFs accessible in 120+ countries, serve global users. The goal is to bring Robinhood's 27 million funded accounts on-chain by simplifying DeFi with a user-friendly interface, exemplified by features like Robinhood Earn which offers yield without requiring wallet management. Built on Arbitrum's technology stack for its speed, low cost, and Ethereum's security, the chain focuses on financial products like Earn, spot trading, and perpetuals. Kerbrat downplays direct competition with platforms like Base, emphasizing the goal of expanding the overall market for on-chain assets. He details selective partnerships (e.g., Morpho, Lighter) based on compliance, unique UX, and differentiation. While regulatory clarity is pending for US perpetuals, the expansion continues via Bitstamp in Europe. Finally, Kerbrat positions Robinhood as a "super app" integrating stocks, options, crypto, banking, and AI trading, with all major business lines generating hundreds of millions in revenue. For the chain, current priority is driving adoption over maximizing gas fee revenue.

marsbit1 h fa

Interview with Robinhood Executive: Meme + Tokenized US Stocks as "Barbell" Customer Acquisition Strategy, All Business Lines Achieve Hundreds of Millions in Revenue

marsbit1 h fa

Fidelity Q3 Report: BTC, ETH, and SOL Continue to Build Bottoms; How Much Further Will This Crypto Bear Market Go?

Fidelity's Q3 Crypto Signal Report analyzes the current bear market, noting Bitcoin (BTC), Ethereum (ETH), and Solana (SOL) are in a prolonged bottoming phase. Key indicators like the weighted Net Unrealized Profit/Loss (NUPL) have turned negative (-0.01), signaling the market is slightly below its aggregate cost basis, with BTC acting as the primary stabilizing asset. BTC's dominance has risen to 68%, indicating a lack of capital rotation to other digital assets. Performance has been weak across the board, with BTC, ETH, and SOL down significantly year-to-date. Market sentiment is depressed, exacerbated by substantial outflows from spot ETPs and a challenging macro environment. The report compares the current ~203-day downtrend to historical ~300-day bottoming cycles, suggesting the process may be two-thirds complete, with late 2026 as a potential timeframe to monitor. For Bitcoin, NUPL at 0.09 indicates cautious sentiment, while momentum signals remain negative. The Yardstick metric points to potential undervaluation relative to network security (hashrate). Ethereum's NUPL is deep in the "capitulation" zone at -0.43, a historically positive signal for future returns, though its momentum and network fee revenue are negative. Solana shows the deepest NUPL at -0.72 but demonstrates relative resilience in on-chain activity and stablecoin transfer volume. The report concludes that while several metrics are near historical capitulation levels, a definitive market bottom has not yet been established. The path forward likely involves continued consolidation, with BTC's relative strength and fundamental on-chain usage for ETH and SOL providing key areas for investor observation.

marsbit1 h fa

Fidelity Q3 Report: BTC, ETH, and SOL Continue to Build Bottoms; How Much Further Will This Crypto Bear Market Go?

marsbit1 h fa

Trading

Spot

Articoli Popolari

Come comprare KAS

Benvenuto in HTX.com! Abbiamo reso l'acquisto di kaspa (KAS) semplice e conveniente. Segui la nostra guida passo passo per intraprendere il tuo viaggio nel mondo delle criptovalute.Step 1: Crea il tuo Account HTXUsa la tua email o numero di telefono per registrarti il tuo account gratuito su HTX. Vivi un'esperienza facile e sblocca tutte le funzionalità,Crea il mio accountStep 2: Vai in Acquista crypto e seleziona il tuo metodo di pagamentoCarta di credito/debito: utilizza la tua Visa o Mastercard per acquistare immediatamente kaspaKAS.Bilancio: Usa i fondi dal bilancio del tuo account HTX per fare trading senza problemi.Terze parti: abbiamo aggiunto metodi di pagamento molto utilizzati come Google Pay e Apple Pay per maggiore comodità.P2P: Fai trading direttamente con altri utenti HTX.Over-the-Counter (OTC): Offriamo servizi su misura e tassi di cambio competitivi per i trader.Step 3: Conserva kaspa (KAS)Dopo aver acquistato kaspa (KAS), conserva nel tuo account HTX. In alternativa, puoi inviare tramite trasferimento blockchain o scambiare per altre criptovalute.Step 4: Scambia kaspa (KAS)Scambia facilmente kaspa (KAS) nel mercato spot di HTX. Accedi al tuo account, seleziona la tua coppia di trading, esegui le tue operazioni e monitora in tempo reale. Offriamo un'esperienza user-friendly sia per chi ha appena iniziato che per i trader più esperti.

217 Totale visualizzazioniPubblicato il 2024.12.12Aggiornato il 2026.06.02

Come comprare KAS

Discussioni

Benvenuto nella Community HTX. Qui puoi rimanere informato sugli ultimi sviluppi della piattaforma e accedere ad approfondimenti esperti sul mercato. Le opinioni degli utenti sul prezzo di KAS KAS sono presentate come di seguito.

活动图片












