Jito surges on 1000% volume spike – Will volatility stall JTO’s rally?

ambcryptoPubblicato 2026-03-24Pubblicato ultima volta 2026-03-24

Introduzione

Jito (JTO) surged 15.96% to $0.3314 with a 1000% spike in trading volume, indicating strong spot demand and renewed market interest. The price exited a descending channel, reclaiming the $0.2775 support and approaching the next resistance at $0.3376. RSI at 63 supports further upside without being overbought. However, spot taker CVD remains sell-dominant, suggesting profit-taking by retail traders. Open Interest surged 89.51%, reflecting increased leveraged positions that could fuel volatility. The breakout shows strength, but sustainability depends on whether buying demand absorbs selling pressure. If not, leveraged unwinding may trigger a sharp pullback.

Jito [JTO] has surged 15.96% to $0.3314 at press time, as trading volume exploded over 1000%, signaling a sharp influx of spot demand and renewed market participation. This expansion reflects a sudden shift in activity as buyers aggressively step in after a period of consolidation.

Notably, such volume growth does not emerge gradually; it reflects urgency and conviction from participants entering at scale. As a result, price has responded with a clean upward push, reinforcing the strength behind the move.

However, this surge also places JTO in a high-attention zone, where rapid inflows can accelerate both upside continuation and volatility depending on how follow-through demand evolves.

JTO breakout holds as RSI confirms strength

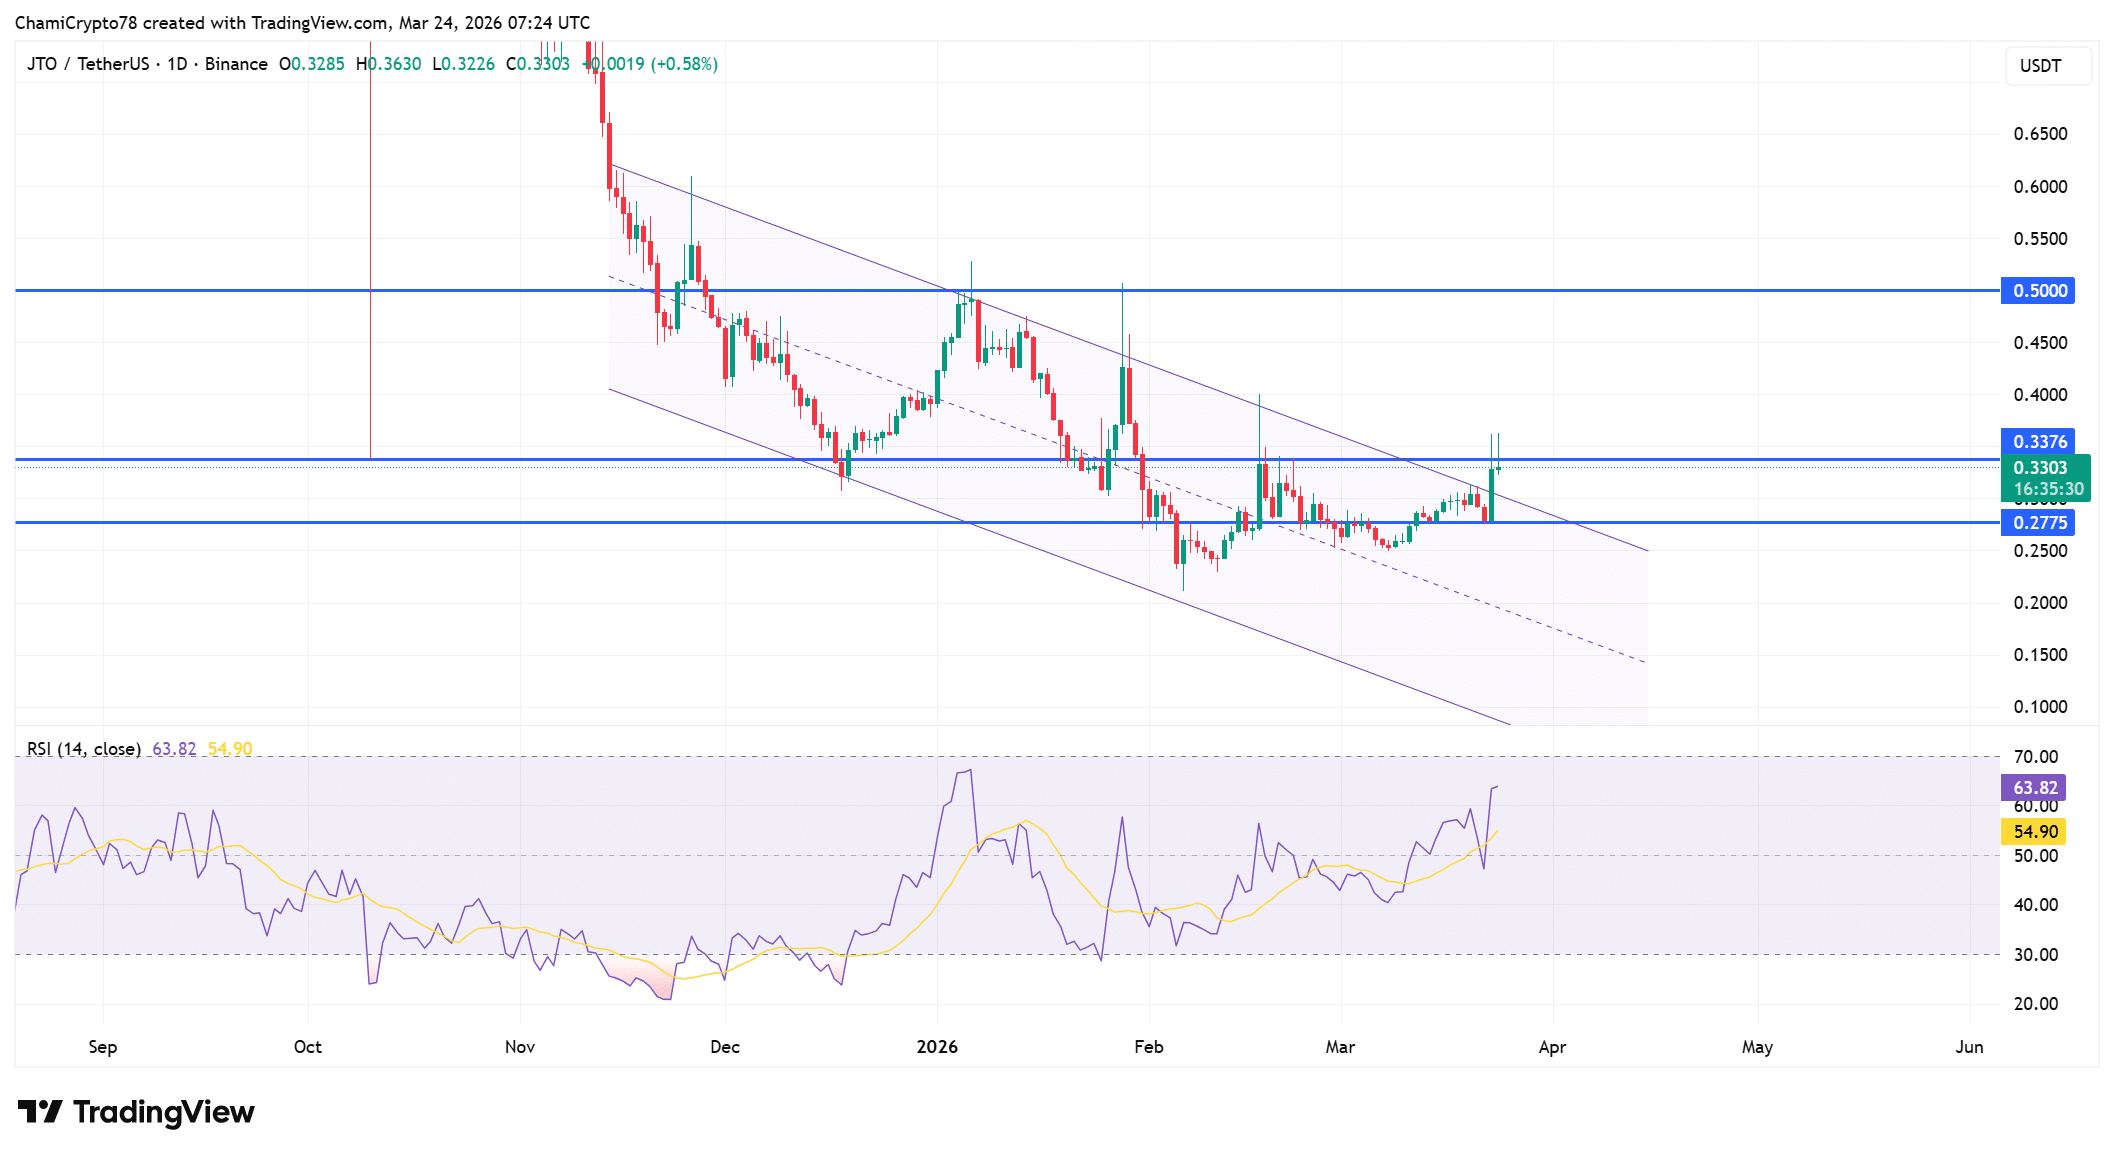
JTO has broken out of its descending channel after reclaiming the $0.2775 support, signaling a clear shift in short-term structure as buyers take control. This move reflects a transition from compression into expansion, with price no longer respecting the prior downward boundaries.

As a result, JTO now presses into the $0.3376 resistance, which acts as the next key level in this structure. At the same time, RSI has climbed toward 63 as of writing, reinforcing the strength behind this breakout without entering overbought territory. This positioning shows that the rally still has room to extend while maintaining stability.

Additionally, RSI has moved above its moving average, aligning with current price behavior and supporting continuation. However, holding above the breakout zone remains critical, as failure at this level could weaken the structure and pull the price back toward consolidation.

Source: TradingView

Sell pressure rises as retail locks profits

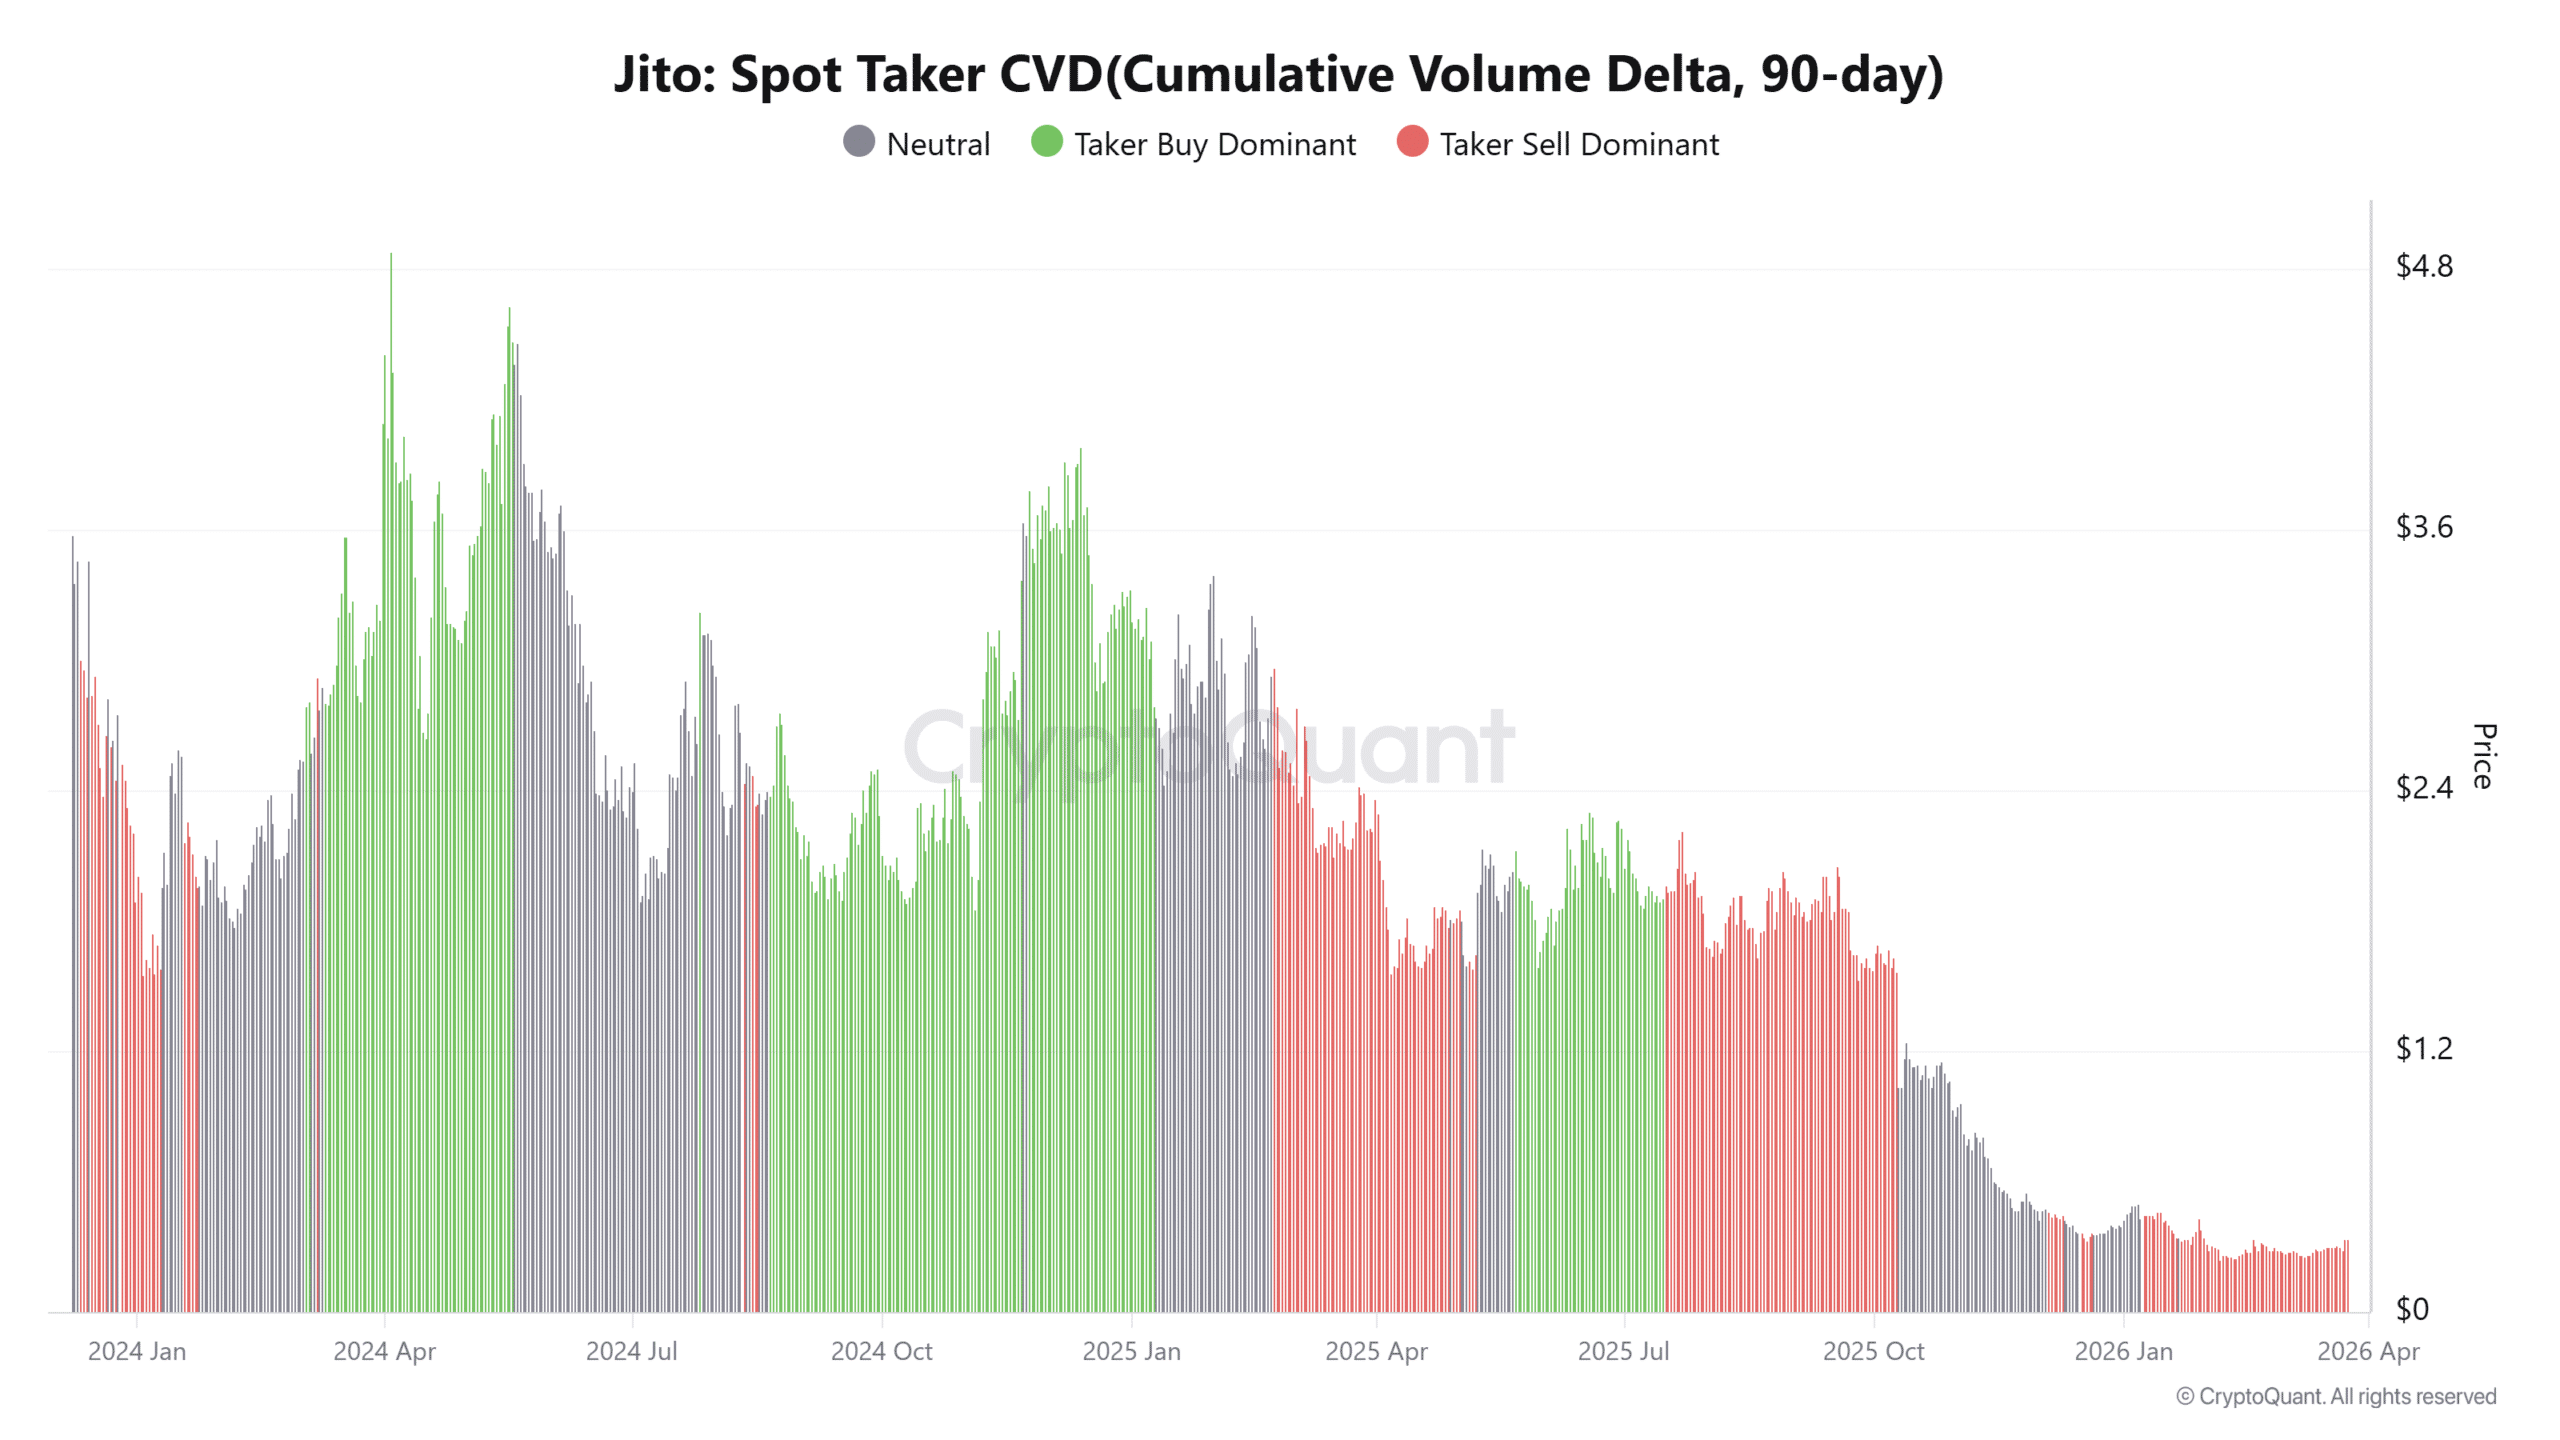
Despite the price breakout, Spot Taker CVD remains sell-dominant, revealing that market orders continue to lean toward selling rather than buying. This divergence highlights a key dynamic where price rises even as participants take profits into strength.

Such behavior often reflects retail traders exiting positions after the rally, while stronger hands absorb the supply. As a result, the ongoing move depends heavily on whether this selling pressure gets absorbed efficiently.

However, if sell dominance persists without sufficient demand, it could slow the rally and limit further upside expansion.

Source: CryptoQuant

Leverage builds fast as JTO open interest surges

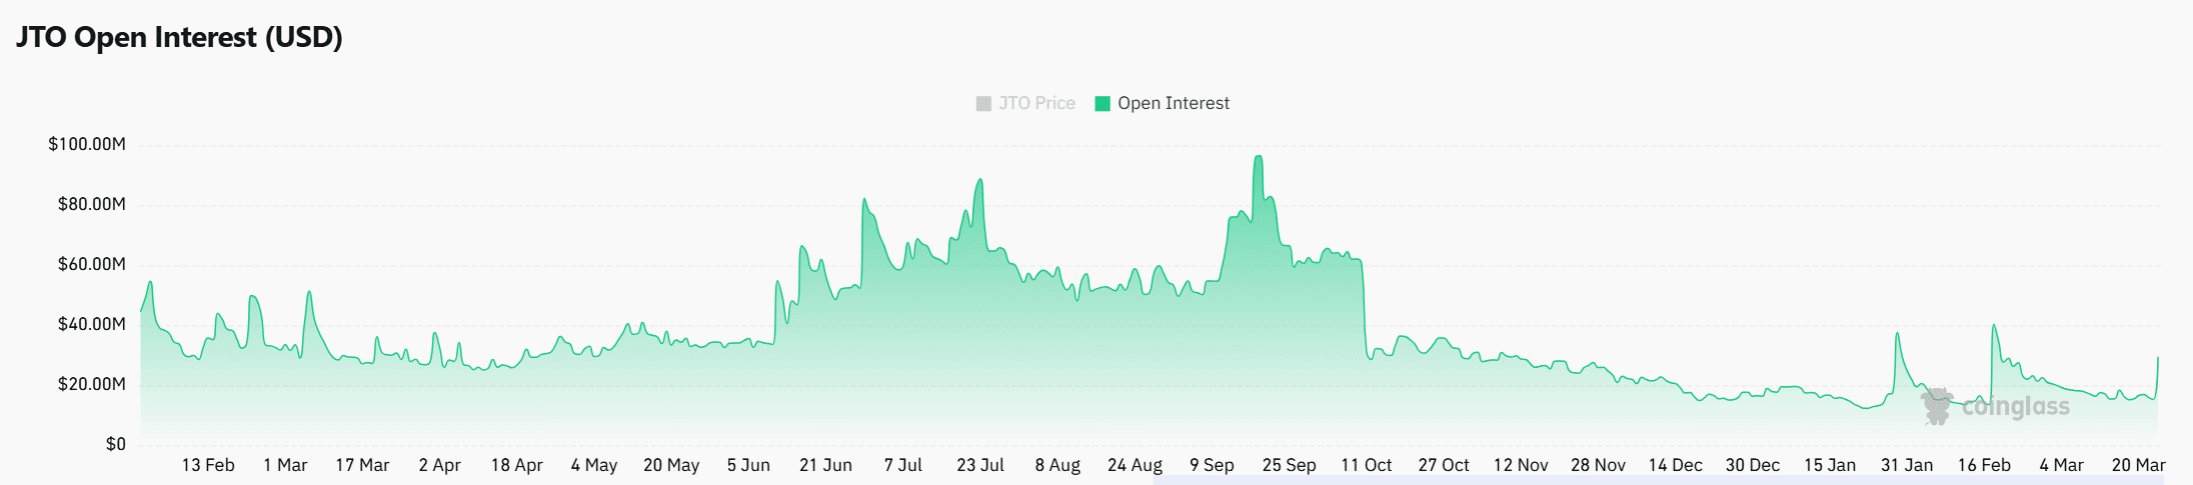
Open Interest (OI) has surged 89.51% to $28.97 million, indicating a sharp rise in leveraged positioning as traders enter the market aggressively. This increase reflects growing participation in derivatives, typically aligning with strong directional expectations.

As price and OI rise together, it suggests that traders are building positions anticipating continued upside. However, such rapid expansion also introduces risk, as crowded positioning can amplify volatility.

If prices continue higher, these positions could fuel further upside through forced liquidations. On the other hand, if price stalls near resistance, the same leverage could unwind quickly, triggering sharp downside moves driven by liquidations and position closures.

Source: CoinGlass

Conclusively, JTO’s breakout reflects strong structural recovery supported by volume expansion and rising leverage. However, sell-dominant order flow signals active profit-taking that could cap upside if demand weakens.

If buyers continue absorbing selling pressure, the breakout would likely sustain and extend higher. If not, the buildup in leveraged positions could accelerate a sharp pullback from current resistance levels.


Final Summary

  • JTO’s breakout reflects strong buyer control, but sustainability depends on absorbing persistent sell-side pressure near resistance.
  • Rising leverage alongside price would amplify gains, yet it also increases the risk of sharp liquidation-driven downside moves.

Domande pertinenti

QWhat is the current price of Jito (JTO) and by what percentage has it surged at press time?

AJito (JTO) is currently priced at $0.3314, representing a surge of 15.96% at press time.

QWhat key technical indicator is used to confirm the strength of JTO's breakout, and what is its current value?

AThe Relative Strength Index (RSI) is used to confirm the strength of the breakout, and it has climbed toward a value of 63, indicating strength without being overbought.

QDespite the price increase, what does the Spot Taker CVD data reveal about market orders?

AThe Spot Taker CVD data reveals that market orders remain sell-dominant, indicating that participants are taking profits into strength.

QHow much has Open Interest (OI) increased, and what does this surge indicate?

AOpen Interest (OI) has surged by 89.51% to $28.97 million, indicating a sharp rise in leveraged positioning as traders enter the market aggressively.

QWhat are the two main factors that could lead to a sharp downside move in JTO's price according to the conclusion?

AAccording to the conclusion, a sharp downside move could be triggered if buyers fail to continue absorbing selling pressure, or if the buildup in leveraged positions unwinds quickly due to prices stalling near resistance.

Letture associate

The Value Distribution of Stablecoins

**Summary: The Value Distribution of Stablecoins** The article argues that stablecoins are evolving from mere trading tools into broader channels for dollar access. It divides the stablecoin ecosystem into four layers to analyze how value is distributed: 1. **Issuance Layer:** Mints stablecoins, holds reserve assets, and captures the spread between reserve yield and user costs (e.g., Tether, Circle). This layer currently earns the largest profit margin. 2. **Infrastructure Layer:** Connects stablecoins to the traditional financial system, handling fiat on/off-ramps, banking integration, compliance (KYC/AML), and asset management (e.g., Bridge, BVNK). This is the "unglamorous" but critical work, building the essential bridges between crypto and real-world finance. 3. **Acquiring/Distribution Layer:** Integrates stablecoins into merchant systems, manages payment flows, and provides enterprise financial software (e.g., Stripe, Coinbase). They act as the access point for businesses. 4. **Application Layer:** The end-users and businesses that ultimately use stablecoins for payments, settlements, or as a store of value. They benefit from convenience but have little pricing power. The core thesis is that while the issuance layer currently dominates profits, the often-overlooked **infrastructure layer holds significant long-term potential**. The real challenge and barrier to mass adoption is not the on-chain transfer of stablecoins (which is simple), but the complex "last mile" integration into existing business workflows, banking systems, and regulatory frameworks across different countries. Companies in this layer are currently in a "land grab" phase, investing heavily to build networks, secure bank partnerships, and establish compliance pathways. While their position is currently pressured by the profitable issuers above and distribution platforms below, the article suggests that if stablecoins become a default financial rail for businesses, the infrastructure providers who have done the hard work of integration will ultimately gain strong pricing power and become entrenched, essential players.

marsbit5 h fa

The Value Distribution of Stablecoins

marsbit5 h fa

The Value Distribution of Stablecoins

The Value Distribution of Stablecoins The article argues that stablecoins are evolving from a mere trading tool into a broad "dollar channel." It analyzes the industry's value chain through four layers: 1. **Issuance Layer (e.g., Tether, Circle):** The top layer that mints stablecoins, holds reserve assets, and captures the thickest interest rate spread. 2. **Infrastructure Layer (e.g., Bridge, BVNK):** Connects stablecoins to the traditional financial system, handling critical but complex "dirty work" like fiat on/off-ramps, banking integration, compliance (KYC/AML), and cross-border settlement. 3. **Acquiring/Distribution Layer (e.g., Stripe, Coinbase):** Embeds stablecoins into merchant systems, manages payment flows, and integrates with enterprise software. 4. **Application Layer:** End-users and businesses that ultimately use stablecoins for payments, settlement, or storing value. The author posits that while the issuance layer currently captures the most profit, the most overlooked and potentially critical layer is infrastructure. The core challenge for stablecoin adoption isn't the on-chain transfer (which is simple), but bridging the gap between blockchain and the real-world financial system. This involves solving practical problems for businesses: fiat conversion, reconciliation, tax handling, and user onboarding. Infrastructure companies are currently in a difficult "land-grab" phase—building networks, securing banking relationships, and achieving compliance country-by-country. They face pressure from both the profitable issuance layer above and distribution platforms below. However, the author suggests this layer is building a crucial moat. Once stablecoins become a default business rail, the infrastructure players who have done the hard work of integration may gain significant, durable value and pricing power.

链捕手5 h fa

The Value Distribution of Stablecoins

链捕手5 h fa

Trading

Spot
Futures

Articoli Popolari

Come comprare JTO

Benvenuto in HTX.com! Abbiamo reso l'acquisto di Jito (JTO) semplice e conveniente. Segui la nostra guida passo passo per intraprendere il tuo viaggio nel mondo delle criptovalute.Step 1: Crea il tuo Account HTXUsa la tua email o numero di telefono per registrarti il tuo account gratuito su HTX. Vivi un'esperienza facile e sblocca tutte le funzionalità,Crea il mio accountStep 2: Vai in Acquista crypto e seleziona il tuo metodo di pagamentoCarta di credito/debito: utilizza la tua Visa o Mastercard per acquistare immediatamente JitoJTO.Bilancio: Usa i fondi dal bilancio del tuo account HTX per fare trading senza problemi.Terze parti: abbiamo aggiunto metodi di pagamento molto utilizzati come Google Pay e Apple Pay per maggiore comodità.P2P: Fai trading direttamente con altri utenti HTX.Over-the-Counter (OTC): Offriamo servizi su misura e tassi di cambio competitivi per i trader.Step 3: Conserva Jito (JTO)Dopo aver acquistato Jito (JTO), conserva nel tuo account HTX. In alternativa, puoi inviare tramite trasferimento blockchain o scambiare per altre criptovalute.Step 4: Scambia Jito (JTO)Scambia facilmente Jito (JTO) nel mercato spot di HTX. Accedi al tuo account, seleziona la tua coppia di trading, esegui le tue operazioni e monitora in tempo reale. Offriamo un'esperienza user-friendly sia per chi ha appena iniziato che per i trader più esperti.

132 Totale visualizzazioniPubblicato il 2024.12.11Aggiornato il 2026.06.02

Come comprare JTO

Discussioni

Benvenuto nella Community HTX. Qui puoi rimanere informato sugli ultimi sviluppi della piattaforma e accedere ad approfondimenti esperti sul mercato. Le opinioni degli utenti sul prezzo di JTO JTO sono presentate come di seguito.

活动图片