Is This The Bitcoin Price Bottom Or A Fakeout? Analyst Reveals When You Shouldn’t Be Excited

bitcoinistPubblicato 2026-03-20Pubblicato ultima volta 2026-03-20

Introduzione

Bitcoin's recent rally above $75,000 has sparked optimism, but analyst Ardi warns this may be a typical bear market fakeout rather than a true bottom. He argues that such breakouts often form lower highs in downtrends, citing five relief rallies during the 2022 bear market that ultimately led to further declines. Ardi emphasizes that bear markets aren't solely tied to four-year cycles but follow structural patterns—typically 3 years of gains followed by 9-12 months of consolidation. For a genuine bullish reversal, Bitcoin must reclaim $85,000 and surpass $96,000 by over 3%. Until then, he considers this bounce insufficient evidence of a sustained upward move, cautioning that short-term strength often precedes more downside in macro bear markets.

The recent Bitcoin price rebound has reignited optimism, but not everyone is convinced the market has turned around. While price has shown signs of a breakout, a crypto analyst notes that BTC’s macro setup still resembles a typical bear market structure. The key question remains whether the recent upside move signals a true price bottom or simply another temporary rally before further downside.

Why The Bitcoin Price Breakout Is Not A Bullish Reversal

In an X post on Tuesday, March 17, crypto analyst Ardi argued that traders are misinterpreting Bitcoin’s recent rally above $75,000 by assuming that any breakout automatically signals the end of a bear market. He explained that these types of price spikes are part of how bear markets typically function.

The analyst noted that breakouts usually form macro lower highs during a downtrend. He emphasized that these price rallies can appear strong at first, but they usually don’t last and tend to set the stage for the next downward move.

Backing this up, Ardi pointed to Bitcoin’s price action in 2018 and 2022 as a clear example. After reaching all-time highs in both years, the market entered a steady decline, creating a series of lower highs. He noted that in both bear market cycles, there were approximately five relief rallies.
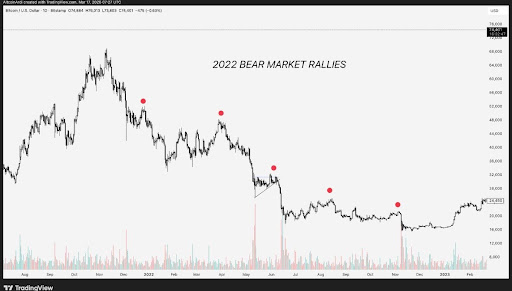
Source: Chart from Ardi on X

Sharing a chart showing Bitcoin’s rebounds during the 2022 bear market, the analyst showed that the cryptocurrency experienced sharp spikes in January, April, June, August, and November. Each of these rebounds had temporarily pushed the price up, but none reversed the overall downtrend. He added that at every bounce, selling pressure returned, driving the market even lower.

Ardi noted that this recent spike is the first bounce Bitcoin has experienced in five months, so its timing is not unexpected. He also highlighted that many traders have already adjusted their outlook, closing bearish positions after just one green run. In his view, this reaction shows a lack of a well-grounded trading thesis.

Analyst Reveals What Actually Confirms A Bottom

When asked about the basis for his bearish outlook, Ardi rejected the idea that Bitcoin’s behavior is only tied to the four-year cycle theory. The analyst said that bear markets are not dependent on this cyclical concept and would exist regardless of the narrative. He emphasized that market structure and time-based patterns carry more weight.

Ardi explained that a typical market includes roughly three years of upward movement, followed by a shorter phase of decline or consolidation. This period generally lasts 9 to 12 months and is characterized by lower volatility and sideways price action. During this period, the market develops the conditions necessary for a longer-term reversal.

The crypto analyst also outlined specific levels that Bitcoin would need to reclaim before he would consider a bottom and a subsequent bullish shift. He noted that the cryptocurrency would have to move above $85,000 and then surpass $96,000 by more than 3% to indicate a genuine change in momentum.

Without meeting at least one of these conditions, he believes the market has not provided enough evidence to support a sustained upward move. Until that happens, Ardi maintains that Bitcoin’s price bounce does not confirm a market bottom. The 2022 bear market chart demonstrates that multiple rallies can occur within a broader downtrend, and that short-term strength alone isn’t enough to signal a lasting price reversal.

BTC trading at $70,128 on the 1D chart | Source: BTCUSDT on Tradingview.com

Crypto di tendenza

Domande pertinenti

QAccording to the analyst Ardi, why is the recent Bitcoin price breakout not necessarily a bullish reversal?

ABecause breakouts that form macro lower highs are a normal part of bear market structure, often appearing strong at first but not lasting and tending to set the stage for the next downward move.

QHow many relief rallies did the analyst note occurred in the 2018 and 2022 Bitcoin bear market cycles?

AApproximately five relief rallies occurred in both the 2018 and 2022 bear market cycles.

QWhat two specific price levels does the analyst say Bitcoin must reclaim to confirm a genuine bottom and bullish shift?

ABitcoin would need to move above $85,000 and then surpass $96,000 by more than 3%.

QWhat does the analyst argue is more important than the four-year cycle theory in determining a bear market?

AMarket structure and time-based patterns carry more weight than the four-year cycle theory.

QWhat is the typical duration and characteristic of the decline/consolidation phase that follows three years of upward movement, according to the analyst?

AThe decline or consolidation phase typically lasts 9 to 12 months and is characterized by lower volatility and sideways price action.

Letture associate

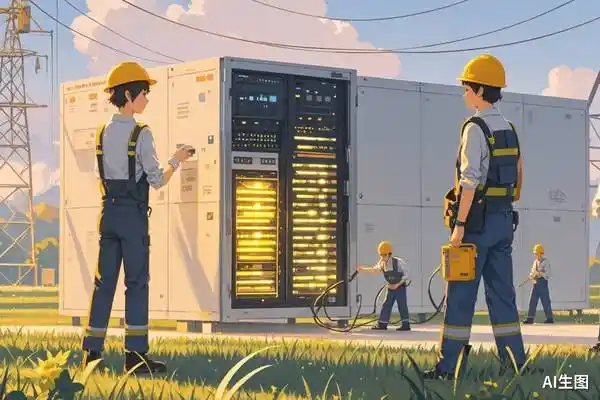
Annual Salary of Millions Competing for Electricians, Meta Rushes to Open Its Own Technical School

The AI boom is facing an unexpected bottleneck: a severe shortage of skilled construction workers and electricians. As tech giants like Meta, OpenAI, and Alphabet race to build massive data centers—such as OpenAI's $16 billion "Stargate" project—they are hitting a critical labor wall. The U.S. needs an estimated 130,000 more electricians, 240,000 construction workers, and 150,000 supervisors by 2030 for AI infrastructure alone, but tens of thousands of electrician jobs go unfilled each year. While AI companies offer high premiums, with electricians earning up to $280,000 annually, worker scarcity still causes massive losses—delays on a single project can cost $14.2 million per month. The complexity of building AI data centers, which require immense power (equivalent to powering hundreds of thousands of homes), sophisticated electrical systems, and advanced liquid cooling solutions, demands highly skilled technicians who are in short supply. To combat this, companies are investing heavily in training. Meta has committed $115 million to a free training school offering tuition, housing, and stipends, targeting 5,000 new workers. OpenAI is partnering with unions to secure skilled labor. These efforts are paying off, with a significant rise in Gen Z interest in trade schools over college. However, the power demands are staggering. AI data centers are driving a rapid surge in electricity consumption, projected to account for up to 12% of U.S. power use by 2028 and raising costs for consumers. Furthermore, the construction boom is project-based, leading to a potential future glut of trained workers once building peaks, which could depress wages industry-wide. The race for AI supremacy now depends as much on skilled hands as on advanced chips.

marsbit1 h fa

Annual Salary of Millions Competing for Electricians, Meta Rushes to Open Its Own Technical School

marsbit1 h fa

OpenAI No Longer Sells Its Most Expensive Model for Profit

OpenAI is shifting its business strategy away from promoting its most expensive, flagship models for every task. Recent price cuts—80% for GPT-5.6 Luna and 20% for Terra—signal a deeper change: the company now actively advises users that many tasks don't require the most powerful model. Instead, OpenAI recommends a tiered approach: use the high-end GPT-5.6 Sol for complex planning and analysis, then delegate execution to cheaper models like Luna. This mirrors moves by Anthropic, which recently launched Claude Opus 5 at half the price of its top model, Fable 5. Both companies are de-emphasizing flagship models as primary revenue drivers, using them instead for brand prestige and technological showcases. The industry is entering a "mass-market" phase, similar to automotive, where high-volume, cost-effective models handle daily operations and drive scale. OpenAI's price reductions are partly enabled by AI models themselves optimizing underlying code and infrastructure, creating a self-reinforcing cycle of efficiency gains and cost reduction. Competition is shifting from "who is smartest" to "who offers the best value." The goal is no longer selling individual models but fostering widespread API adoption and ecosystem lock-in. By making AI calls cheap and ubiquitous, companies like OpenAI aim to become the indispensable, utility-like infrastructure powering automated workflows—the "water and electricity" of software, quietly embedded everywhere.

marsbit1 h fa

OpenAI No Longer Sells Its Most Expensive Model for Profit

marsbit1 h fa

Trading

Spot

Articoli Popolari

Come comprare T

Benvenuto in HTX.com! Abbiamo reso l'acquisto di Threshold Network Token (T) semplice e conveniente. Segui la nostra guida passo passo per intraprendere il tuo viaggio nel mondo delle criptovalute.Step 1: Crea il tuo Account HTXUsa la tua email o numero di telefono per registrarti il tuo account gratuito su HTX. Vivi un'esperienza facile e sblocca tutte le funzionalità,Crea il mio accountStep 2: Vai in Acquista crypto e seleziona il tuo metodo di pagamentoCarta di credito/debito: utilizza la tua Visa o Mastercard per acquistare immediatamente Threshold Network TokenT.Bilancio: Usa i fondi dal bilancio del tuo account HTX per fare trading senza problemi.Terze parti: abbiamo aggiunto metodi di pagamento molto utilizzati come Google Pay e Apple Pay per maggiore comodità.P2P: Fai trading direttamente con altri utenti HTX.Over-the-Counter (OTC): Offriamo servizi su misura e tassi di cambio competitivi per i trader.Step 3: Conserva Threshold Network Token (T)Dopo aver acquistato Threshold Network Token (T), conserva nel tuo account HTX. In alternativa, puoi inviare tramite trasferimento blockchain o scambiare per altre criptovalute.Step 4: Scambia Threshold Network Token (T)Scambia facilmente Threshold Network Token (T) nel mercato spot di HTX. Accedi al tuo account, seleziona la tua coppia di trading, esegui le tue operazioni e monitora in tempo reale. Offriamo un'esperienza user-friendly sia per chi ha appena iniziato che per i trader più esperti.

500 Totale visualizzazioniPubblicato il 2024.12.10Aggiornato il 2026.06.02

Come comprare T

Discussioni

Benvenuto nella Community HTX. Qui puoi rimanere informato sugli ultimi sviluppi della piattaforma e accedere ad approfondimenti esperti sul mercato. Le opinioni degli utenti sul prezzo di T T sono presentate come di seguito.

活动图片