Introducing: Global Metrics Suite

insights.glassnodePubblicato 2026-05-28Pubblicato ultima volta 2026-05-28

Introduzione

Glassnode introduces the Global Metrics Suite, a new framework for analyzing the fragmented cryptocurrency market through aggregated on-chain and market data. It solves the challenge of structural discontinuities in traditional aggregate series by using formally rebalanced baskets (e.g., by market cap) and provides two output types: Raw Aggregates (preserving original units) and Indices (scaled, continuous series for trend comparison). The article demonstrates the value of continuity-adjusted indices through three examples. First, they reveal a significant 2024 surge in small-cap market cap, a rally invisible in raw data where "winners" leave the basket upon crossing a threshold. Second, a global Spent Output Profit Ratio (SOPR) index shows that small-cap sentiment is more stable than raw data suggests, while larger caps exhibit a trend of decreasing profit realization per cycle. Third, an Open Interest index highlights the higher volatility and leverage spikes in mid- and small-cap derivatives, useful for monitoring cascade risks. Four metrics are currently available via API: Total Market Cap, Realized Cap, Median SOPR, and Total Open Interest, each for "All Coins," Large, Mid, and Small Cap baskets. The framework, using weekly rebalancing and equal weighting, brings the continuity discipline of traditional finance indices to multi-asset crypto analytics.

Aggregate market analysis has become a challenge since the digital asset space has fragmented into thousands of assets, sectors, and rapidly changing market-cap cohorts. As assets appreciate, decline, launch, or disappear, aggregate metric series develop structural discontinuities that make long-term analysis difficult.

Previously, we showcased the power of global views that aggregate metrics across the market using our Multi-Asset Explorer. We have now extended this framework with Glassnode Global Metrics — a suite of formally rebalanced aggregate metrics with continuous index normalization, available via API.

In this article, we introduce the framework, examine several examples across market capitalization, profitability, and derivatives positioning, and show what continuity-adjusted indices reveal relative to raw aggregates.

What are Glassnode Global Metrics?

Global Metrics are aggregated on-chain and market metrics computed across multiple cryptocurrencies, organized into configurable baskets. Baskets can be defined by market capitalization thresholds, top-N rankings (by any metric), or asset tags (sectors, categories). They solve a fundamental challenge in crypto analytics: how to track on-chain and market metrics across a highly dynamic group of assets over time without artificial discontinuities caused by basket composition changes, in contrast to indices that focus on price alone.

We provide two output types for each metric:

  • Raw Aggregates: True values in original units preserving economic meaning (e.g., USD for market cap, counts for active addresses)
  • Indices: Scaling-factor-adjusted, base-normalized time series for trend analysis and cross-basket comparison

What the indices reveal

Market structure: the 2024 small-cap surge

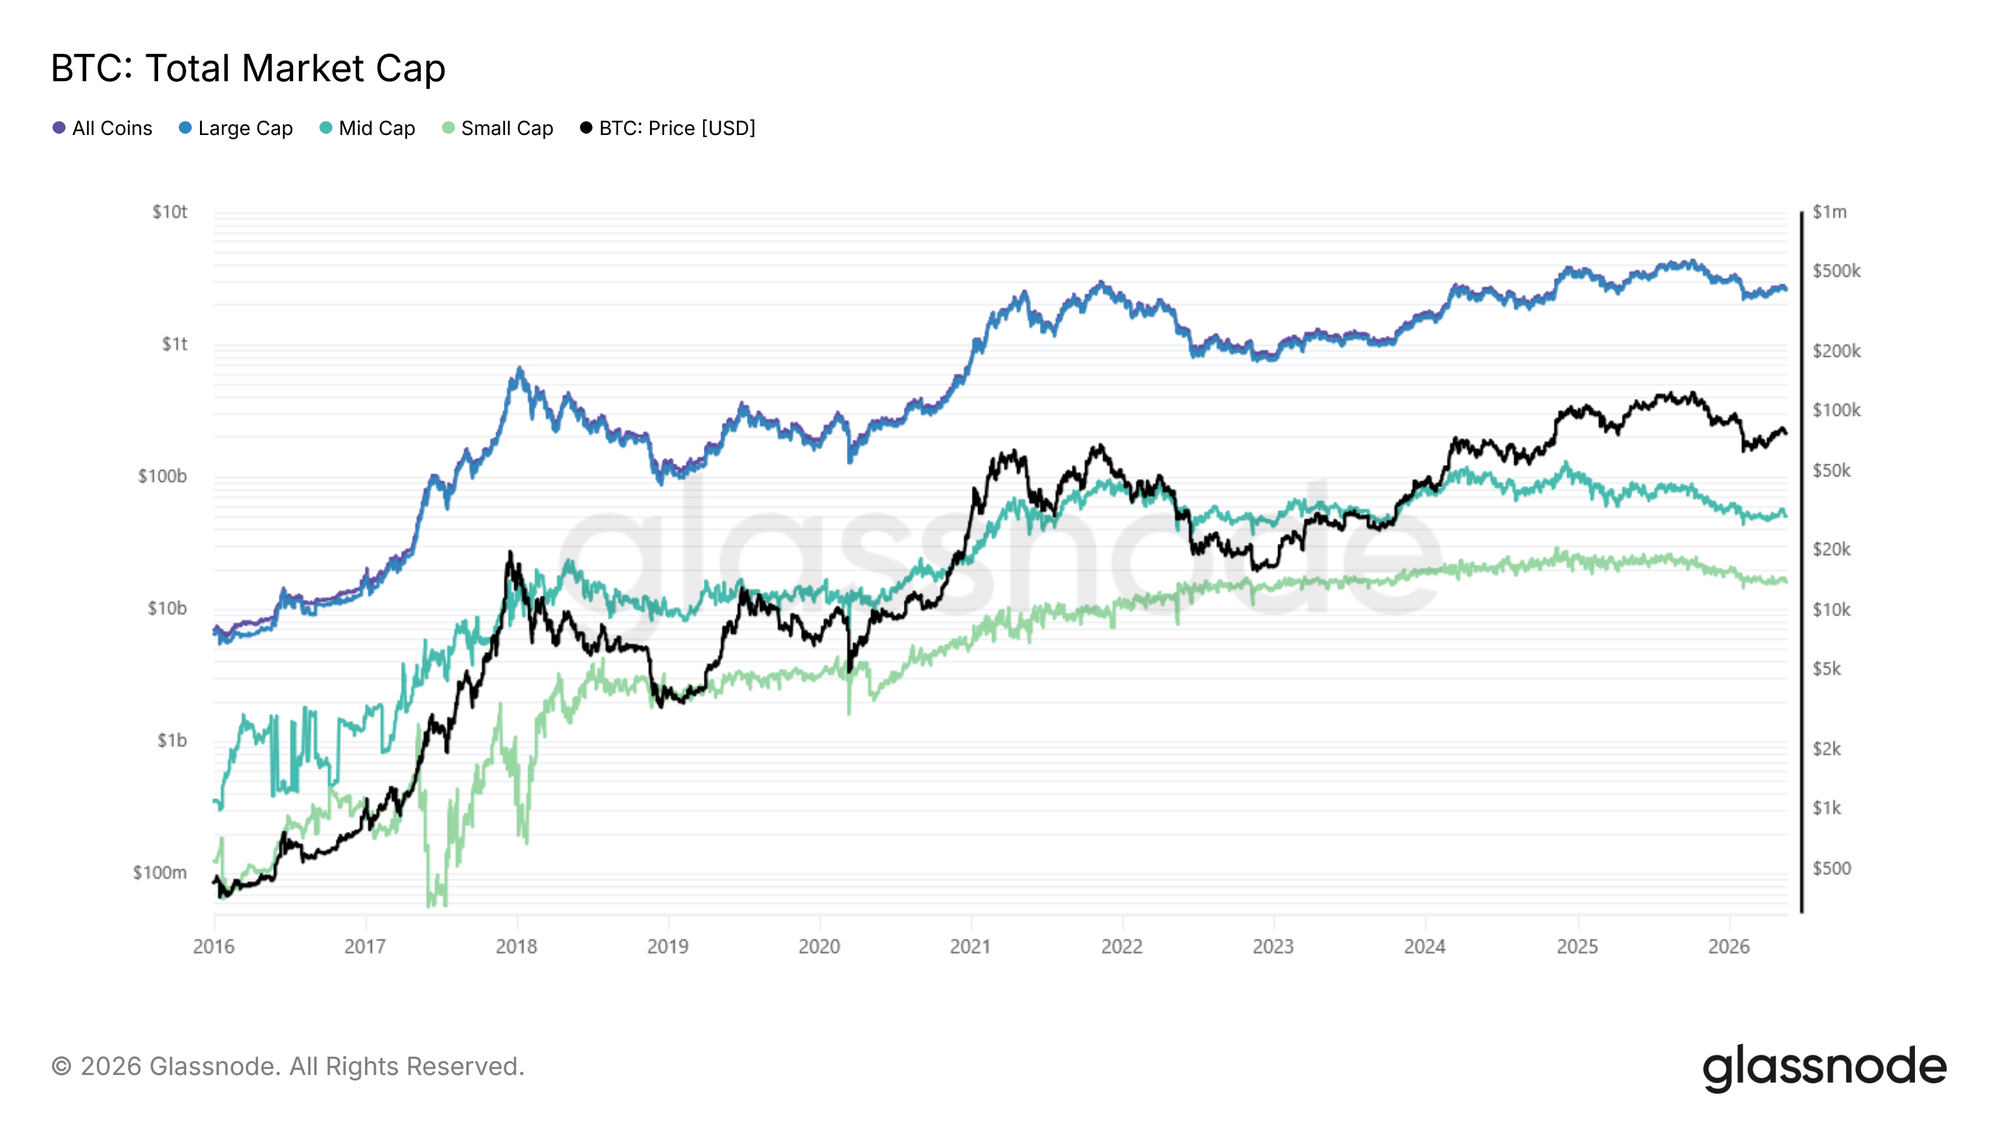
The clearest demonstration of why continuity-adjusted indices matter is the small-cap tier in 2024. The below figure presents Total market cap: Raw aggregate (USD, log scale) across all four baskets: All Coins, Large, Mid and Small Cap, with BTC price overlaid.
View Live Metric

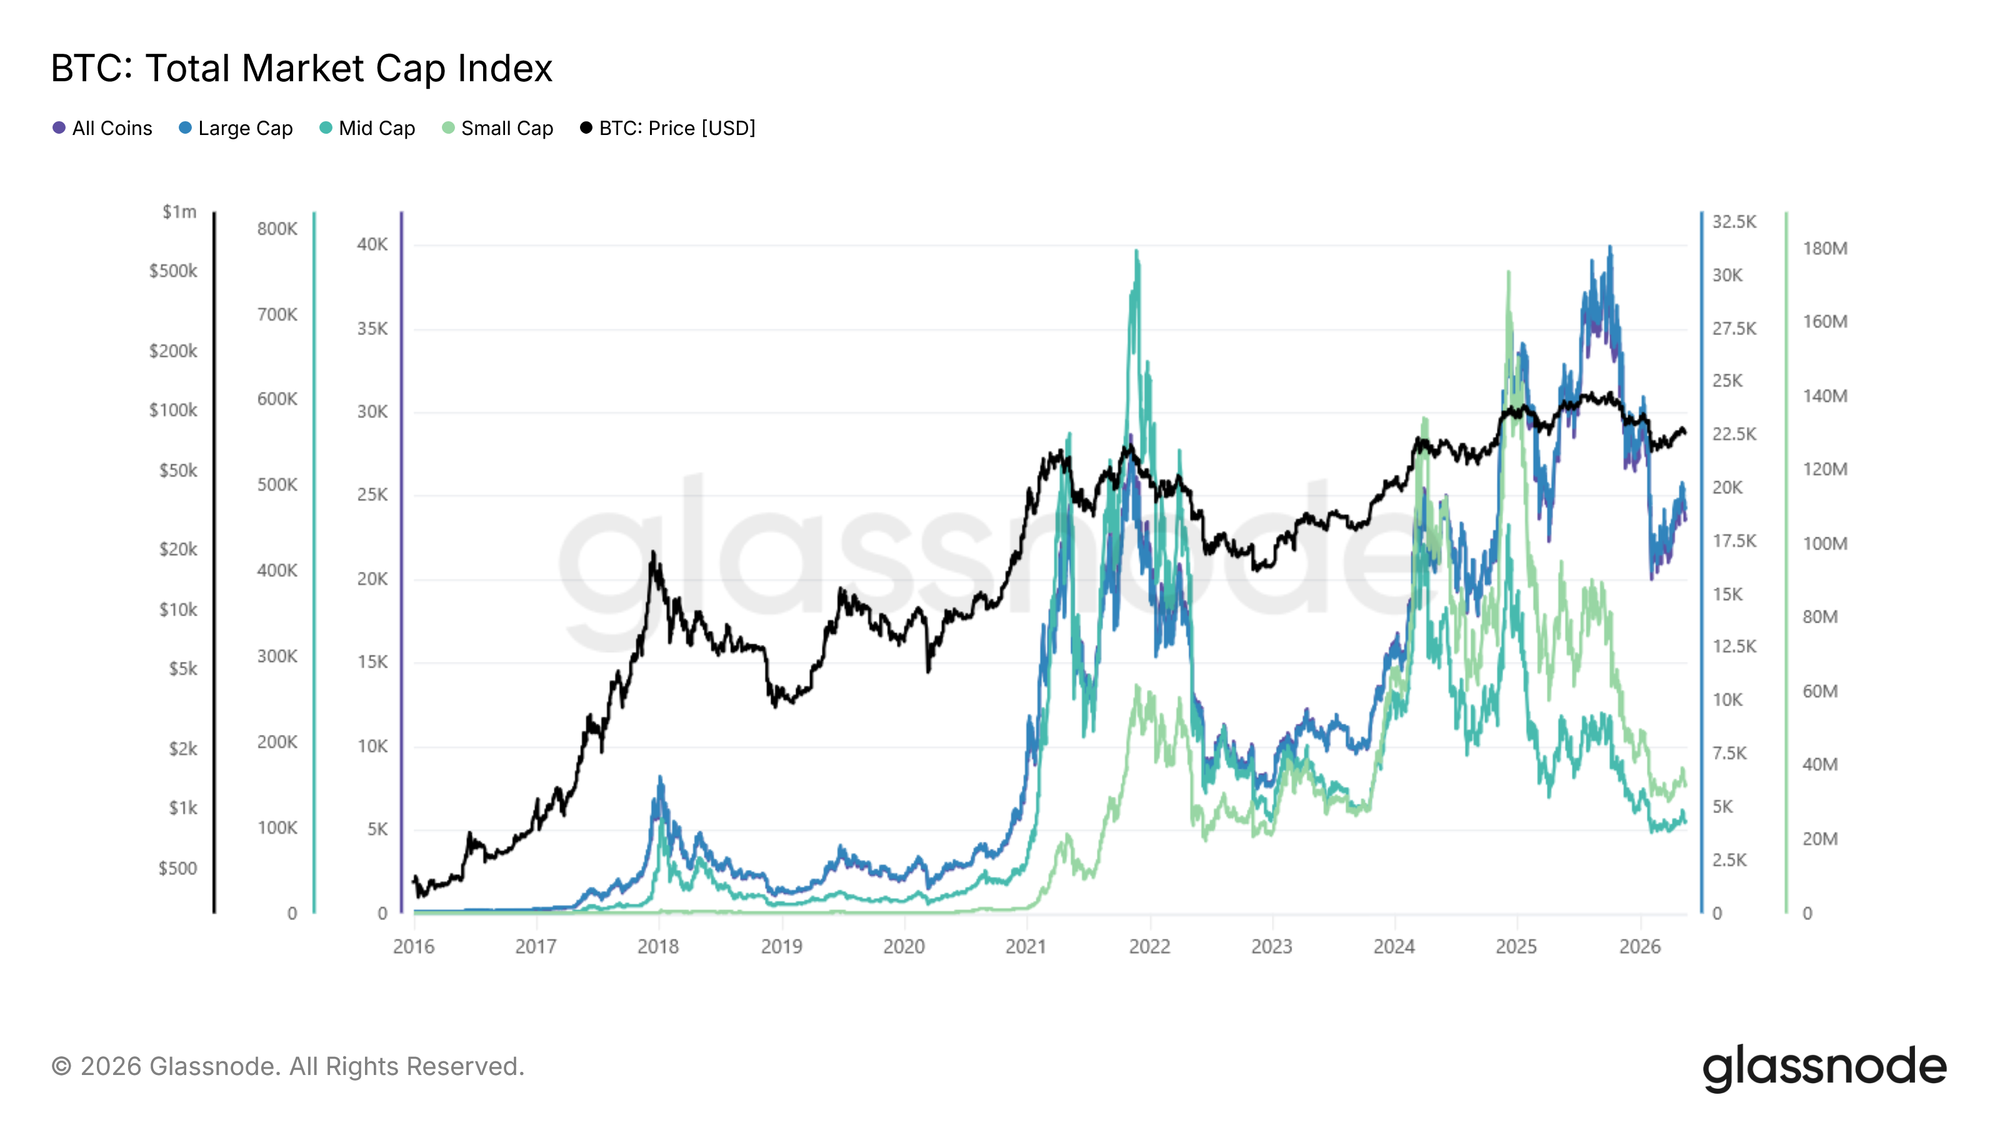
Compare to the Total market cap index across all four baskets: Scaled index (base 100), same baskets. Each tier starts at 100, hence the lines are directly comparable as growth multiples.
View Live Metric

The raw small-cap series contains a structural bias: whenever a small-cap asset performs well, it eventually crosses the $100M threshold and leaves the basket, taking its gains with it. In other words, "winners leave". The raw aggregate is, by design, incapable of capturing a small-cap rally.

The index neutralizes this effect. Small-cap shot up dramatically in 2024, a move largely invisible in the raw series, driven by near-instant token creation platforms and the memecoin mania that followed.

The same chart also highlights the divergence across tiers: while large caps held up relatively well, altcoin tiers entered a prolonged drawdown. Both halves only become legible in the index.

Profit-taking Sentiment: Altcoin SOPR vs BTC SOPR

Spent Output Profit Ratio (SOPR), which measures whether coins moving on-chain are being spent at a profit (above 1) or a loss (below 1), is one of the clearest cases where a global metric adds value beyond the single-asset version. BTC SOPR and the median SOPR across altcoin baskets frequently diverge, and the spread between them becomes a signal in itself.

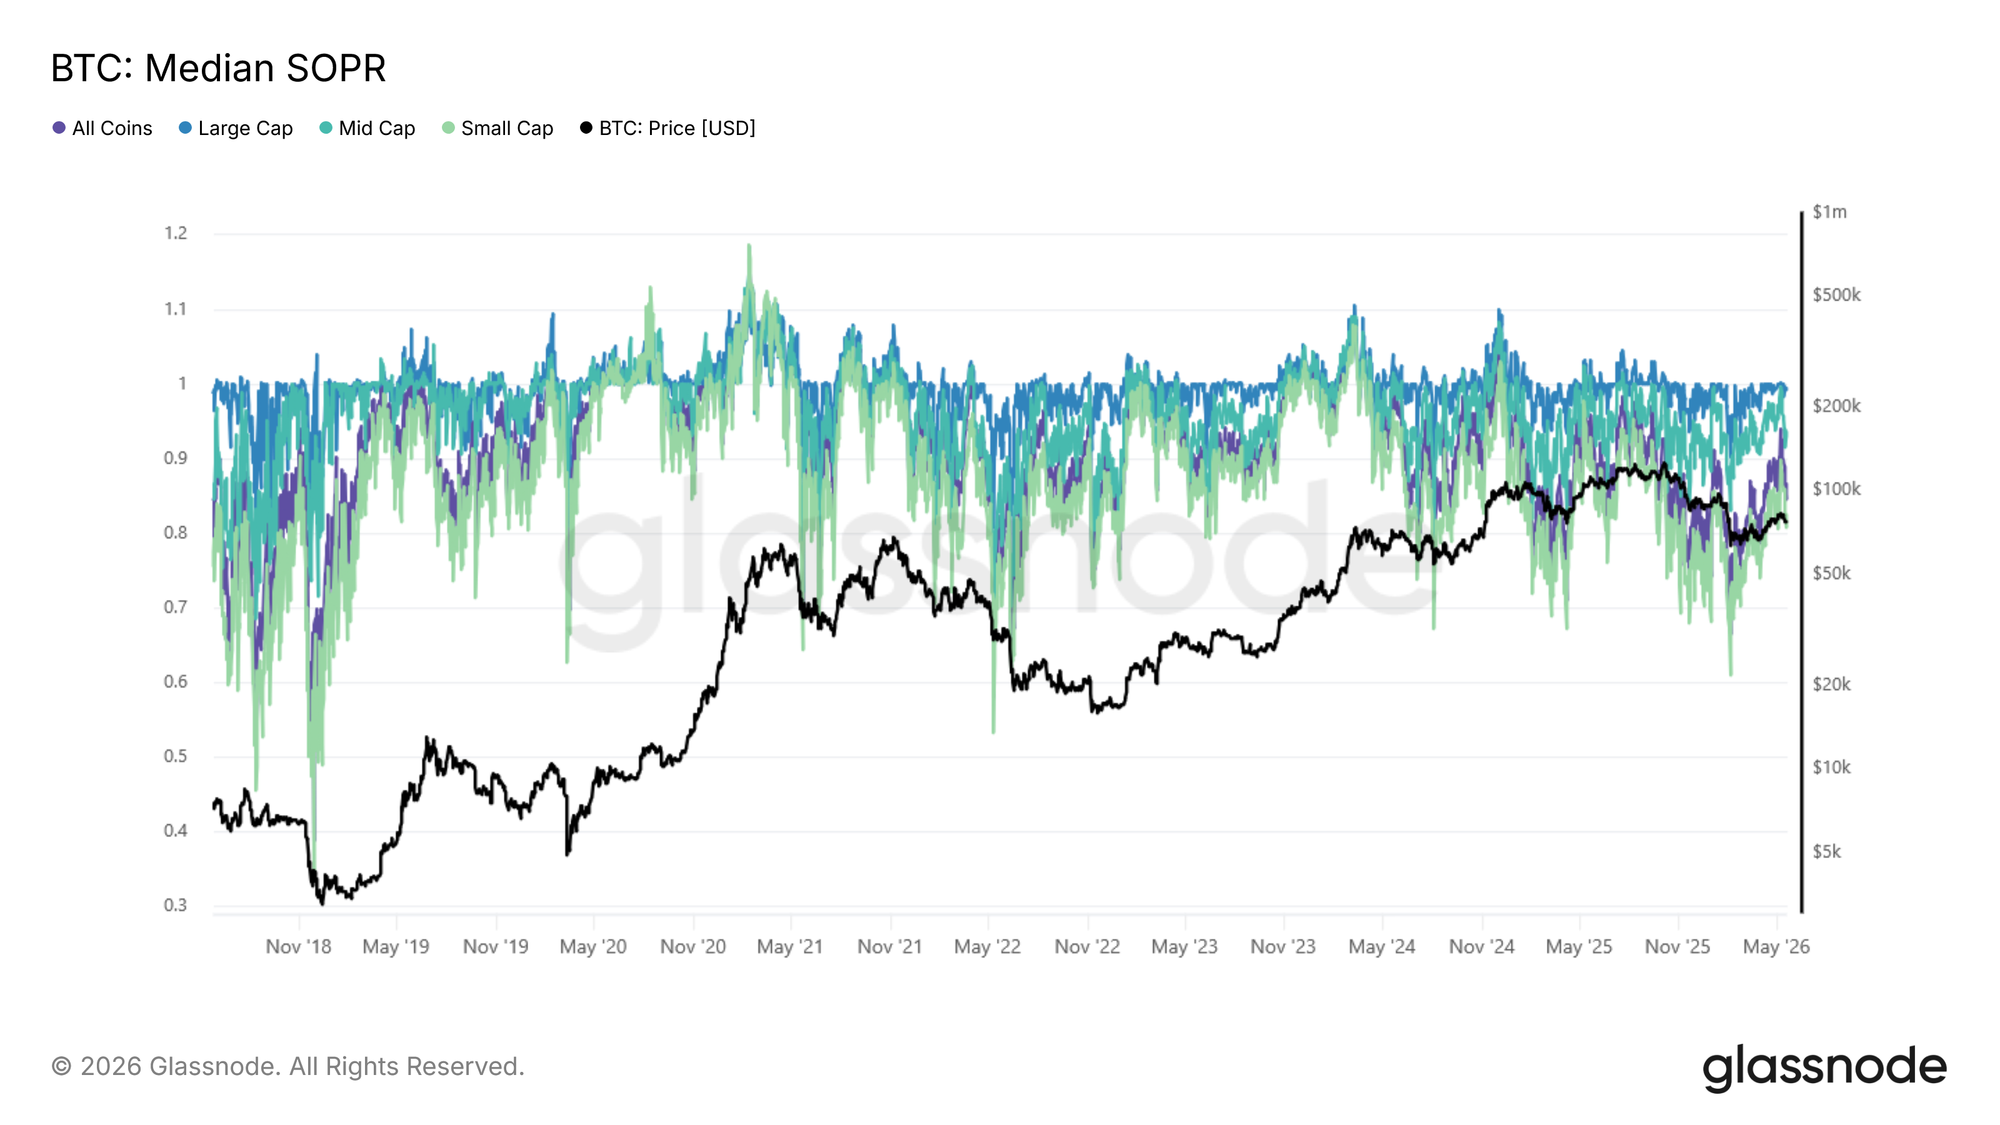
The following figure shows Median SOPR: Raw aggregate across all four baskets, BTC price overlaid. SOPR oscillates around 1.
View Live Metric

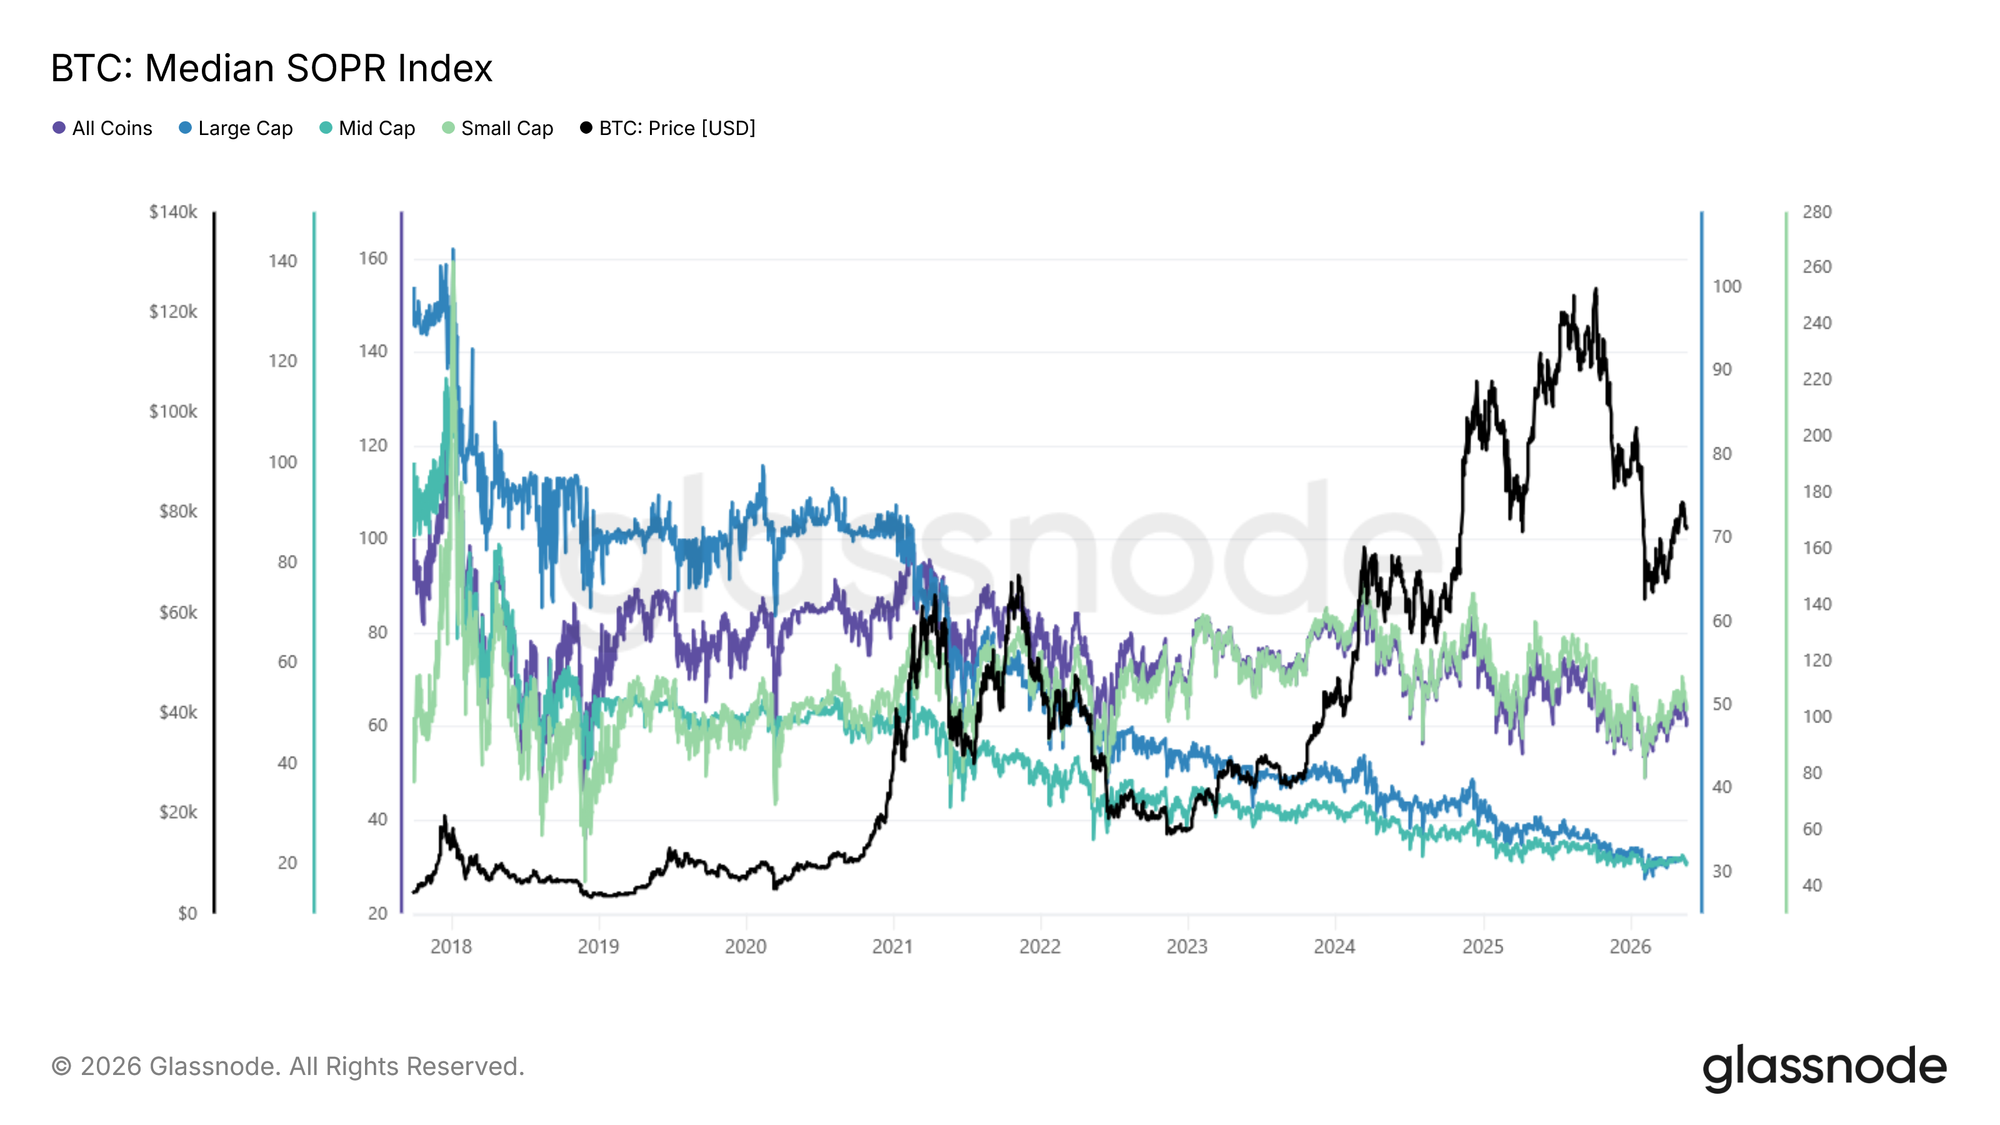
Compare to the Median SOPR: Scaled index (base 100), across the same four baskets.
View Live Metric

The raw series tells the following story: small-cap SOPR crashes to levels comparable to the 2018 and 2022 bear markets, while large and mid caps have held up better in recent cycles. The index adds an additional nuance: because appreciated small-cap coins keep leaving the basket as they grow into higher tiers, the raw series overstates how bad sentiment is for the assets that actually remain.

The raw series tells the following story: small-cap SOPR crashes to levels comparable to the 2018 and 2022 bear markets, while large and mid caps have held up better in recent cycles. The index adds an additional nuance: Because appreciated small-cap coins keep leaving the basket as they grow into higher tiers, the raw series overstates how bad sentiment is for the assets that actually remain.

Adjusted for this, small-cap sentiment is more stable than it appears. For large and mid caps no such correction applies, and what the index reveals is a genuine long-term trend: each cycle, the average holder in established assets extracts slightly less profit than the one before. As more supply locks into long-term holding, less of it cycles through at a profit.

Rather than relying on selected tokens as proxies for altcoin sentiment, the global SOPR index provides a cohort-level read directly. No need to cherry-pick individual tokens.

Derivatives Positioning: Open Interest

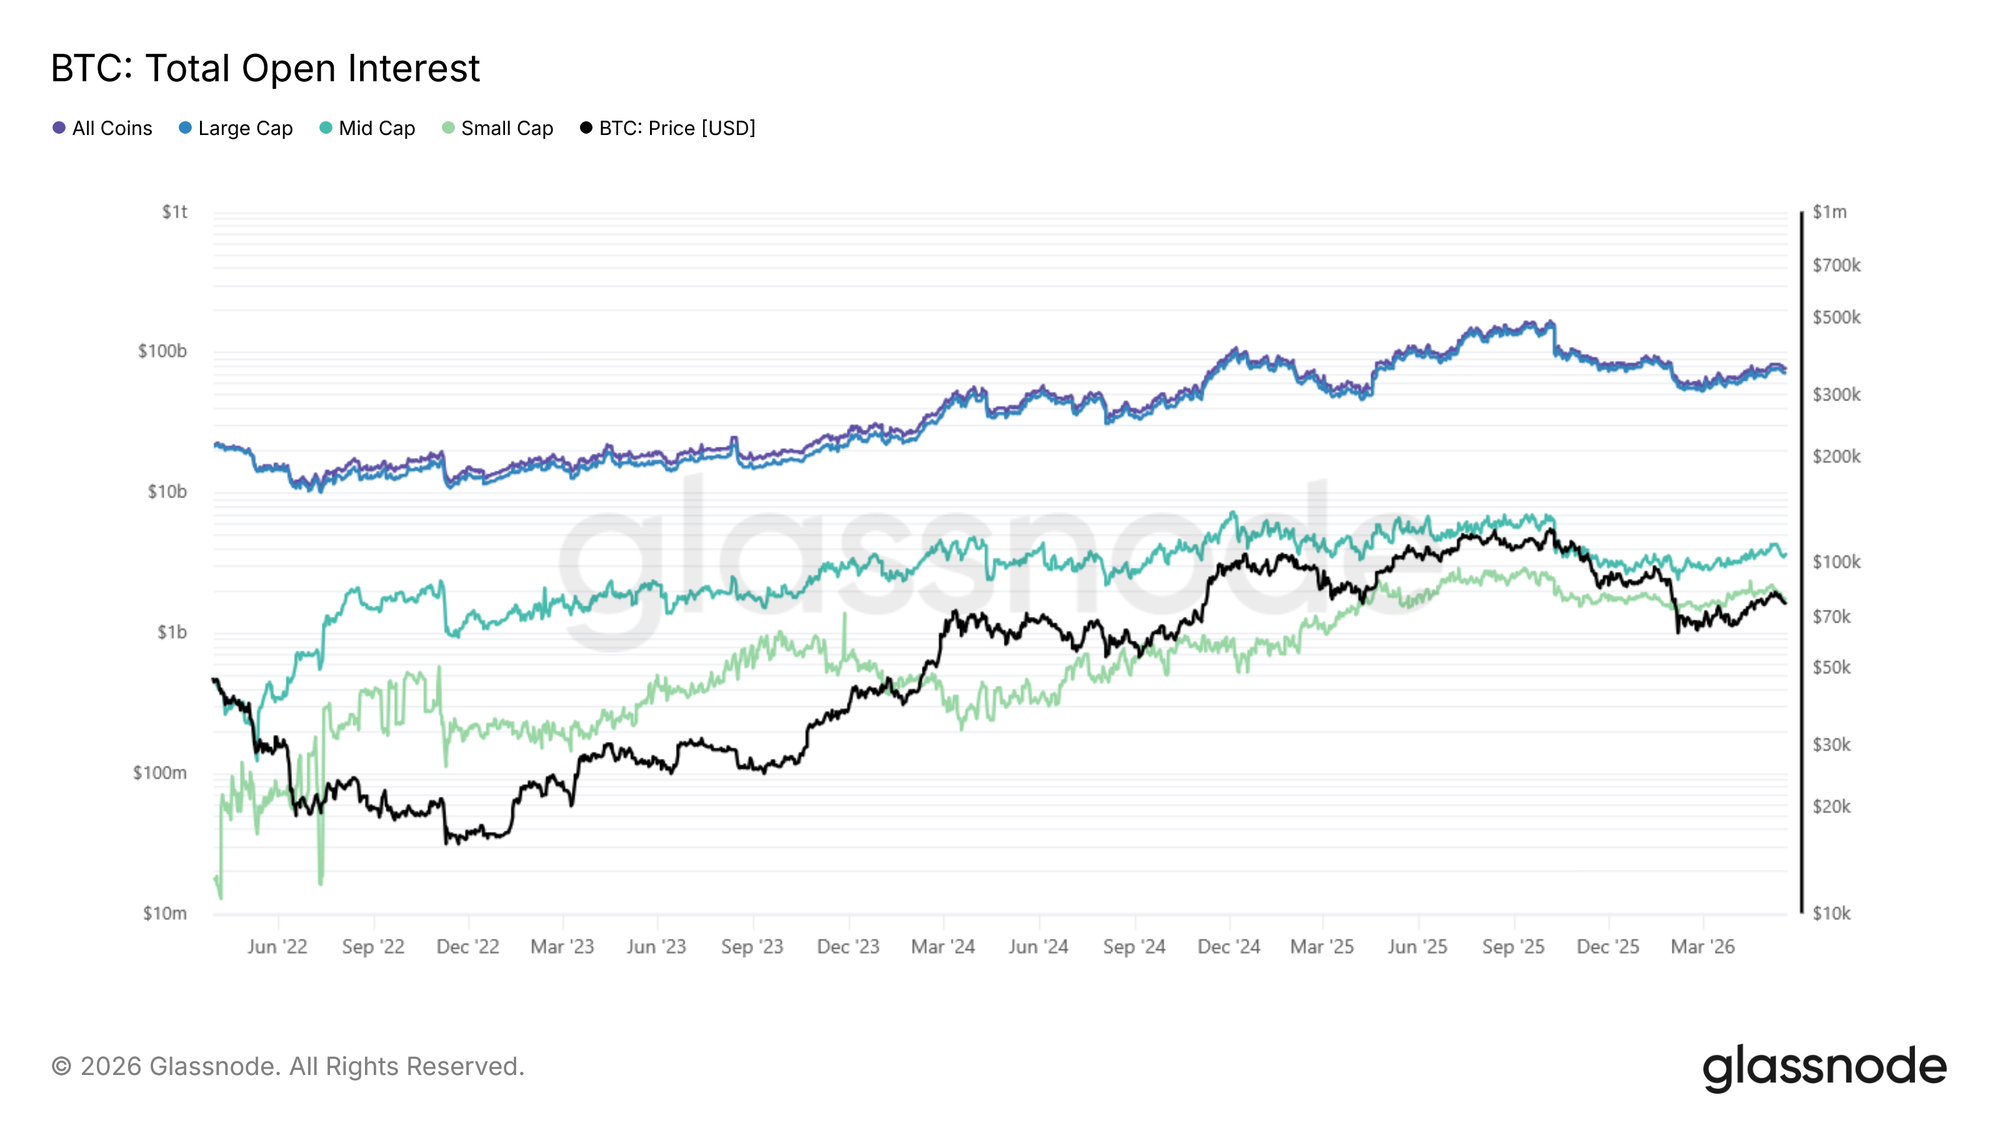
Open Interest (OI) measures the total value of outstanding perpetual futures contracts and provides a useful proxy for leverage concentration across the market.

The below figure presents Total Open Interest: Raw aggregate (USD, log scale) across all four baskets, data from 2022.
View Live Metric

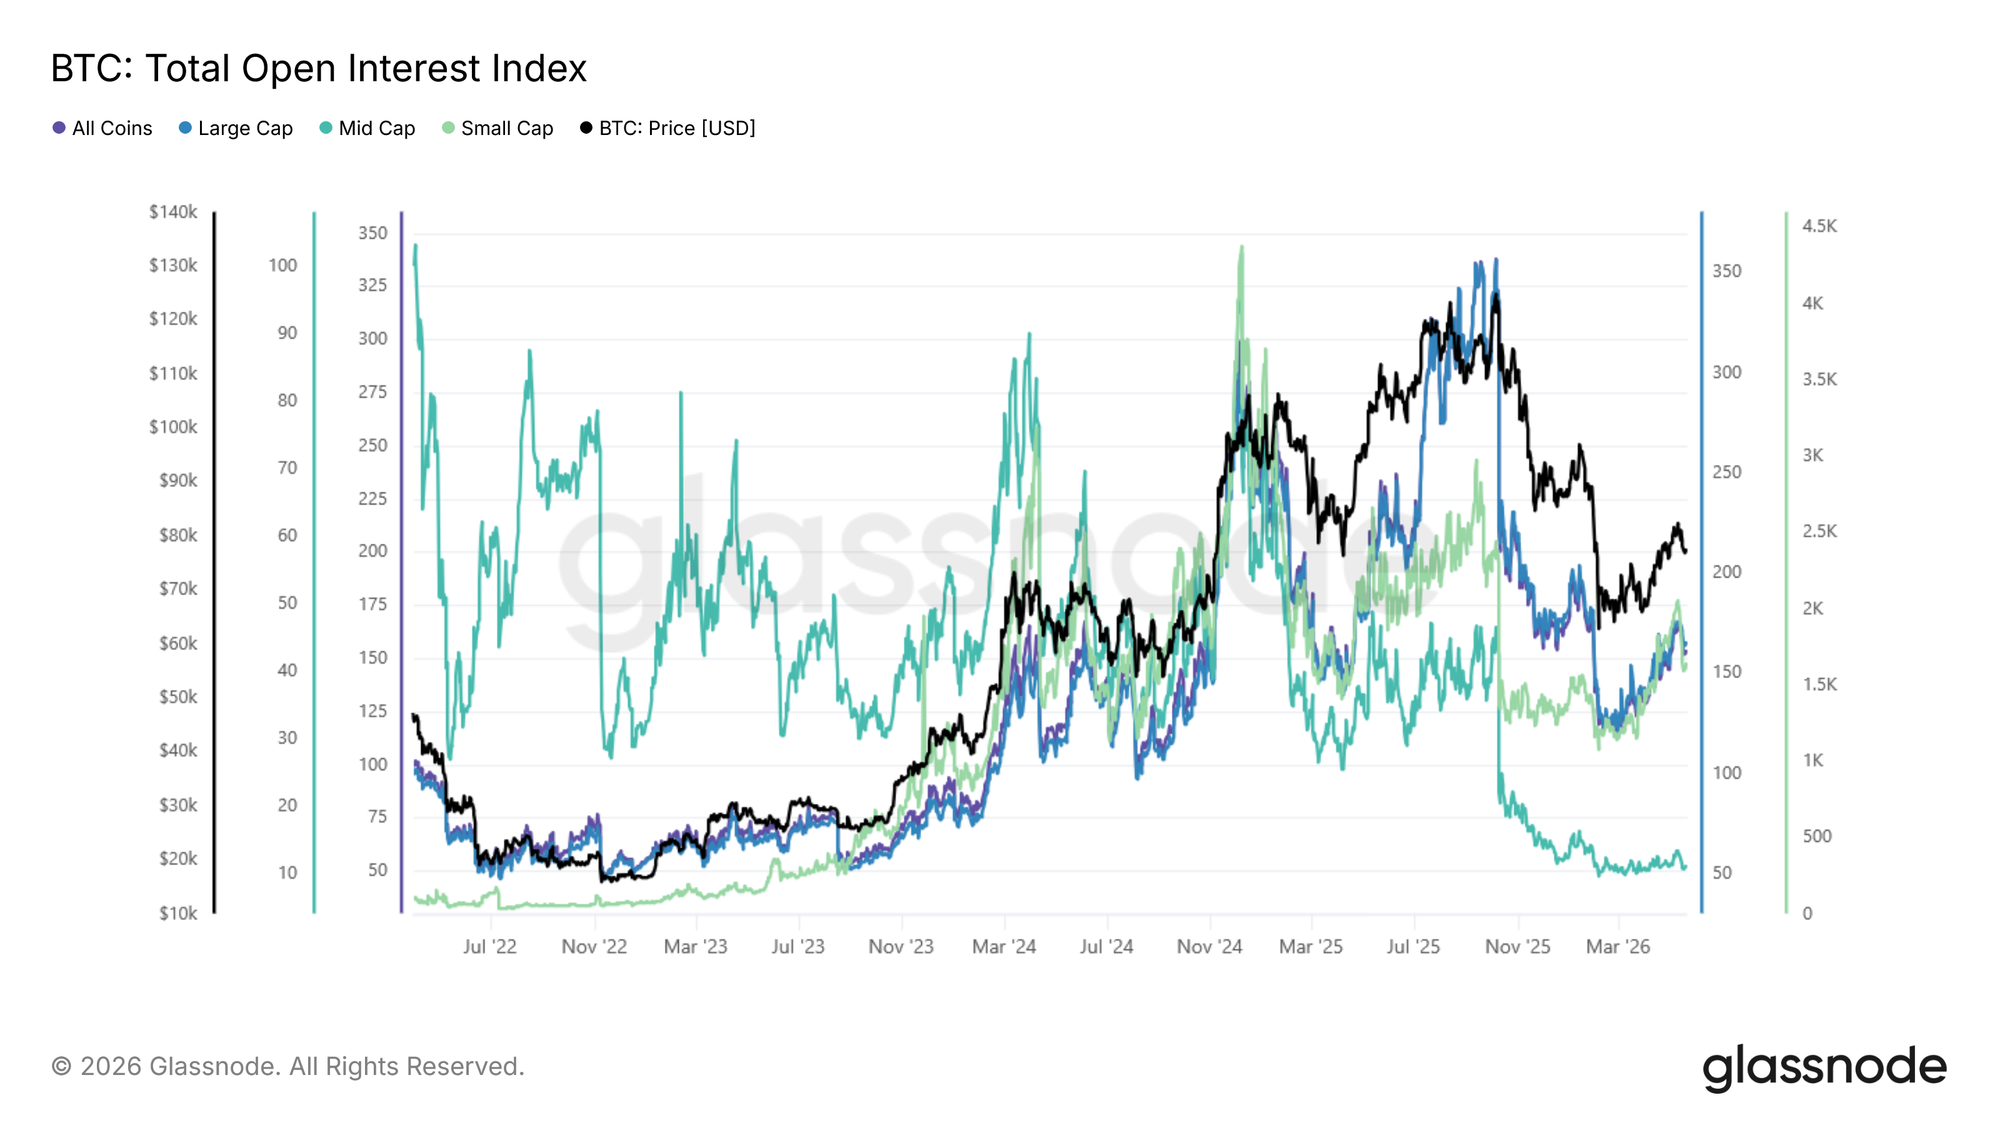
Compare that to the Total Open Interest Index: scaled (base 100) across the same four baskets.
View Live Metric

Large cap dominates open interest in absolute terms; most leverage sits on the biggest, most liquid assets. The index, however, makes the behavior of the smaller tiers comparable: mid- and small-cap open interest is far more volatile, spiking sharply during speculative episodes and unwinding just as fast. These spikes are a useful early-warning signal for cascade risk in the more fragile parts of the market.

The continuity-adjusted framework makes these shifts easier to isolate by separating changes in leverage behavior from changes in cohort composition.

The Glassnode Global Metric Suite

Four metrics are live with this release, each computed for all four baskets, sixteen time series in total. All use weekly rebalancing and equal weighting.
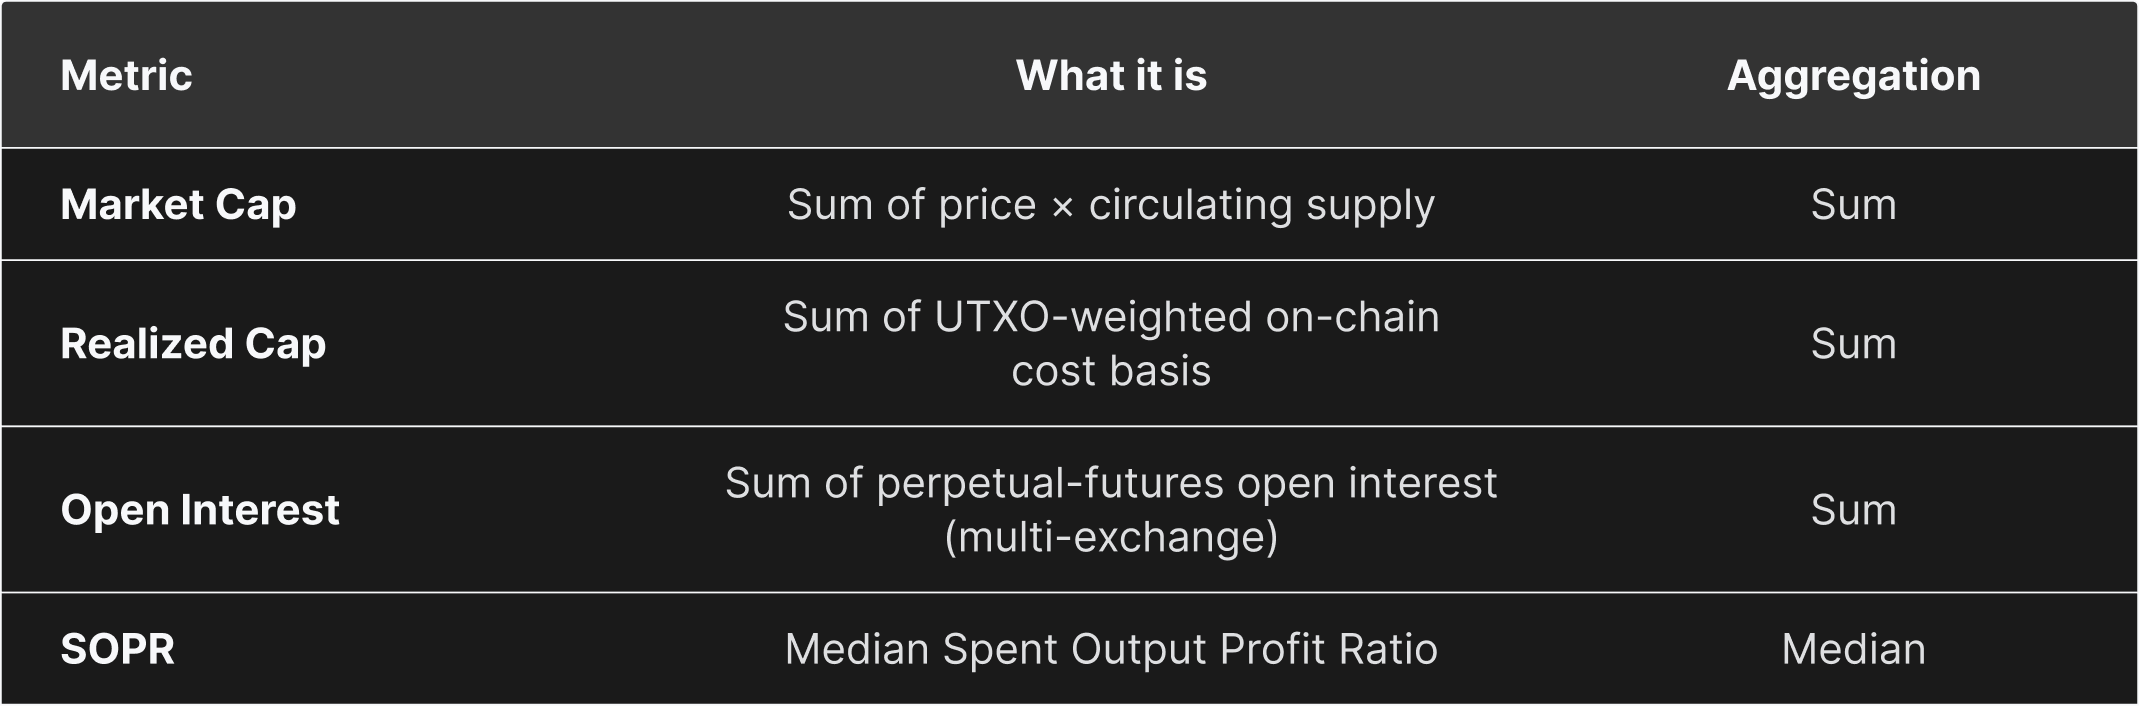
The baskets are the market-cap tiers used throughout this paper:

  • All Coins (no filter)
  • Large Cap (≥$1B)
  • Mid Cap ($100M–$1B)
  • Small Cap (<$100M).

Eligibility filtering, start dates, and the choice of sum versus median aggregation are covered in the appendix.

Accessing the Data via API

Each metric is published in two forms. 1) The raw aggregate preserves the original units (discontinuous at rebalances) and is intended to use for absolute sizing and point-in-time snapshots. 2) The index is scaled, base-100, and continuous, making it more suitable for trend analysis and cross-basket comparison.

Raw and index versions are served from separate endpoints, and each endpoint returns all baskets for that metric:

https://api.glassnode.com/v1/metrics/global/{metric}_{aggregation}_{rebalancing}_{weighting}_raw
https://api.glassnode.com/v1/metrics/global/{metric}_{aggregation}_{rebalancing}_{weighting}_index
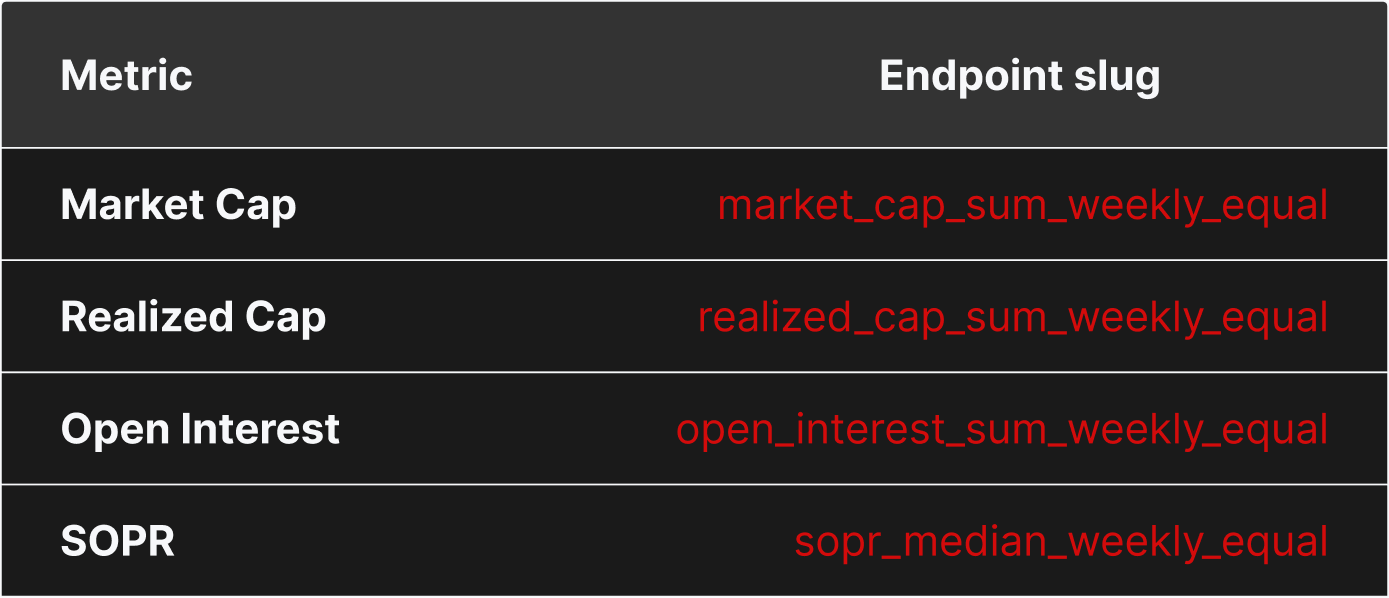
For full request details, please see the Glassnode API documentation. The framework is extensible (additional metrics, alternative weightings, and tag-based sector baskets are planned), but the four metrics above are live today, and they already bring the continuity discipline of traditional price indices to on-chain and market data for a market that is increasingly multi-asset.

Methodology

Full details on basket selection, eligibility filtering, scaling-factor formulas, and index normalization, please reach out to your account manager for access.


  • Follow us on X for timely market updates and analysis
  • Join our Telegram channel for regular market insights
  • For on-chain metrics, dashboards, and alerts, visit Glassnode Studio

Disclaimer: This report is for informational and educational purposes only. The analysis represents a limited case study with significant constraints and should not be interpreted as investment advice or definitive trading signals. Past performance patterns do not guarantee future results. Always conduct thorough due diligence and consider multiple factors before making investment decisions.


Domande pertinenti

QWhat is the core problem in aggregate market analysis of digital assets that the Glassnode Global Metrics Suite aims to solve?

AThe core problem is the structural discontinuities in aggregate metric series caused by the dynamic nature of the crypto market, where assets frequently appreciate, decline, launch, or disappear. This makes long-term trend analysis difficult when using simple raw aggregates.

QWhat are the two types of outputs provided for each Glassnode Global Metric?

AGlassnode provides two output types: 1) Raw Aggregates, which are true values in original units (e.g., USD, counts) that preserve economic meaning but can be discontinuous. 2) Indices, which are scaling-factor-adjusted, base-normalized time series designed for continuous trend analysis and cross-basket comparison.

QUsing the 2024 small-cap surge as an example, why does the 'raw aggregate' of total market cap fail to capture the rally, and how does the 'index' correct for this?

AThe raw aggregate fails because it has a 'winners leave' structural bias. When a small-cap asset performs well and crosses the $100M market cap threshold, it leaves the small-cap basket, taking its gains with it. The index neutralizes this effect by applying continuity adjustments, allowing it to reveal the dramatic 2024 small-cap surge driven by token creation platforms and memecoin mania, which was largely invisible in the raw series.

QHow does the Global SOPR (Spent Output Profit Ratio) index provide a more nuanced view of profit-taking sentiment, particularly for the small-cap cohort, compared to the raw series?

AThe raw SOPR series overstates negative sentiment for small-cap assets because appreciated coins leave the basket as they grow, making the remaining basket appear worse. The index corrects for this composition change, revealing that small-cap sentiment is more stable than it appears. For large/mid caps, the index shows a genuine long-term trend of decreasing average profit realization per cycle as more supply is held long-term.

QAccording to the article, what key insight does the Open Interest Index reveal about leverage behavior in different market-cap tiers that the raw aggregate obscures?

AWhile the raw aggregate shows large caps dominate Open Interest in absolute value, the index makes the behavior of smaller tiers comparable. It reveals that mid- and small-cap open interest is far more volatile, with sharp spikes during speculative episodes and rapid unwinds. These volatility spikes act as an early-warning signal for cascade risk in more fragile market segments, a insight obscured by composition changes in the raw data.

Letture associate

Must-Watch Events Next Week|CLARITY Act Could Face Senate Vote; SpaceX, Circle to Report Earnings (8.3-8.9)

**Summary: Key Events and Developments to Watch (August 3-9)** The upcoming week is marked by significant financial disclosures, key legislative deadlines, and notable product updates. **Major Financial Events:** Several companies are scheduled to release their Q2 2026 earnings. American Bitcoin (ABTC) will report on August 3, followed by SpaceX and Hut 8 Mining Corp. on August 4, and Circle on August 5. Notably, a significant portion of SpaceX shares (up to 12% of total shares) will be unlocked on August 6 following their earnings release. **Key Legislative Deadline:** The U.S. Senate faces an August 7 deadline to secure 60 votes for the CLARITY Act, a bipartisan bill aiming to establish a federal regulatory framework for cryptocurrencies. The Senate may hold a full vote on the bill during the week. **Economic Data:** The U.S. July Non-Farm Payrolls report will be released on August 7, providing crucial labor market data. **Technology & Product Updates:** * **Shutdowns:** DeFi portfolio tracker Zapper and wallet app Ctrl Wallet will cease operations on August 3. * **Upgrades:** LayerZero will deprecate its v1 relayers on August 3. XRP Ledger's new version 3.3.0, featuring five new functions, is expected next week. * **AI:** Elon Musk announced that the advanced Grok 4.6 AI model is set for release around August 7. * **Bitcoin:** The BIP-110 forced signaling for a potential Bitcoin network change is scheduled to begin around August 8. **Other Notable Events:** Chinese robotics firm Unitree Tech has set its preliminary price inquiry for its IPO for August 5. South Korean exchange Upbit will delist AQT and AERGO tokens on August 3.

marsbit18 min fa

Must-Watch Events Next Week|CLARITY Act Could Face Senate Vote; SpaceX, Circle to Report Earnings (8.3-8.9)

marsbit18 min fa

Stocks Are Plummeting More Sharply Than Cryptocurrencies. Where Has the Money Gone?

Stock Markets Plunge Deeper Than Cryptocurrencies: Where Did the Money Go? In late July, Seoul's Kospi index triggered circuit breakers for two consecutive days, plummeting over 40% from its June high. The collapse was led by heavyweight stocks like SK Hynix, whose record profits still disappointed investors, and devastating leveraged ETFs, with one major product losing over 83% of its value. This signaled a global, forced deleveraging targeting the most crowded trades. Interestingly, while stocks exhibited extreme volatility akin to crypto markets, Bitcoin rose nearly 15% in July after a prior steep drop. Analysis shows the money fleeing equities did not flow into Bitcoin. Instead, Bitcoin had already absorbed its sell-off in May-June, when U.S. spot Bitcoin ETFs saw historic outflows. The true safe-haven beneficiary was gold, whose price rose over 20% year-on-year, highlighting a decoupling between Bitcoin and gold as "digital gold." The sell-off was a targeted unwinding of leveraged positions in tech and semiconductors, accelerated by broker-dealer risk management and shifts in the AI narrative, including new competition from Chinese memory chipmakers. The retreat path was clear: from high-valuation tech stocks to cash and U.S. Treasuries, then to gold. For Bitcoin to attract sustained institutional inflows, conditions like eased global liquidity pressure, a "soft-landing" Fed rate cut, and U.S. regulatory clarity via legislation like the stalled CLARITY Act are needed. Currently, Bitcoin is not a safe haven but an already-cleared asset. Its low correlation with tech stocks, however, makes it a potential diversification play for institutional portfolios once the storm passes. The money isn't here yet, but the positioning is underway.

marsbit19 min fa

Stocks Are Plummeting More Sharply Than Cryptocurrencies. Where Has the Money Gone?

marsbit19 min fa

In Conversation with Ray Dalio: We Are Currently in an AI Bubble, with 1% of My Portfolio in Bitcoin

Ray Dalio, founder of Bridgewater Associates, warns in an interview that the current AI boom shows classic bubble characteristics, which could lead to significant economic downturns as seen in past cycles like 1929 or 2000. He explains that speculative enthusiasm, fueled by debt and overvaluation, often precedes a crash when rising rates or taxation force asset sales, causing widespread losses and recession. Dalio also outlines his "Big Cycle" theory, describing an approximate 80-year pattern where widening wealth gaps, massive government deficits, and shifting geopolitical power (like China's rise) create internal conflict and global instability. He emphasizes that we are in a late-cycle, transitional phase where traditional powers like the US and UK face decline. For personal wealth protection, Dalio advises diversification beyond cash into assets like stocks, bonds, real estate, and particularly gold, which he prefers over Bitcoin. While he holds about 1% of his portfolio in Bitcoin as a non-printable hard asset, he views gold as more secure from technological or governmental threats. Regarding AI's impact, Dalio believes it will disproportionately benefit capital owners, worsening inequality by replacing both physical and cognitive labor. He suggests that human intuition and emotional intelligence, combined with AI, will be key for future workers. On taxation, Dalio argues that wealth taxes are impractical and risk triggering asset sell-offs, reducing productive investment. He points to the UK as a cautionary example of debt, low productivity, and political strife. Geopolitically, Dalio foresees a more regionalized world, with the US showing weakness in prolonged conflicts like with Iran, akin to past imperial declines. The ideal outcome, he suggests, is coexisting powerful blocs (e.g., Americas, China-Asia Pacific) without major war.

marsbit4 h fa

In Conversation with Ray Dalio: We Are Currently in an AI Bubble, with 1% of My Portfolio in Bitcoin

marsbit4 h fa

Daily 7.2 Trillion KRW: Foreign Capital's Record Net Buying on Friday! Wall Street Says Headwinds for Korean Stock Fund Flows Have Subsided

South Korean stock market sees a dramatic shift in fund flows. On July 31, foreign investors made a record net purchase of approximately KRW 7.2 trillion in KOSPI stocks, marking a fundamental reversal from the persistent large-scale net outflows seen in previous months. This contributed to a significant narrowing of foreign net selling in July to KRW 9.8 trillion, down sharply from KRW 48.4 trillion in June and KRW 44.5 trillion in May. Simultaneously, domestic institutional pressure eased. South Korean pension funds and asset managers turned to a net buying position in July, purchasing KRW 1.0 trillion worth of KOSPI shares, contrasting with net sales in May and June. Market volatility is expected to be dampened by new financial regulations. Effective July 31, the Financial Services Commission tightened access for retail investors to single-stock leveraged ETFs by raising the minimum cash deposit requirement. Trading volumes for these products subsequently dropped to about 50% of their monthly average. Citigroup Research maintains its year-end KOSPI target of 10,000 points. The firm cites several supportive factors: the substantial easing of headwinds from capital outflows, a robust fundamental outlook for the semiconductor sector, historically low market valuations, strong economic fundamentals, and the potential for policy support from financial authorities if needed.

marsbit4 h fa

Daily 7.2 Trillion KRW: Foreign Capital's Record Net Buying on Friday! Wall Street Says Headwinds for Korean Stock Fund Flows Have Subsided

marsbit4 h fa

Trading

Spot
活动图片




