Intraday Quantitative Sentiment Fluctuation Analysis Report — December 17, 2025

marsbitPubblicato 2025-12-17Pubblicato ultima volta 2025-12-17

Introduzione

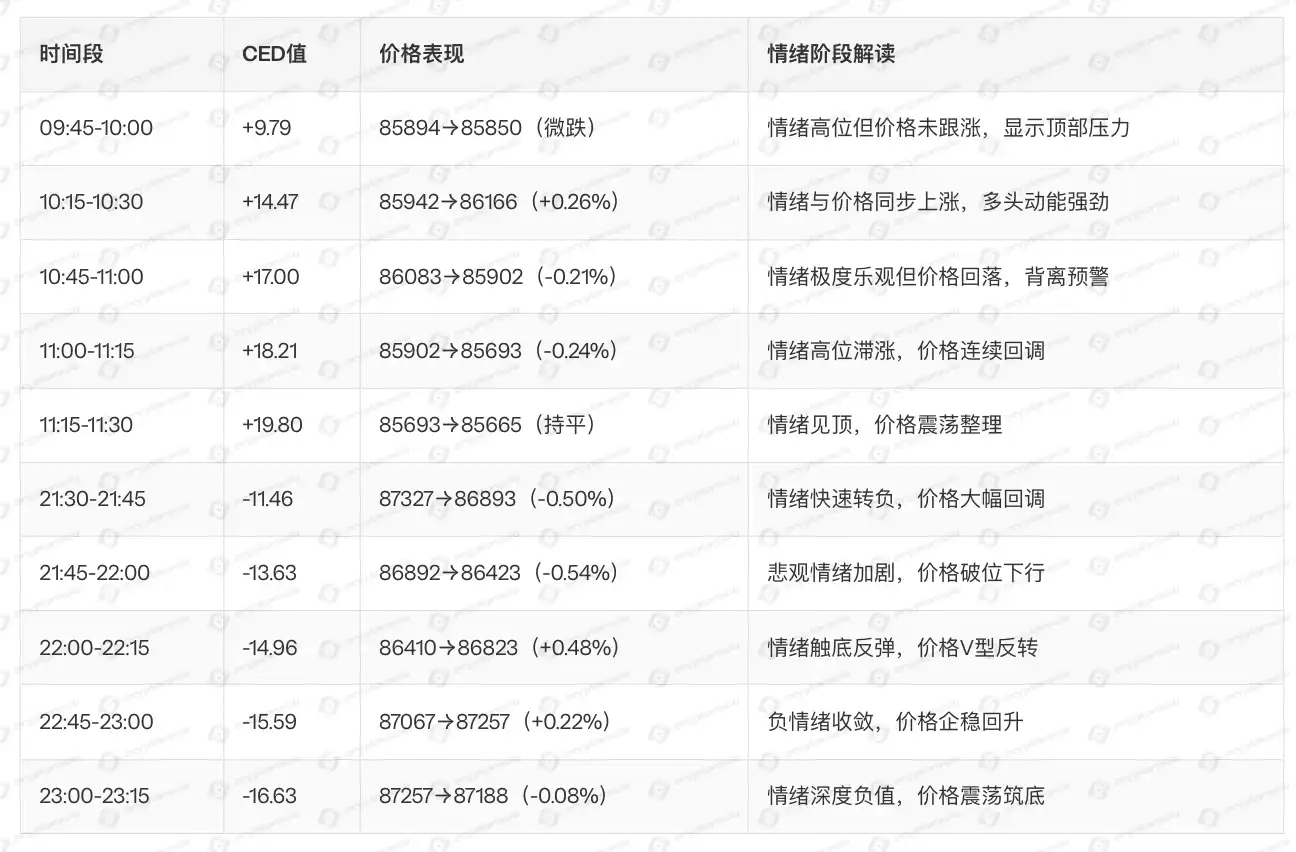
BTC Market Sentiment Analysis Report — 2025.12.17 Over the past 24 hours, BTC market sentiment showed a pattern of initial rise, subsequent decline, and eventual stabilization. Overall sentiment gradually retreated from high positive levels into negative territory, with signs of stabilization by the end of the session, though momentum remained weak. Key情绪 (sentiment) extreme points (where |CED| > 10) were observed. The session began with a sharp rise in sentiment to an extreme positive value (CED peak: +19.80) between 09:45-12:00, though price failed to follow, showing a clear divergence. From 12:00-18:00, sentiment gradually declined while prices moved within a narrow range. During the evening (18:00-24:00), sentiment turned negative, with CED dropping to -16.63, accompanied by significant price volatility. From midnight to early morning (00:00-09:45), sentiment oscillated within negative levels before converging, with prices stabilizing. During periods of extreme sentiment (|CED| > 10), price volatility increased significantly, with a higher probability of declines during negative sentiment phases. Neutral sentiment periods corresponded to relatively stable price action and balanced market forces. Notably, extreme positive sentiment often preceded price corrections, indicating that excessive optimism tended to signal adjustments. The market completed a V-shaped emotional cycle, moving from extreme positivity through deep negativity back to neutrality, suggesting a full ...

Over the past 24 hours, BTC market sentiment exhibited a first rise, then fall, and finally stabilization fluctuation pattern. Overall sentiment gradually declined from a high positive range to a negative range, with signs of stabilization appearing towards the end of the session, albeit with weak momentum.

Analysis of Extreme Sentiment Time Points (|CED| > 10)
Sentiment Change Rhythm

  • Morning Session (09:45-12:00): Sentiment rapidly surged to extreme positive values (CED peak +19.80), but prices failed to rise correspondingly, showing a significant divergence.
  • Afternoon to Evening (12:00-18:00): Sentiment gradually declined, with prices fluctuating within a narrow range.
  • Evening (18:00-24:00): Sentiment sharply turned negative, with CED dropping to a low of -16.63, accompanied by significant price volatility.
  • Early Morning to Morning (00:00-09:45): Sentiment oscillated and converged within the negative range, with prices stabilizing and recovering.

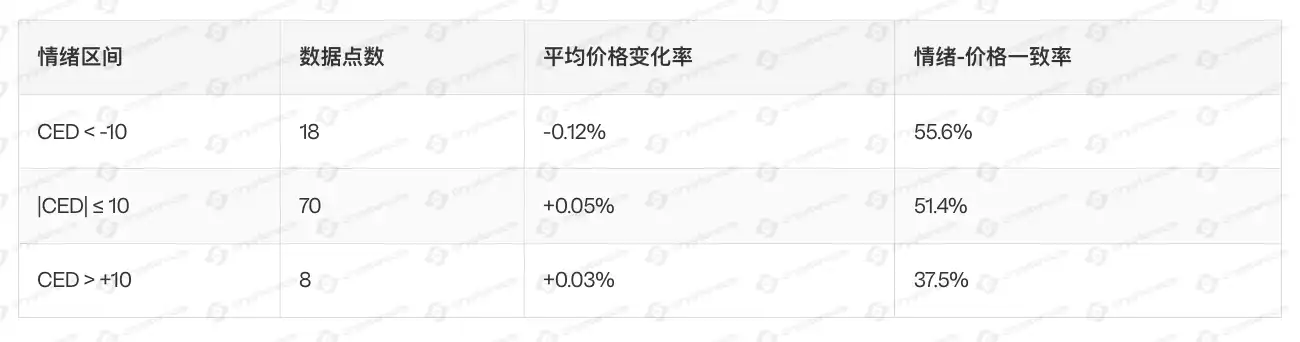
II. Relationship Between Extreme Sentiment Ranges and Market Trends
Trend Conclusions:

  • Extreme Sentiment Phase (|CED| > 10): Price volatility significantly amplifies, with a higher probability of declines in negative sentiment ranges.
  • Neutral Sentiment Range: Price changes are relatively stable, with a relative balance between bullish and bearish forces.
  • Sentiment-Price Consistency: Extreme positive sentiment often shows a clear divergence with prices, indicating that excessive optimism tends to foreshadow adjustments.

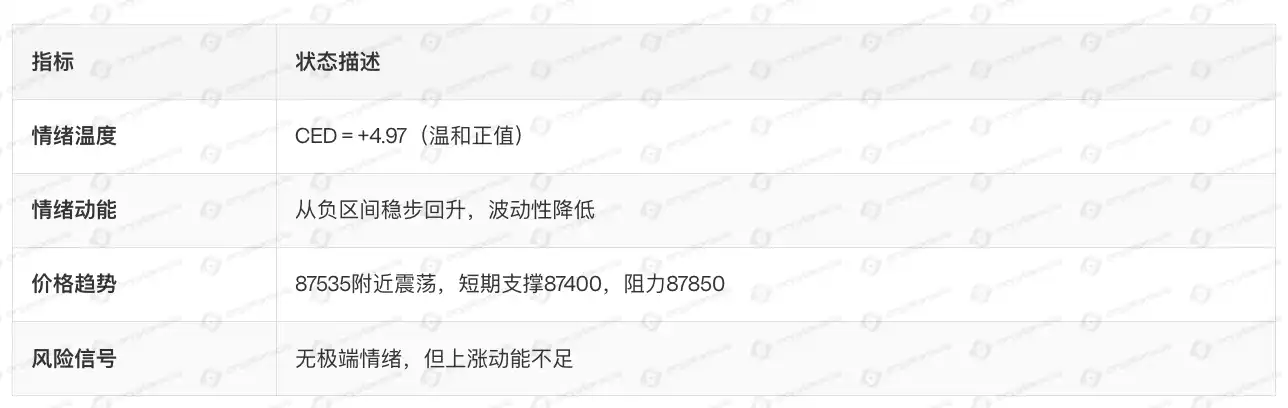
III. Summary of Current Market Conditions
IV. Core Conclusions

  • Sentiment Completed a V-Shaped Cycle: From extreme positive values through deep negative values back to neutral, market sentiment has undergone a full release cycle.
  • Price Resilience Emerged: Despite significant sentiment fluctuations, prices formed strong support within the 87,000-88,000 range.
  • Short-Term Expectation of Volatility: Sentiment momentum is weak, lacking clear directional drivers, and is expected to continue a range-bound consolidation pattern.
  • Breakout Signals to Monitor: If CED consistently stabilizes above +5 and breaks through 88,000 with volume, it may initiate a new round of upward movement.


Crypto di tendenza

Domande pertinenti

QWhat was the overall pattern of BTC market sentiment over the past 24 hours as described in the report?

AThe overall pattern was 'first rising, then falling, and finally stabilizing'. Sentiment started high in the positive zone, gradually fell into negative territory, and showed signs of stabilizing by the end of the period, albeit with weak momentum.

QAt what time did the sentiment reach its peak positive extreme value (CED), and what was notable about the price action at that time?

AThe sentiment reached its peak positive extreme value (CED of +19.80) during the morning session (09:45-12:00). It was notable that the price failed to rise synchronously, showing a significant divergence.

QWhat was the lowest CED value recorded and during which period did this occur?

AThe lowest CED value recorded was -16.63, which occurred during the evening session (18:00-24:00).

QAccording to the trend conclusions, what is the relationship between extreme sentiment (|CED| > 10) and price action?

ADuring periods of extreme sentiment (|CED| > 10), price volatility significantly amplifies, with a higher probability of price declines occurring during negative sentiment intervals.

QWhat are the key support level and potential signal for a new rally mentioned in the core conclusions?

AThe key support level is in the 87,000-88,000 range. A potential signal for a new rally would be if the CED consistently stabilizes above +5 and the price breaks above 88,000 with increasing volume.

Letture associate

Global Market Share Survey: Japanese Firms Lead in Semiconductor Materials

Global Market Share Survey: Japanese Firms Lead in Semiconductor Materials According to the 2025 "Major Goods and Services Market Share Survey" by Nikkei, Japanese companies maintain strong positions in semiconductor-related materials. In silicon wafers, Shin-Etsu Chemical ranks first with a 26.3% share, followed by SUMCO at 17.8%. Together, they hold 44.1% of the market, widening their lead over competitors from Taiwan, Germany, and South Korea. In photoresists, Tokyo Ohka Kogyo, JSR, and Shin-Etsu Chemical occupy the top three spots, with a combined share of 60.5%. Despite their strength in materials, Japanese firms have a weaker presence in core semiconductor segments like DRAM and NAND flash memory, where South Korean and U.S. companies dominate. For instance, SK Hynix and Samsung lead in DRAM, while China’s CXMT doubled its share to 6% in 2025. The semiconductor market is projected to grow rapidly, with WSTS forecasting a 90% increase to $1.5112 trillion by 2026. Major players like Samsung, SK Hynix, and Micron are making massive investments to expand capacity. To maintain their edge in materials, Japanese companies must similarly commit to large-scale, risk-taking investments. In contrast, Japan’s automotive sector shows stagnation. Toyota remains the global leader but with only a slight share increase to 12.3%, while Japanese brands are absent from the top five in the EV market. In shipbuilding, Imabari Shipbuilding rose to third place globally with a 7.2% share, benefiting from large container ship deliveries. However, Chinese and South Korean firms dominate the sector, holding the top two positions. Japan aims to revitalize its shipbuilding industry through government and corporate efforts, targeting a near doubling of output by 2035. Addressing labor shortages and adopting advanced technologies like physical AI will be critical for competitiveness.

marsbit13 min fa

Global Market Share Survey: Japanese Firms Lead in Semiconductor Materials

marsbit13 min fa

STRC Major De-pegging's First Financial Report, How Will Strategy Repair Its Capital Flywheel?

Bitcoin treasury company Strategy released its Q2 2026 earnings report on July 31. Despite a 6.9% year-over-year revenue increase to $122 million, the company recorded a net loss of $8.22 billion, largely due to $8.32 billion in unrealized losses from Bitcoin price fluctuations. As of quarter-end, Strategy holds 843,775 BTC with an average cost of $75,000 per coin, and Bitcoin per share increased. The report highlights a critical shift in Strategy's capital model following the de-pegging of its key financing tool, STRC (Strategic Coin), which fell below its $100 target. Management's top priority is restoring STRC to its target value, aiming for a recovery by September 8. They rule out discounted STRC issuances and plan to maintain its dividend yield at 12%, instead focusing on bolstering its $3.75 billion cash reserve. Strategy has moved from a one-way "buy-and-hold" Bitcoin strategy to active capital management. This new approach, part of its "Digital Credit Capital Framework," involves flexibly managing its balance sheet across four elements: BTC, USD cash, common stock (MSTR), and digital credit securities like STRC. This allows for BTC monetization (having sold $218.4 million in BTC so far), strategic repurchases of discounted securities, and debt optimization, as seen with a $1.5 billion convertible bond buyback. The company's future hinges on two key tests: successfully re-pegging STRC to restore market confidence in its digital credit system, and a long-term recovery in Bitcoin's price to ultimately support its growth thesis.

marsbit57 min fa

STRC Major De-pegging's First Financial Report, How Will Strategy Repair Its Capital Flywheel?

marsbit57 min fa

STRC's First Financial Report Post-Depegging, How is Strategy Restoring the Capital Flywheel?

On July 31, 2026, Bitcoin treasury company Strategy released its Q2 financial report. Despite a 6.9% year-over-year increase in revenue to $122 million, the company recorded a substantial net loss of $8.22 billion, primarily due to $8.32 billion in unrealized losses from Bitcoin holdings. While Strategy's core Bitcoin strategy remains intact—its holdings grew 11% to 843,775 BTC—the company is undergoing a fundamental shift in its capital model. Following the de-pegging of its key financing tool, the STRCoin (STRC), from its $100 target in May, Strategy has pivoted from a one-directional "raise funds, buy Bitcoin" cycle to a more dynamic, multi-asset capital management approach. A key part of this new framework is the "Monetization Program," through which Strategy has sold approximately $218.4 million worth of BTC to bolster liquidity. The company's top priority is repairing STRC's peg, committing not to issue discounted shares until it returns to its target range. It has initiated a $1 billion buyback program for discounted digital credit securities, having repurchased $28.9 million face value of STRC so far. Management aims to restore the peg around September 8, 2026. Strategy now actively manages a matrix of assets: Bitcoin (for accumulation or strategic sales), USD cash reserves (now at $3.75 billion), common stock (MSTR), and digital credit securities like STRC. This allows for tactical moves like repurchasing discounted debt or equity to capture value. The future success of Strategy's "capital flywheel" hinges on two factors: the short-term ability to successfully re-peg STRC to restore market confidence in its digital credit system, and the long-term price trajectory of Bitcoin, upon which its entire investment thesis ultimately depends.

Odaily星球日报1 h fa

STRC's First Financial Report Post-Depegging, How is Strategy Restoring the Capital Flywheel?

Odaily星球日报1 h fa

Trading

Spot

Articoli Popolari

Come comprare O

Benvenuto in HTX.com! Abbiamo reso l'acquisto di O1 exchange (O) semplice e conveniente. Segui la nostra guida passo passo per intraprendere il tuo viaggio nel mondo delle criptovalute.Step 1: Crea il tuo Account HTXUsa la tua email o numero di telefono per registrarti il tuo account gratuito su HTX. Vivi un'esperienza facile e sblocca tutte le funzionalità,Crea il mio accountStep 2: Vai in Acquista crypto e seleziona il tuo metodo di pagamentoCarta di credito/debito: utilizza la tua Visa o Mastercard per acquistare immediatamente O1 exchangeO.Bilancio: Usa i fondi dal bilancio del tuo account HTX per fare trading senza problemi.Terze parti: abbiamo aggiunto metodi di pagamento molto utilizzati come Google Pay e Apple Pay per maggiore comodità.P2P: Fai trading direttamente con altri utenti HTX.Over-the-Counter (OTC): Offriamo servizi su misura e tassi di cambio competitivi per i trader.Step 3: Conserva O1 exchange (O)Dopo aver acquistato O1 exchange (O), conserva nel tuo account HTX. In alternativa, puoi inviare tramite trasferimento blockchain o scambiare per altre criptovalute.Step 4: Scambia O1 exchange (O)Scambia facilmente O1 exchange (O) nel mercato spot di HTX. Accedi al tuo account, seleziona la tua coppia di trading, esegui le tue operazioni e monitora in tempo reale. Offriamo un'esperienza user-friendly sia per chi ha appena iniziato che per i trader più esperti.

407 Totale visualizzazioniPubblicato il 2026.06.19Aggiornato il 2026.06.29

Come comprare O

Come comprare PROS

Benvenuto in HTX.com! Abbiamo reso l'acquisto di Pharos (PROS) semplice e conveniente. Segui la nostra guida passo passo per intraprendere il tuo viaggio nel mondo delle criptovalute.Step 1: Crea il tuo Account HTXUsa la tua email o numero di telefono per registrarti il tuo account gratuito su HTX. Vivi un'esperienza facile e sblocca tutte le funzionalità,Crea il mio accountStep 2: Vai in Acquista crypto e seleziona il tuo metodo di pagamentoCarta di credito/debito: utilizza la tua Visa o Mastercard per acquistare immediatamente PharosPROS.Bilancio: Usa i fondi dal bilancio del tuo account HTX per fare trading senza problemi.Terze parti: abbiamo aggiunto metodi di pagamento molto utilizzati come Google Pay e Apple Pay per maggiore comodità.P2P: Fai trading direttamente con altri utenti HTX.Over-the-Counter (OTC): Offriamo servizi su misura e tassi di cambio competitivi per i trader.Step 3: Conserva Pharos (PROS)Dopo aver acquistato Pharos (PROS), conserva nel tuo account HTX. In alternativa, puoi inviare tramite trasferimento blockchain o scambiare per altre criptovalute.Step 4: Scambia Pharos (PROS)Scambia facilmente Pharos (PROS) nel mercato spot di HTX. Accedi al tuo account, seleziona la tua coppia di trading, esegui le tue operazioni e monitora in tempo reale. Offriamo un'esperienza user-friendly sia per chi ha appena iniziato che per i trader più esperti.

341 Totale visualizzazioniPubblicato il 2026.06.22Aggiornato il 2026.06.29

Come comprare PROS

Cosa è VERONA

I. Introduzione al Progetto VERONA è una blockchain costruita per tutti, ovunque attraverso l'astrazione della catena. Utilizzando il suo livello di astrazione generalizzato, VERONA si distingue integrando funzionalità blockchain complesse, come conti, firme e interoperabilità, direttamente a livello di protocollo. Questo approccio consente di interagire con le applicazioni blockchain senza la necessità di comprendere le tecnologie sottostanti.1) Informazioni di Base Nome:VERONA(VERONA)III. Link Correlati Link al sito ufficiale:https://xion.burnt.com/ Whitepaper:https://xion.burnt.com/whitepaper.pdf Esploratori:https://explorer.burnt.com/ Social Media: https://x.com/burnt_xion Nota: L'introduzione al progetto proviene dai materiali pubblicati o forniti dal team ufficiale del progetto, che è solo a scopo di riferimento e non costituisce consulenza per investimenti. HTX non si assume responsabilità per eventuali perdite dirette o indirette risultanti.

351 Totale visualizzazioniPubblicato il 2026.06.22Aggiornato il 2026.06.22

Cosa è VERONA

Discussioni

Benvenuto nella Community HTX. Qui puoi rimanere informato sugli ultimi sviluppi della piattaforma e accedere ad approfondimenti esperti sul mercato. Le opinioni degli utenti sul prezzo di A A sono presentate come di seguito.

活动图片