In Just 70 Days, Polymarket Easily Rakes in Tens of Millions in Fees

Odaily星球日报Pubblicato 2026-03-16Pubblicato ultima volta 2026-03-16

Introduzione

Polymarket, a prediction market platform, has generated over $11.2 million in fees in just 70 days since introducing transaction fees on January 6. Initially applied only to "15-minute crypto up/down" markets, the fee structure charges more when odds are near 50% (up to 1.56%) and less when they approach 0% or 100%. By March 6, fees were expanded to all crypto-related markets, which now drive most of the revenue. Weekly fee income has shown consistent growth, reaching $1.84 million in a recent week. If current trading volume and structure continue, Polymarket’s annualized revenue is estimated at $58.4 million under a conservative model. A more aggressive projection—assuming fees are applied to all markets—could yield up to $360 million per year. The platform has also distributed $13.41 million in liquidity provider incentives, which March revenue is on track to cover entirely. Polymarket’s revenue potential hinges on two factors: continued growth in trading volume and further expansion of fee-based markets. The platform has effectively proven the profitability of the prediction market model, positioning it as a highly efficient revenue generator in the crypto ecosystem.

Original | Odaily Planet Daily (@OdailyChina)

Author | Azuma (@azuma_eth)

On January 6th of this year, Polymarket officially ended its "zero-fee" model, beginning a trial implementation of transaction fees starting with the "15-minute cryptocurrency up/down" markets. The specific fee rate varies with the market's real-time odds — the closer the odds are to 0% or 100%, the lower the fee; conversely, the closer the odds are to 50%, the higher the fee, up to a maximum of 1.56%.

Later, on January 28th, about three weeks after the fees were introduced, we published an article titled "Data Estimates Show Polymarket Could Easily Exceed $100 Million in Annual Revenue, Assuming...". The article provided a static estimate based on Polymarket's trading volume and activity structure at the time: in the most conservative scenario, if the scope of fee-charging markets remained unchanged, Polymarket was projected to generate approximately $38 million in annual income; in the most aggressive scenario, if Polymarket extended fees to all markets, it was projected to earn $418 million in annual fee revenue.

When we last estimated Polymarket's revenue, we were hampered by an overly short observation period and too few calculable samples. Now, nearly two months later, we have used richer data to re-estimate Polymarket's revenue expectations. The results show that the so-called "conservative" estimate was indeed too conservative, and the "aggressive" expectation isn't too exaggerated.

Changes in Revenue Data

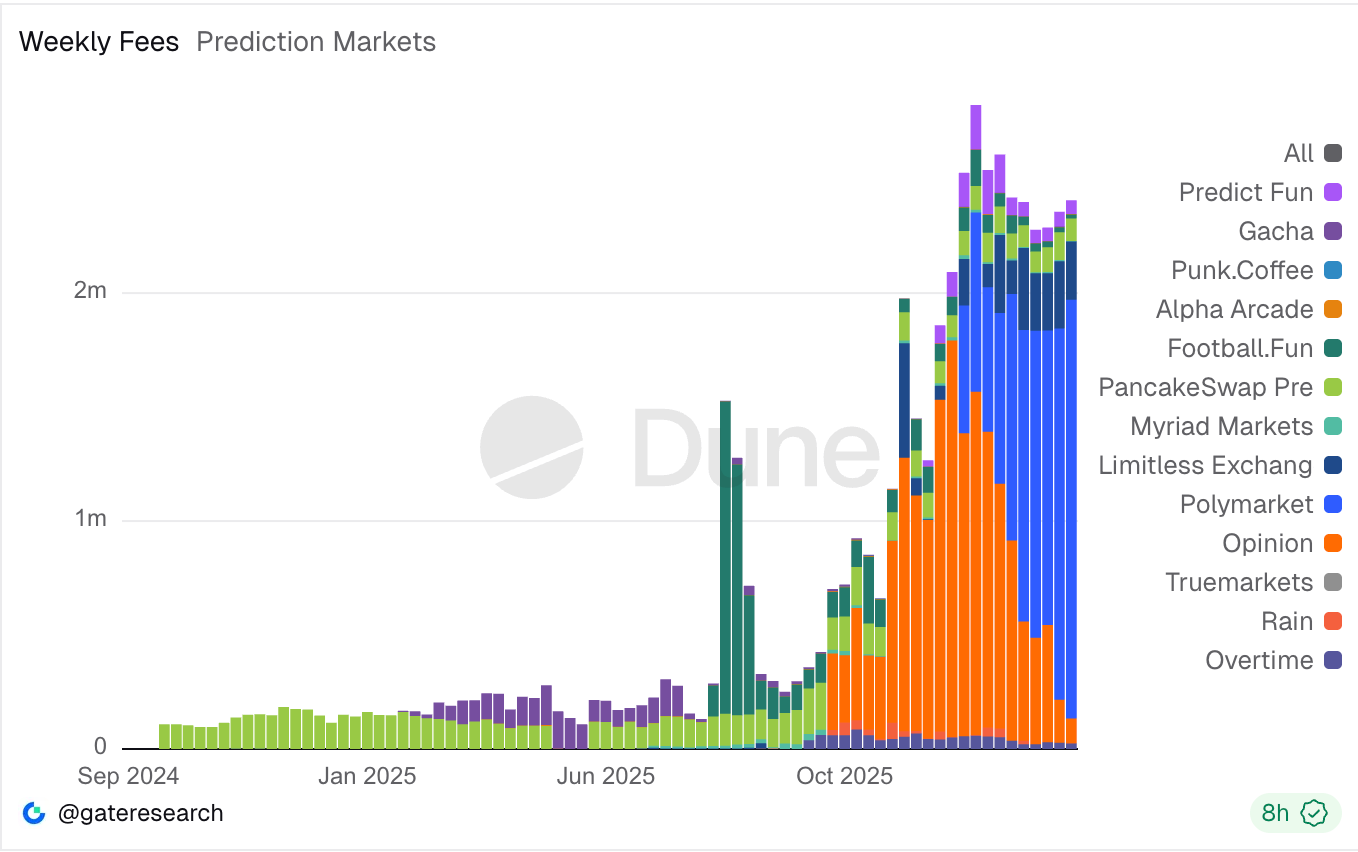
According to data compiled by Gate Research on Dune, since transaction fees were introduced on January 6th, Polymarket has accumulated over $11.2 million in fee revenue.

Using the most conservative method for another static estimate, assuming the trading volume and activity structure of the relevant markets remain unchanged, Polymarket is projected to generate approximately $58.4 million in annual revenue.

However, this estimation method does not accurately reflect Polymarket's revenue-generating capability.

The reason is that Polymarket's revenue data is clearly in a growth trend — over the past 10 weeks, the platform's weekly fee revenue has been $560,000, $786,000, $633,000, $749,000, $1.08 million, $1.28 million, $1.35 million, $1.29 million, $1.63 million, $1.84 million... showing almost weekly significant growth.

Reasons for Revenue Growth

There are two reasons for the growth in Polymarket's fee revenue. First, Polymarket has expanded the scope of fee-charging markets; second, Polymarket's overall trading volume and the trading volume in fee-charging markets have been growing continuously.

Regarding the scope of fee-charging markets, Polymarket extended the fee mechanism to all cryptocurrency-related markets on March 6th. Additionally, even earlier, it had begun trialing fee collection in sports markets like NCAA and Serie A. However, the former (cryptocurrency-related markets) currently remains the primary source of fee revenue.

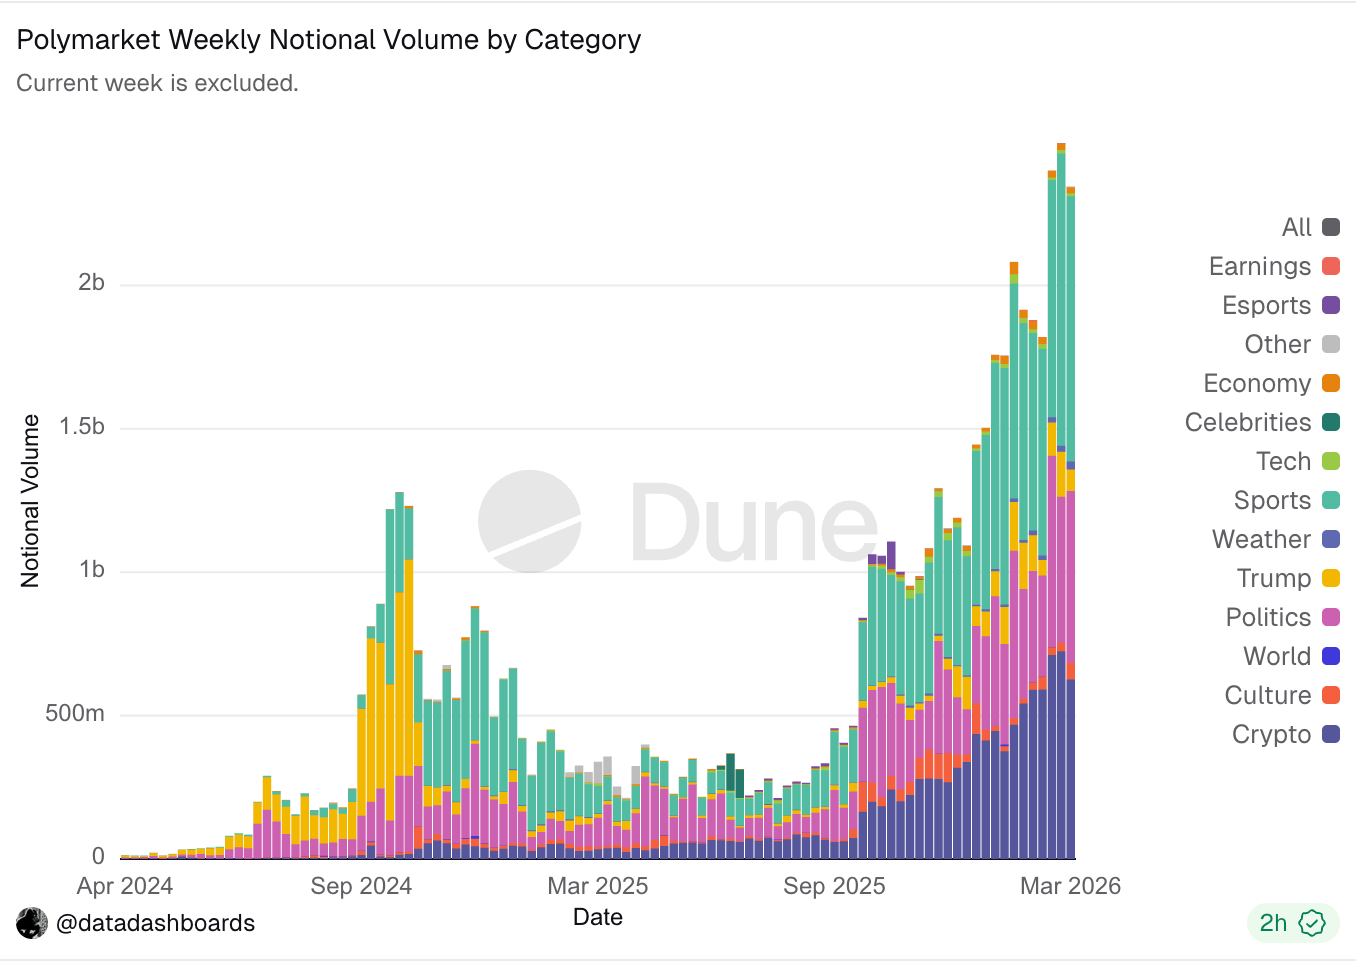
Regarding trading volume, the data dashboard compiled by Data Dashboards on Dune shows that Polymarket's weekly overall trading volume and cryptocurrency market volume (the bottom purple bars) have been growing steadily.

Future Revenue Projections

When we last projected Polymarket's revenue, we had to manually extract the trading volume proportion of "15-minute cryptocurrency up/down" related markets within all cryptocurrency-related markets. But now, since Polymarket extended fees to all cryptocurrency-related markets on March 6th, this estimation is much more straightforward. As for NCAA and Serie A, perhaps because the former hasn't entered the "March Madness" official tournament yet, and the latter has relatively low cultural attention in the US, the trading volume scale of these markets is significantly smaller compared to cryptocurrencies, so they are temporarily ignored here.

Taking data from the only full week after March 6th (March 9th-15th), the trading volume of cryptocurrency-related events accounted for 26.7% of the platform's total trading volume that week. In the same week, Polymarket's fee revenue was approximately $1.84 million. Based on this ratio for a static projection, under the current trading volume level and structure, if Polymarket introduces a similar fee model across all markets, it is projected to bring in $360 million in annual revenue for the platform.

The Money Printer is Already Running

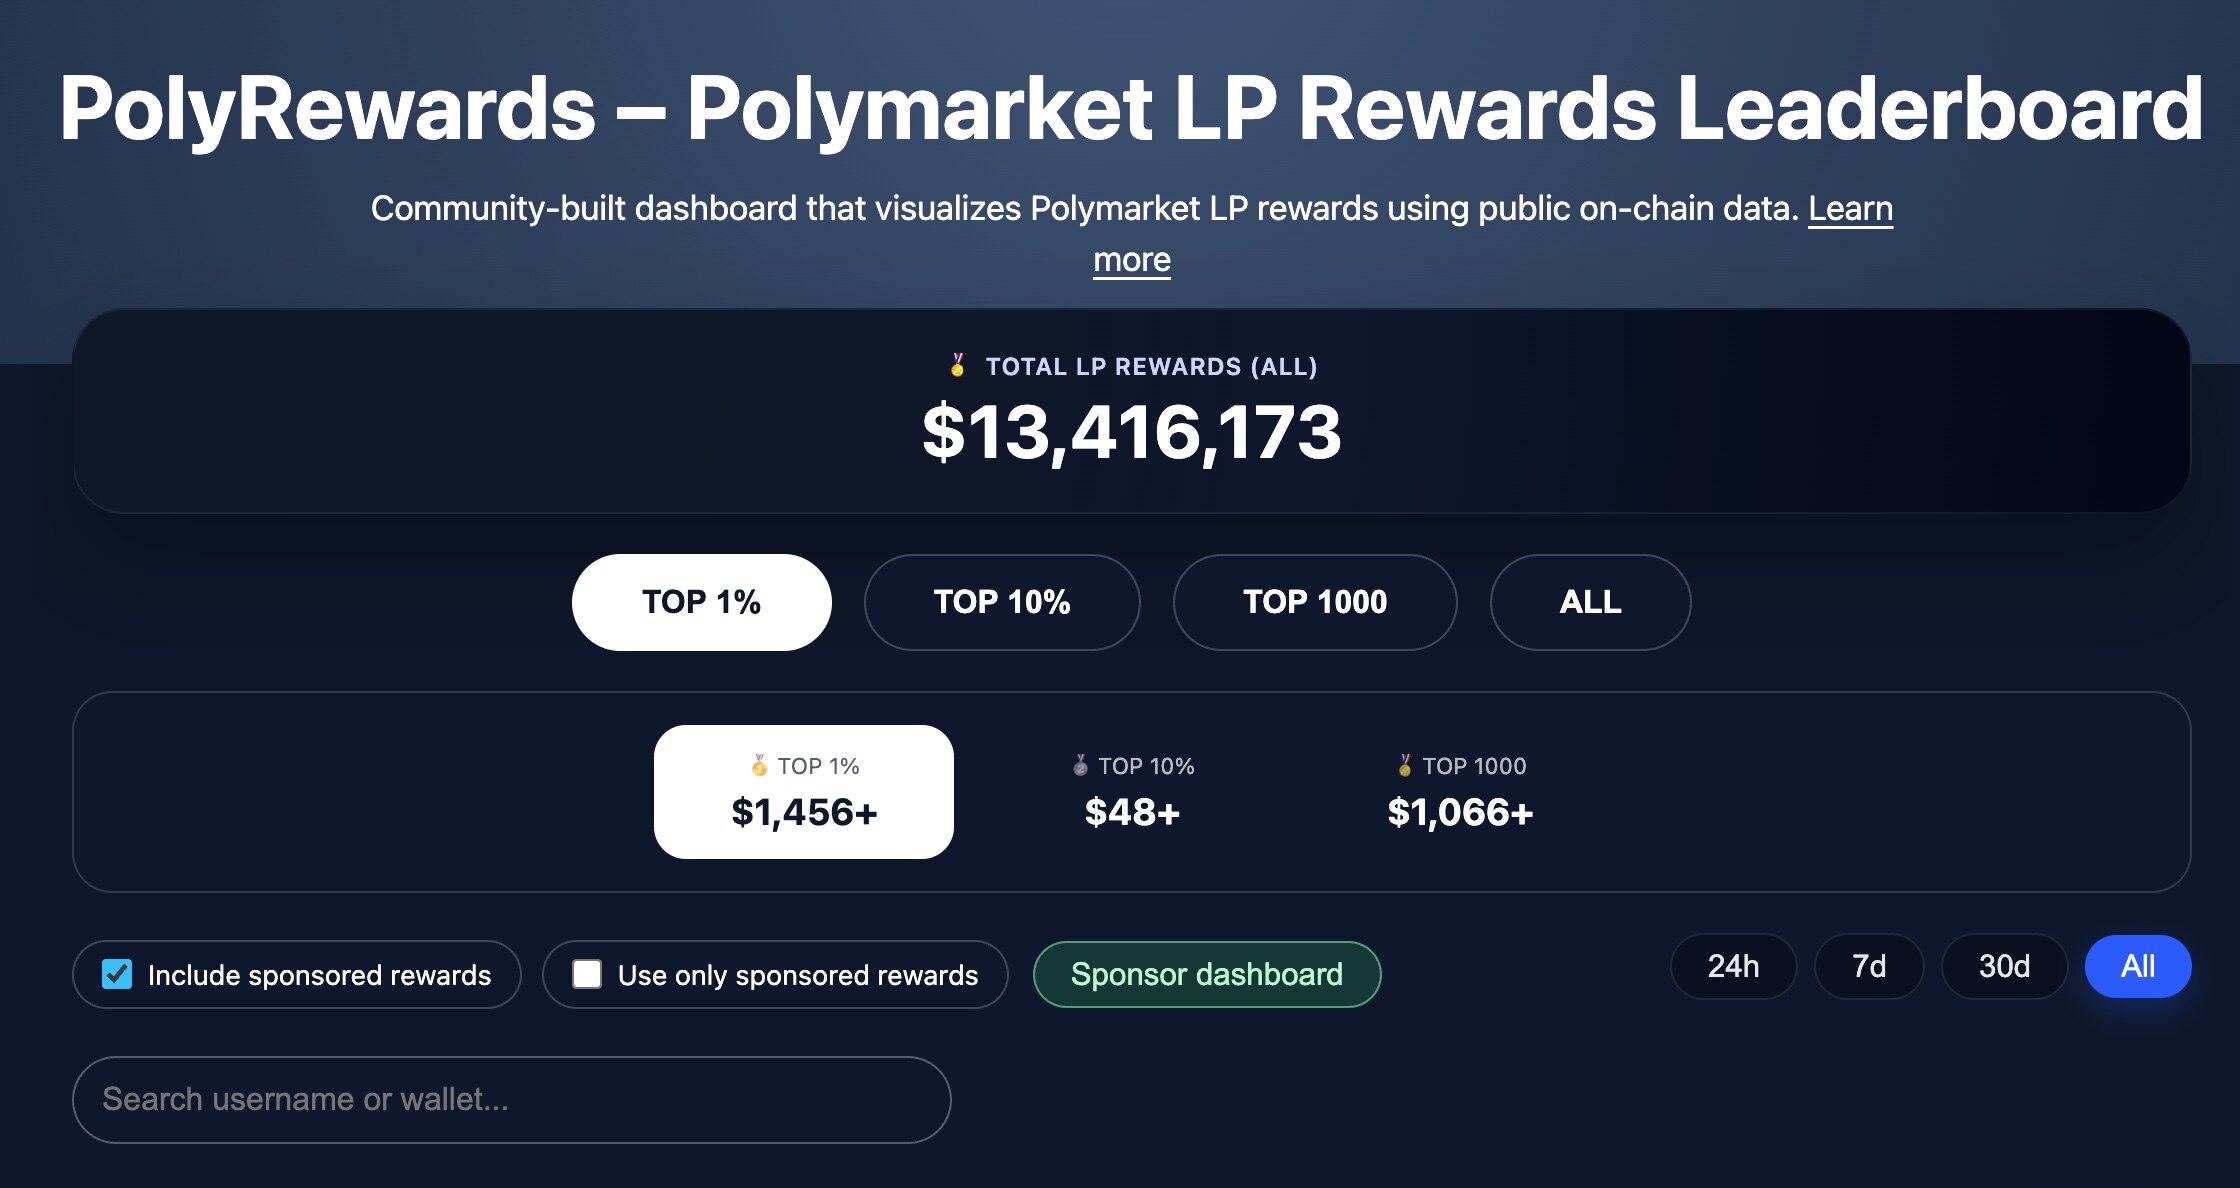
It is worth mentioning that, as a key measure for Polymarket to expand liquidity, the platform has so far distributed a total of $13.41 million in subsidies to liquidity providers (LPs). In contrast, if the data for the remainder of March can continue the performance of the first half, the fee revenue generated by Polymarket within this month alone could cover the total expenditure on liquidity subsidies.

Polymarket has largely proven the revenue-generating capability of this new form of prediction markets. Future revenue growth will mainly depend on two variables — how much more trading volume can grow, and whether fees can be further extended to more markets.

If these two variables continue to trend upwards, prediction markets might become the simplest and most direct "money printer" in the cryptocurrency industry.

Domande pertinenti

QWhen did Polymarket start charging transaction fees, and what was the initial market targeted?

APolymarket started charging transaction fees on January 6, beginning with the '15-minute cryptocurrency up/down' markets.

QHow much fee revenue has Polymarket accumulated since it began charging fees?

APolymarket has accumulated over $11.2 million in fee revenue since it started charging transaction fees.

QWhat are the two main reasons for the growth in Polymarket's fee revenue?

AThe two main reasons are the expansion of fee-charging markets to include all crypto-related markets and the continuous growth in overall trading volume, particularly in cryptocurrency markets.

QWhat is the estimated annual revenue for Polymarket if fees are extended to all markets, according to the latest data?

AIf fees are extended to all markets, the estimated annual revenue for Polymarket is approximately $360 million, based on current trading volume and structure.

QHow does Polymarket's fee revenue compare to the subsidies it has provided to liquidity providers (LPs)?

APolymarket has provided a total of $13.41 million in subsidies to LPs. If the revenue trend from the first half of March continues, the fee income for the month alone could cover the total subsidies paid to LPs so far.

Letture associate

The Essence of AI Layoffs: Why More AI Adoption Leads to More Corporate Anxiety?

The author, awaiting potential inclusion on an 8000-person layoff list, analyzes the true nature of recent "AI-driven" layoffs. They argue that while AI use, particularly tools like Claude for code generation, has skyrocketed and boosted developer output (e.g., 2-5x more code commits), this has not translated into proportional business growth or revenue. The core issue is a misalignment between increased "Input" (code) and tangible "Outcomes" (user value, revenue). AI acts as a costly B2B SaaS, inflating operational expenses without guaranteed returns. Two key problems emerge: 1) The friction that once filtered out bad ideas is gone, as AI allows cheap pursuit of even weak concepts. 2) Organizational "alignment tax"—the difficulty of coordinating across teams—becomes crippling when development velocity outpaces consensus-building. Thus, layoffs serve two immediate purposes: 1) To offset ballooning AI costs (Token consumption) and maintain cash flow, as rising input costs without outcome growth destroys unit economics. 2) To reduce organizational bloat and alignment friction by simply removing teams, thereby speeding up execution in the short term. Therefore, these layoffs are fundamentally caused by AI, even if AI doesn't directly replace roles. They represent a painful correction until companies learn to convert AI-driven productivity into real business outcomes and streamline organizational coordination to match the new pace of work. The cycle will continue until this learning curve is mastered.

marsbit3 min fa

The Essence of AI Layoffs: Why More AI Adoption Leads to More Corporate Anxiety?

marsbit3 min fa

Can the Solana Foundation and Google's Collaboration on Pay.sh Bridge the Payment Link Between Web2 and Web3 in the Agent Economy?

Solana Foundation, in collaboration with Google Cloud, has launched Pay.sh, a payment gateway designed to bridge the gap between AI agents and enterprise-grade service infrastructure. The initiative aims to solve a key bottleneck in the "agent economy": existing payment systems are ill-suited for autonomous AI agents. Traditional methods like credit cards require human verification, while newer on-chain protocols like x402 and MPP create a separate, Web3-native system that raises barriers for service providers. Pay.sh functions as a universal payment layer. It allows users to fund a Solana wallet via credit card or stablecoin, which then acts as an identity and payment proxy for AI agents. When an agent needs to access a paid API service (e.g., Google Cloud, Alibaba Cloud), Pay.sh handles the transaction seamlessly. It leverages the HTTP 402 status code ("Payment Required") to initiate payments, intelligently choosing between one-time transfers (x402-style) or session-based authorizations (MPC-style) based on the service's billing model. This spares agents from manual account registration and API key management. A key feature for service providers is low integration effort. They can adopt Pay.sh by providing a declarative configuration file, enabling features like tiered pricing, free tiers, and automatic revenue splitting to multiple addresses (e.g., for royalties, cloud costs). Providers can also list their APIs in a central Pay Skill Registry for agent discovery. The collaboration with Google Cloud provides crucial infrastructure for API proxying, traffic routing, and compliance logging, aiming to keep agent activities within regulated boundaries. By connecting Web2 services with Web3 payment rails, Pay.sh positions the Solana wallet as a foundational identity and payment tool for AI agents, potentially driving more transaction volume to the Solana ecosystem. However, the report notes challenges. The service registry currently lacks robust vetting, risking exposure to unauthorized or malicious third-party APIs. Pay.sh also inherits security and compatibility risks from its underlying payment protocols (x402, MPC). Furthermore, adoption may be hindered by varying regional data privacy and payment compliance regulations among API providers. Despite these hurdles, Pay.sh represents a significant step towards integrating Web2 and Web3 for autonomous agent commerce.

marsbit10 min fa

Can the Solana Foundation and Google's Collaboration on Pay.sh Bridge the Payment Link Between Web2 and Web3 in the Agent Economy?

marsbit10 min fa

Bitcoin's Bull-Bear Cycle Indicator Turns Positive for the First Time in 7 Months: End of Bear Market or False Breakout?

Bitcoin's "Bull-Bear Market Cycle Indicator" from CryptoQuant has turned positive for the first time since October 2025. This gauge, based on the P&L Index relative to its 365-day moving average, suggests a potential shift from a bear market phase. Concurrently, the Bull Score Index rose to a neutral reading of 50 in late April. The indicator's move into positive territory follows a roughly 35% price rebound from a low near $60,000 in February to above $81,000. The recovery over approximately three months was faster than the 12-month period observed during the 2022 bear market. However, analysts caution against premature optimism, citing a historical precedent from March 2022. Back then, the Bull Score Index briefly hit 50, but it proved to be a false signal as Bitcoin's price subsequently plunged further. Structural differences exist in the current cycle, including consistent inflows into spot Bitcoin ETFs and an increase in large holder addresses. Yet, some models, referencing the four-year halving cycle, suggest a potential deeper bottom near $50,000 might still be possible around late 2026. In summary, while on-chain data shows marked improvement and the worst panic may be over, market participants remain cautious. A convincing trend reversal confirmation likely requires Bitcoin to sustainably break above key resistance, such as the 200-day moving average near $82,000.

marsbit17 min fa

Bitcoin's Bull-Bear Cycle Indicator Turns Positive for the First Time in 7 Months: End of Bear Market or False Breakout?

marsbit17 min fa

How to Automate Any Workflow with Claude Skills (Complete Tutorial)

This is a comprehensive guide to mastering Claude Skills, a feature for creating permanent, reusable instruction sets that automate specific workflows. Unlike simple saved prompts, Skills function like trained employees, delivering consistent, high-quality outputs by defining the entire task process, standards, error handling, and output format. The guide is structured in four phases: **Phase 1: Installation (5 minutes).** Skills are folders containing a `SKILL.md` file. The user is instructed to find a relevant Skill online, install it, test it on a real task, and compare its performance to one-off prompts. **Phase 2: Building Your First Custom Skill.** Start by rigorously defining the Skill's purpose, trigger phrases, and providing a concrete example of perfect output. The `SKILL.md` file has two parts: a YAML frontmatter with a specific name/description/triggers, and a detailed, step-by-step workflow written in natural language with examples and quality standards. **Phase 3: Testing & Optimization for Production.** Test the Skill in three scenarios: 1) a standard, common task; 2) edge cases with missing or conflicting data; and 3) a pressure test with maximum complexity. Any failure indicates a needed instruction. Implement a weekly optimization cycle to continuously refine the Skill based on real usage. **Phase 4: Building a Complete Skill Library.** The goal is to create a team of Skills for all repetitive tasks. Examples are given for industries like real estate, marketing, finance, consulting, and e-commerce. The user should list their tasks, prioritize them, and build one new Skill per week, maintaining a master document to track their library. The conclusion emphasizes the compounding time savings: ten Skills saving 30 minutes each per week reclaims over 260 hours (6.5 work weeks) per year, fundamentally transforming one's work system.

marsbit41 min fa

How to Automate Any Workflow with Claude Skills (Complete Tutorial)

marsbit41 min fa

Trading

Spot
Futures
活动图片