Hyperliquid: Should HYPE investors wait as price nears $32 zone?

ambcryptoPubblicato 2026-04-02Pubblicato ultima volta 2026-04-02

Introduzione

Hyperliquid (HYPE) has continued its short-term downtrend, falling below the key $37 support level on April 2nd. Despite previous bounces, none of the recent rebounds were strong enough to push the price toward the local high of $43.7. The broader market sentiment remains pessimistic, with Bitcoin and other altcoins also facing selling pressure. The long-term structure, however, remains bullish. HYPE experienced a significant rally in 2025, nearly reaching $60, before pulling back to $20 by year-end. The recent rise to $43.7 is considered part of a new bullish wave, with the current retracement viewed as a temporary setback. Key Fibonacci retracement levels suggest further potential declines toward the $29.5–$32.44 zone, which long-term buyers are eyeing as a demand area. Technical indicators, including the RSI below 50 and a negative CMF reading of -0.15, reflect bearish momentum and capital outflows. Traders are advised to wait rather than rush into buying. A move above $41.59 would invalidate the current bearish retracement outlook and signal potential new highs. Until then, investors should monitor the $29–$32 range for a buying opportunity.

Hyperliquid [HYPE] continued its short-term downtrend to fall below the $37 level on the 2nd of April. Since the 15th of March, $37 has acted as a reliable short-term support.

Each retest has seen a price bounce, but none of the bounces of the past two weeks were enough to drive prices to the local highs at $43.7. The final week of March saw a move above the psychological $40 mark, but the bears were quick to seize control of the trends thereafter.

At the same time, Bitcoin [BTC] and many prominent crypto altcoins were posting losses and reeling under selling pressure. The market sentiment remained extremely pessimistic.

Does this mean HYPE investors should sell and wait for the downtrend to continue?

HYPE investors should not miss THIS chance

Source: HYPE/USDT on TradingView

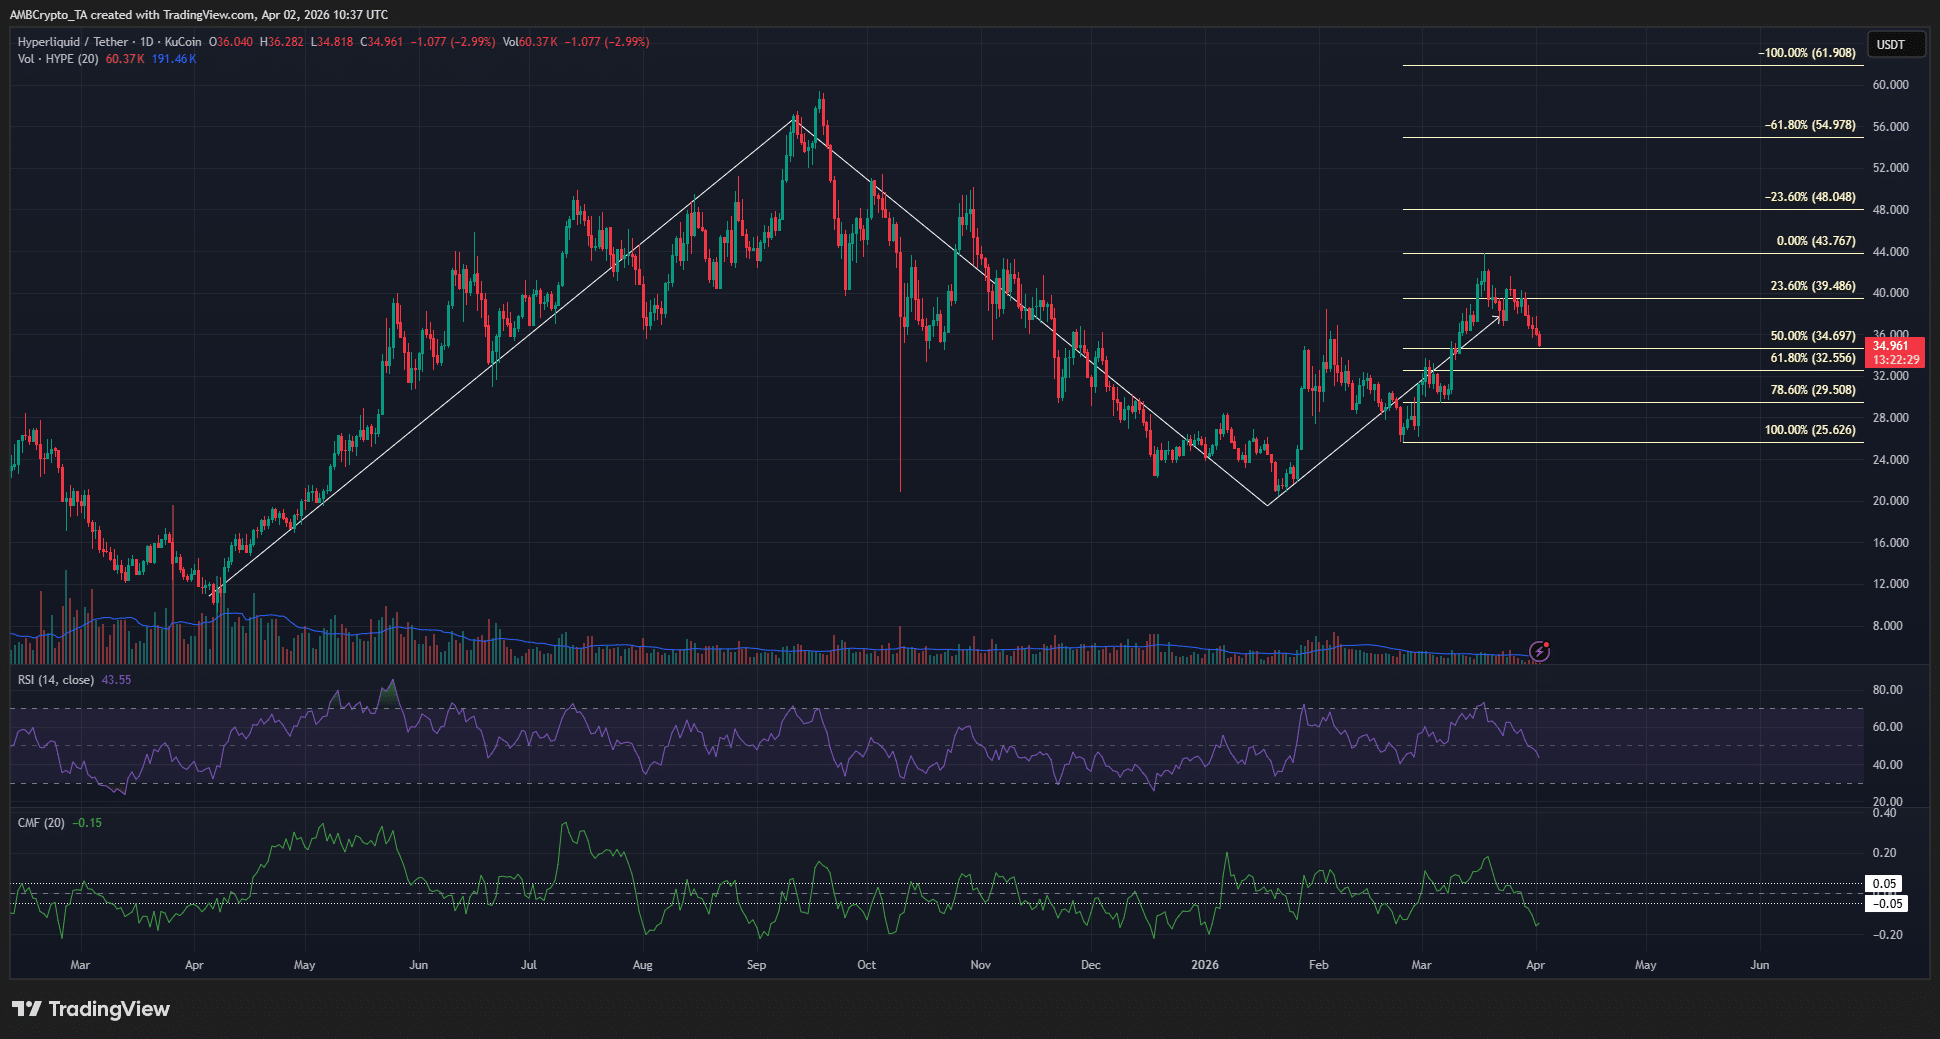
While the recent Hyperliquid token price losses seem grievous, they might just be part of a retracement. The long-term structure showed that HYPE saw a rally in 2025 that nearly reached $60, then pulled back to $20 by year-end.

The push higher to $43.7 since then has been part of the next bullish wave higher. The rally in March saw a pullback over the past two weeks, and this retracement could continue for a bit longer.

The Fibonacci retracement levels plotted for the most recent swing move higher from $25.6 showed that there was more space for HYPE to fall. The $32.44 and $29.5 were the levels in the golden pocket that long-term buyers will want to keep an eye on.

Yet, they shouldn’t rush to buy, either. At press time, the RSI showed that the momentum had turned bearish, with the RSI sliding below neutral 50. The CMF also reflected hefty capital outflows from the market, with a reading of -0.15.

Traders’ call to action: Wait

Source: HYPE/USDT on TradingView

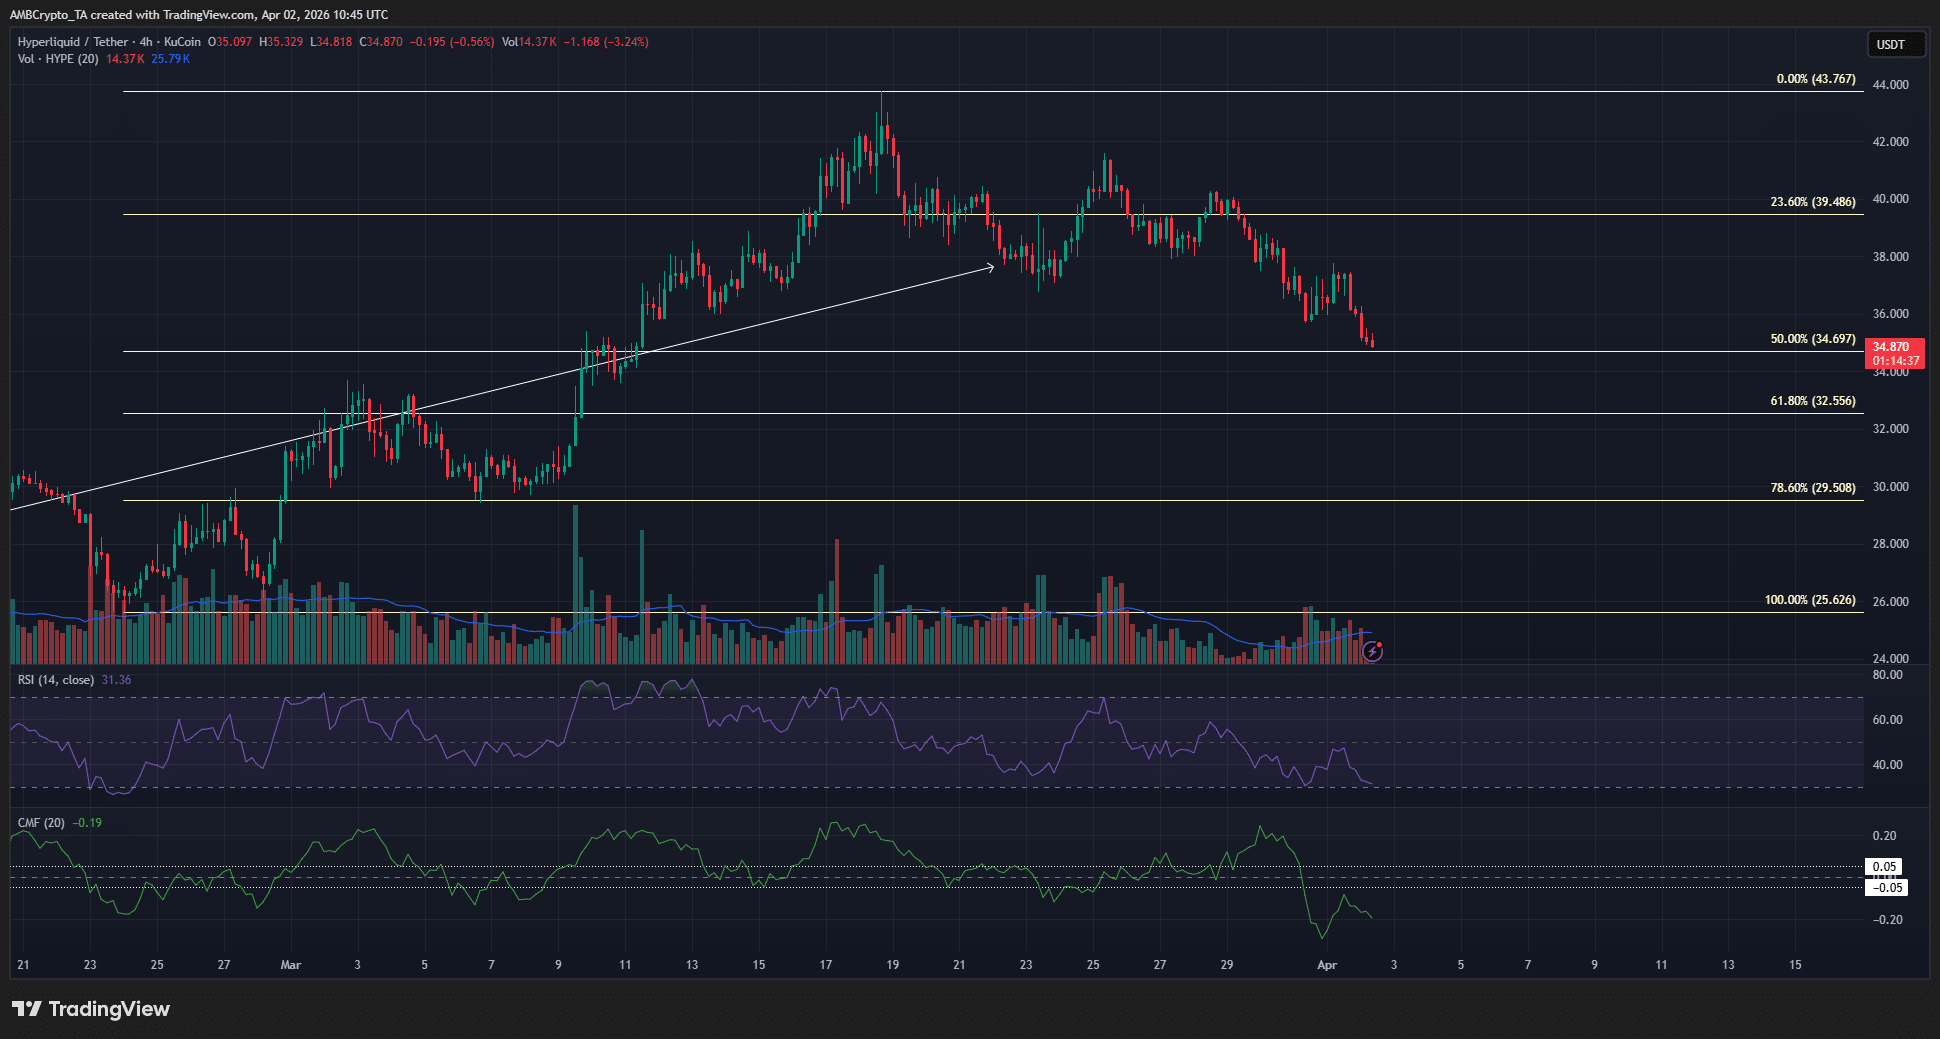
The 4-hour chart showed a bearish structure in place for HYPE. The lower high it set below $42 on the 25th of March was the swing high on this timeframe. Meanwhile, the $29.55-$32.5 zone remained the demand zone for buyers to defend.

A move back above $41.59 is needed to prove this retracement idea wrong and show that the token has what it takes to make new highs past $43.7. Until this happens, long-term investors can wait for the retracement to end before buying.


Final Summary

  • The long-term Hyperliquid token price trend was bullish, but the current short-term trend was bearish.
  • The current sell-off comes with the longer-term structure’s pullback. Therefore, investors with a time horizon will be watching the $29-$32 demand zone.

Domande pertinenti

QWhat key support level did Hyperliquid (HYPE) fall below on April 2nd, which had been reliable since mid-March?

AHyperliquid fell below the $37 support level on April 2nd, which had acted as a reliable short-term support since March 15th.

QAccording to the Fibonacci retracement levels, which two price zones are identified as the 'golden pocket' for potential long-term buying opportunities?

AThe Fibonacci retracement levels identified the $32.44 and $29.5 price zones as the 'golden pocket' for potential long-term buying opportunities.

QWhat two indicators are mentioned as showing bearish momentum and capital outflows for HYPE at press time?

AAt press time, the RSI had slid below the neutral 50 level, indicating bearish momentum, and the CMF had a reading of -0.15, reflecting hefty capital outflows.

QWhat price does HYPE need to move back above to prove the current retracement idea wrong and signal potential for new highs?

AHYPE needs to move back above $41.59 to prove the current retracement idea wrong and show potential to make new highs above $43.7.

QWhat is the overall recommendation for long-term HYPE investors based on the article's final summary?

AThe overall recommendation for long-term investors is to wait for the current retracement to end and to watch the $29-$32 demand zone as a potential buying opportunity, as the long-term trend remains bullish despite the short-term bearish trend.

Letture associate

Raising Interest Rates Is Not a Tech Killer, EPS Is: A Strategy for Discarding the Weak and Retaining the Strong After the AI Theme's Sharp Decline

**Summary: Rising Interest Rates Are Not the Killer of Tech; EPS Is: The "Keep the Strong, Ditch the Weak" Strategy After the AI Theme Plunge** The author argues that the sharp sell-off in tech and AI-related stocks, triggered by a strong US jobs report that heightened Fed rate hike fears, represents a "pullback to pick up passengers" rather than a "car crash." The true end of a tech bull market is not determined by an extra 25 basis point hike, but by industry overcapacity and the disproval of earnings per share (EPS) expectations. Historical analysis shows that during past rate hike cycles, the Nasdaq-100 often outperformed, provided EPS growth remained strong. The current phase is seen as a shift from a "broad narrative-driven rally" to a "focused verification stage" for AI. The investment strategy should be to "keep the strong, ditch the weak." * **Retain exposure** to high-conviction AI infrastructure leaders with clear order visibility, stable margins, strong cash flow, and upward EPS revisions (e.g., AI servers, advanced packaging, optical modules, key cloud suppliers). * **Reduce exposure** to high-beta, narrative-driven stocks with unclear profit paths (e.g., some quantum computing, space, or speculative chip stocks), especially on rebounds. Valuation concerns should focus on whether earnings can catch up to high multiples, not on high P/E alone. Crowded positioning signals a concentration into quality assets, not necessarily a market top. The upcoming Q2 earnings season will be a key validation point. The core principle is to hold stocks with proven EPS, while using macro events (CPI data, central bank meetings) to manage timing and risk.

marsbit31 min fa

Raising Interest Rates Is Not a Tech Killer, EPS Is: A Strategy for Discarding the Weak and Retaining the Strong After the AI Theme's Sharp Decline

marsbit31 min fa

The Largest IPO in History Ignites Heated Debate: Is SpaceX Worth $1.77 Trillion?

SpaceX's potential IPO is priced at $135 per share, aiming to raise $75 billion and valuing the company at approximately $1.77 trillion, which would make it the largest IPO in history. This valuation has sparked intense debate among investors. Bullish analysts, including major underwriters Goldman Sachs and Morgan Stanley, argue the valuation is justified by SpaceX's long-term potential. They see it not just as a rocket company but as a future leader in space infrastructure, with key growth drivers being Starlink satellite internet, low-cost rocket launches, and future AI-related ventures. They project revenues reaching hundreds of billions to trillions of dollars by 2030-2040. ARK Invest's model suggests a 2030 enterprise value could reach $2.5 trillion. Bearish analysts from independent research firms like Morningstar, PitchBook, and New Constructs contend the IPO price is excessively high, already pricing in unrealistic future growth. Using DCF and sum-of-the-parts models, they estimate fair value between $780 billion and $1.7 trillion, significantly below the IPO target. They highlight risks such as the speculative nature of AI projections, over-dependence on Elon Musk, high growth expectations, and corporate governance concerns. Trefis set a target price of just $79 per share. While both sides acknowledge SpaceX's unique position in commercial space, the core disagreement centers on whether the $135 share price offers a reasonable margin of safety or is overly optimistic. Despite the valuation controversy, reported strong demand for the IPO indicates significant market interest.

marsbit2 h fa

The Largest IPO in History Ignites Heated Debate: Is SpaceX Worth $1.77 Trillion?

marsbit2 h fa

After the Passage of the GENIUS Act and the CLARITY Act, What Is the Correct Architecture for On-Chain Yield?

The article discusses the evolution of on-chain credit, distinguishing three markets: overcollateralized crypto lending, unsecured lending (largely unsuccessful), and asset-backed credit (ABC). ABC, backed by identifiable real-world collateral with legal recourse, is identified as the fastest-growing category and the only one credibly addressing adverse selection—the core problem in credit where the riskiest borrowers self-select. Current growth in on-chain Real World Assets (RWAs), particularly tokenized private credit funds (e.g., Maple Finance, Centrifuge), is substantial but often merely "wraps" existing fund structures, inheriting their risks rather than solving adverse selection at the protocol level. The regulatory landscape is a key driver, with the US GENIUS Act (prohibiting stablecoin issuers from paying yield) and the proposed CLARITY Act (closing loopholes on indirect yield) set to redefine permissible yield-bearing products. This makes vaults (like ERC-4626) the critical architecture—they become the primary compliant vehicle for delivering yield, functioning as issuance, disclosure, distribution, and recovery mechanisms. The author's thesis is that the correct post-GENIUS/CLARITY architecture involves building ABC solutions where credit assessment, structure, and recovery are encoded directly into the smart contract vault layer, moving beyond mere tokenized fund wrappers to solve adverse selection fundamentally and ensure regulatory compliance.

Foresight News2 h fa

After the Passage of the GENIUS Act and the CLARITY Act, What Is the Correct Architecture for On-Chain Yield?

Foresight News2 h fa

Trading

Spot
Futures
活动图片