Author: qinbafrank
The stampede-like tragedy of deleveraging has already occurred. At this point, it's time to review and trace back how the deleveraging unfolded. From a personal perspective, this round of deleveraging started with the Korean stock market. Although U.S. stocks began deleveraging on July 1st, in hindsight, the first major bearish candlestick on June 23rd marked the beginning of the deleveraging. Today, let's trace through the timeline to understand exactly how this round of deleveraging in the Korean stock market happened.
I. Before June 23rd, the Market Already Possessed All the Conditions for a Stampede
To understand the subsequent collapse, we must first look at the market structure formed between May 27th and June 22nd.
1. Single-Stock 2x Leverage Products Further Concentrated Funds in Samsung Electronics and SK Hynix
On May 27th, single-stock 2x leveraged and inverse ETFs based on Samsung Electronics and SK Hynix were launched in the Korean market. By June 19th, individual investors had cumulatively net bought about 8.2 trillion won worth of leveraged long ETFs, with about 4.6 trillion for SK Hynix and 3.7 trillion for Samsung Electronics. During the same period, net purchases of inverse ETFs were only about 0.3 trillion won.
More importantly, the inflow wasn't simply from cash entering the market; funds were clearly shifting from more diversified semiconductor ETFs and KOSPI index ETFs towards single-stock leveraged products. By June 19th, the assets under management (AUM) of SK Hynix leveraged ETFs had reached 9.15 trillion won, and related Samsung Electronics products reached 5.22 trillion won.
This brought three structural changes:
1) Investors shifted from diversified sector exposure to concentrated exposure on two individual stocks;
2) Ordinary stock volatility was further amplified by 2x leverage;
3) The larger the ETF size grew, the larger the subsequent daily rebalancing trades became.
According to estimates by the Korea Capital Market Institute, the AUM of SK Hynix-related leveraged ETFs increased by about 4.31 trillion won from June 10th to 19th, of which about 3.6 trillion won was not from new subscriptions but from net value inflation due to the underlying stock's rise. This means that even without new investors entering the market, market appreciation itself automatically created larger subsequent rebalancing demand.
2. The Two Stocks Were Approaching "Half of KOSPI"
The combined market capitalization weight of Samsung Electronics and SK Hynix in the KOSPI index rose from 34% at the end of 2025 to 49% by May 26th, and further to 52% by July 15th.
This isn't traditional debt leverage, but it constituted very strong index structural leverage:
A 10% drop in these two stocks could directly drag the KOSPI down by about 5%, even if all other companies remained unchanged.
As of July 15th, the total market value of 16 single-stock leveraged or inverse products had expanded from 4.4 trillion won at their launch on May 27th to 11.9 trillion won, with daily trading volume increasing from 10.4 trillion to 13 trillion won.
3. The Regulator's Stance on June 22nd Became a Confidence Inflection Point
On June 22nd, the head of the Financial Supervisory Service publicly admitted that the approval of related products was "too hastily prepared" and stated that measures to stabilize the market were under study.
The regulator also explained that the initial approval of domestic single-stock leveraged products aimed not only to bring overseas product demand under domestic regulatory oversight but also to attract Korean retail funds back from the U.S. and Hong Kong markets to alleviate pressure on the won's depreciation, though the actual currency effect was limited.
By the end of May, the scale of various leveraged investments by Korean retail investors had reached about 60 trillion won.
The market implication of this statement was not "the regulator will immediately ban trading," but:
- The expectation of policy support for product expansion was broken;
- The room for product expansion by brokerages and asset managers was questioned;
- Foreign investors began worrying that regulations might change the market's liquidity structure;
- The market seriously evaluated the risk of 2x ETF reverse feedback for the first time.
II. Path of Major Indices
The following are the most important price nodes in this round. Relative declines are all benchmarked against the 9,114.55 point level on June 22nd.
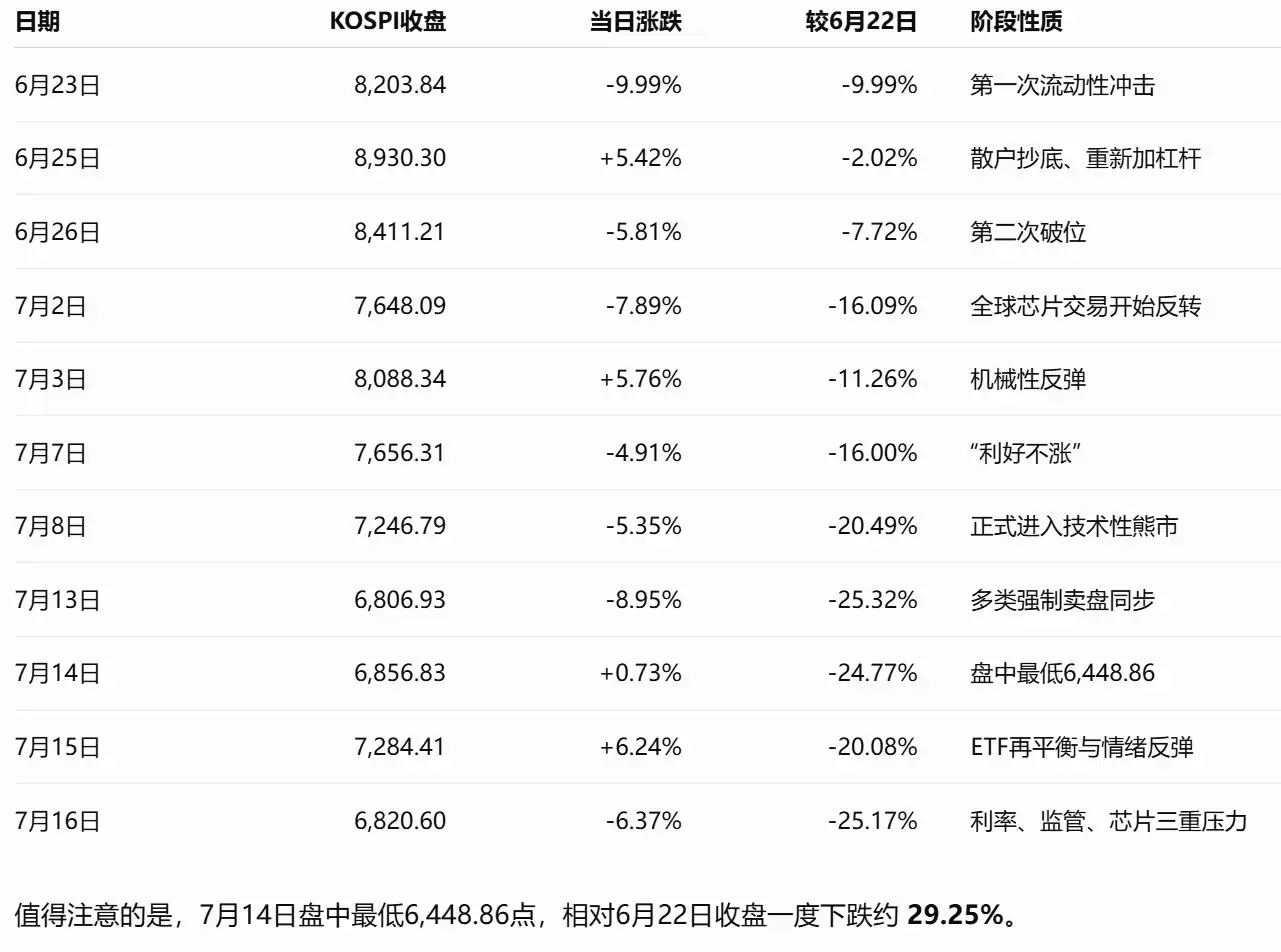
III. Deconstructing the Deleveraging Process by Timeline
Phase One: June 23rd – Price Collapsed First, but Debt Actually Didn't Fall
On June 23rd, KOSPI fell 9.99% in a single day, with Samsung Electronics and SK Hynix both dropping over 12%, triggering a 20-minute market-wide halt.
Direct triggers included:
- The regulator's strong warning on leveraged ETFs the previous day;
- Foreign investors starting concentrated selling of the two major chip leaders;
- Synchronous adjustment in global tech stocks;
- The market had been on a continuous upswing, and institutions had needs to realize profits and control weightings.
Since Samsung Electronics and SK Hynix already accounted for over half of KOSPI, selling pressure on these two stocks quickly turned from an individual stock issue into an index problem.
However, a very important and dangerous phenomenon occurred on this day:
- Forced liquidation amounts rose from about 19.9 billion won the previous day to 42.427 billion won;
- Unsettled receivables actually increased by 181.6 billion won, reaching 1.4792 trillion won;
- Credit financing balance remained around 38 trillion won.
In other words, the first day's plunge did not lead to widespread debt repayment by investors. On the contrary, some investors continued to use short-term credit funds to average down during the decline.
Nature of This Phase
This was a price deleveraging, not a balance sheet deleveraging.
Prices fell rapidly, ETF net values and collateral values declined; but retail investors did not retreat, instead they continued to buy the dip. Existing leverage wasn't cleared, and new leverage entered.
In terms of sentiment, the market still viewed the decline as a short-term technical sell-off caused by regulatory comments, not a trend reversal.
Phase Two: June 24th to 25th – Forced Liquidation and Re-leveraging Occurred Simultaneously
On June 24th and 25th, KOSPI rose 3.26% and 5.42% respectively. By the close on June 25th, it was only about 2% away from the June 22nd high.
But beneath the surface rebound, two completely opposite things happened internally.
On one side: Forced Liquidation
Publicly reported forced liquidations on June 24th reached about 110.793 billion won. This mainly involved the handling of short-term credit trades by securities firms where investors failed to replenish funds promptly.
On the other side: New Margin Financing
On the same day, the credit financing balance instead increased by about 5,392 billion won, reaching a record high of 38.6328 trillion won.
This meant:
Old accounts were being liquidated, while new accounts or surviving accounts were borrowing more money to buy the dip.
Therefore, June 24th became the peak for the overall market credit financing balance in this round, not the day before the June 23rd crash.
Why Leveraged ETFs Amplified the Rebound
2x long ETFs must restore their 2x target exposure daily.
Assuming an ETF's initial net value is A, holding 2A worth of stock or derivative exposure:
- After the underlying stock drops 10%, the ETF's net value drops to approximately 0.8A;
- The original exposure's market value becomes about 1.8A;
- The new target exposure should be 1.6A;
- Therefore, it needs to sell about 0.2A.
Conversely, when the underlying stock rises, the ETF must buy additional exposure.
Estimates from the Korea Capital Market Institute suggest that the rebalancing trade size of single-stock 2x ETFs is roughly proportional to "Previous Day's AUM × Daily Stock Price Change," and adjustments occur in both spot and futures markets in the same direction.
Therefore, the rebound from June 24th to 25th was jointly driven by:
- Retail investors buying the dip;
- Short covering;
- Leveraged ETF upward rebalancing;
- Brokerage and market maker hedging adjustments.
This wasn't a healthy rebound after completed deleveraging; it was more like re-leveraging mid-deleveraging.
Phase Three: June 26th to 30th – Foreign Investors Withdrew, Retail Investors Bought, Risk Began Shifting to Households
On June 26th, KOSPI fell another 5.81%. On June 29th, although it closed down only 0.20%, intraday volatility was very high. The Korean volatility index VKOSPI surged to a historical high of 97.99, compared to just 28.85 at the end of 2025.
The most important change in this phase was not a single trading day, but the shift in shareholding structure.
Foreign Investors Were Not Simply "Bearish on Korea," But Reducing Concentration
In the first half of 2026, foreign investors net sold about $70.8 billion from the Korean stock market; in June alone, net outflows were about $12.63 billion.
These sell-offs came from various institutions:
- Mutual funds sold about $7.5 billion;
- Pension funds sold about $4.35 billion;
- Hedge funds sold about $1.87 billion.
Analysis shows that not all these funds were driven by a judgment that the Korean economy or semiconductor profits would collapse, but because:
- Korean and Taiwanese chip stocks had risen too much;
- The weight of Samsung Electronics, SK Hynix, and TSMC rapidly expanded in global funds;
- Both passive and active funds needed to control concentration in a single country, single industry, and single stock;
- Some funds engaged in currency hedging and benchmark rebalancing;
- Long-term institutions took profits.
Retail Investors Became the Marginal Buyers of Last Resort
Korean individual investors cumulatively net bought about 42.4 trillion won worth of KOSPI stocks in June.
Therefore, the core capital structure in June was:
Foreign investors, pension funds, and mutual funds lowered risk, while Korean retail investors took over these positions using cash, margin, and leveraged ETFs.
This supported the index in the short term but created two consequences:
- Risk shifted from global institutional balance sheets to Korean household balance sheets;
- The average risk tolerance of remaining market holders became weaker, more sensitive to margin calls and price volatility.
Phase Four: July 1st to 3rd – Global Semiconductor Trade Reversal, ETFs Began Systematically Selling Low and Buying High
On July 1st, KOSPI fell 2.04%, and on July 2nd, it plunged a further 7.89%.
On July 2nd:
- SK Hynix fell 14.6%;
- Samsung Electronics fell 9.1%;
- Japan's Kioxia fell over 13.5%;
- U.S. semiconductor stocks also experienced a significant correction the night before.
The market began shifting from "current semiconductor profits are great" to questioning:
- Rumors about Meta selling computing power renewed worries about a computing power surplus;
- Whether U.S. cloud computing companies can sustain high-intensity AI capital expenditure;
- Whether massive data center construction is entering a marginal slowdown phase;
- Whether Samsung and SK Hynix's hundreds of billions in new capacity would create future oversupply;
- How long can the current memory price increases last;
- Whether the speed and duration of profit growth were already fully priced in.
The industry-level spark and market amplifier in this round must be distinguished.
The industry-level sparks were:
- Global semiconductor profit-taking;
- Doubts about the sustainability of AI capital expenditure;
- Possible peaking of memory price growth rates;
- New capacity plans potentially altering future supply-demand.
But what truly expanded the decline to nearly 8% was the market structure:
- Foreign investors selling chip heavyweight stocks;
- 2x ETFs forced to reduce exposure due to underlying declines;
- Market makers selling spot and futures simultaneously for hedging;
- Index decline widening, decreasing margin account collateral ratios;
- Risk models, stop-losses, and programmatic funds further reducing positions.
KOSPI rebounded 5.76% on July 3rd, similarly explainable by the reverse operation of the above mechanisms: retail buying the dip, short covering, ETFs re-adding positions.
Thus, this phase formed a typical pattern:
During declines, ETFs must sell; during rebounds, ETFs must buy. The market doesn't gradually converge; instead, up and down swings are both amplified.
The Korea Capital Market Institute also emphasized that not all volatility can be attributed to ETFs, as volatility in U.S. and Japanese memory stocks also surged significantly during the same period. Geopolitical tensions in the Middle East, inflation, and global interest rate uncertainty were equally important. ETFs were an amplifier, not the sole root cause.
Phase Five: July 6th to 8th – "Good News No Longer Boost Prices," Market Shift from Technical Correction to Concerns About Profit Sustainability
July 7th was the second key inflection point in sentiment.
Samsung Electronics' preliminary guidance showed Q2 operating profit might grow about 19 times year-over-year. Yet, on that day, Samsung Electronics still fell 6.9%, with intraday losses exceeding 10% at one point; SK Hynix fell 6.1%.
This indicated the market had entered a phase where "good news cannot push prices higher":
- Not because profits were bad;
- But because prior expectations were already too high;
- Investors began worrying current profits were the cycle peak;
- Good news was used to take profits, not to chase higher.
On that day, foreign investors net sold about 2.9 trillion won, while individual investors net bought about 3.2 trillion won. More alarmingly, KOSPI market credit financing balance was still about 29.7 trillion won, only slightly below the peak of 29.8 trillion won in late June.
In other words, the index had fallen about 16% from its high, but KOSPI credit financing debt had barely decreased.
Risk Began Spreading to Other Industries
On July 7th, it wasn't just semiconductors falling:
- LG Energy Solution expected Q2 operating profit to drop 77%, impacted by weak EV demand, its stock fell 6.4%;
- Hanwha Ocean fell 22.7% after Canada's submarine project chose a German proposal.
This showed the market began expanding from semiconductor product structure issues to:
- Battery industry profit slowdown;
- Uncertainty in defense and shipbuilding orders;
- Reduced risk budget for high-valuation growth stocks;
- More severe pricing of negative news for individual stocks.
Bear Market Officially Entered on July 8th
On July 8th, KOSPI fell 5.35%, a decline exceeding 20% relative to the June 22nd high.
That day, the U.S. Philadelphia Semiconductor Index had previously fallen 4.7%, with markets continuing to worry about AI investment sustainability, memory price growth slowdown, and profit peaking. The Korean Finance Minister began publicly stating they would closely monitor risks from single-stock leveraged ETFs.
A noteworthy detail: that day, after 13 consecutive days of selling, foreign investors made a small net purchase of about 335.9 billion won; meanwhile, the Korean won appreciated due to SK Hynix's U.S. fundraising-related dollar conversion demand.
This indicates this round cannot be simply explained by a single-line logic of "foreign withdrawal → won depreciation → stock decline." Cross-border corporate financing, currency hedging, and stock rebalancing may occur simultaneously, causing short-term divergence between stock and currency signals.
Phase Six: July 9th to 10th – Forced Liquidation Data Significantly Rose, Leverage Risk Spread to U.S. and Hong Kong
On July 9th, KOSPI rose slightly by 0.62%, but publicly reported actual forced liquidations reached about 142.197 billion won, the fourth-highest since such statistics began.
In 2026, there were 6 trading days with forced liquidations exceeding 100 billion won, 5 of which occurred after the launch of single-stock leveraged ETFs on May 27th. On July 9th, the total market credit financing balance was still about 36.63 trillion won, with KOSPI accounting for about 28.84 trillion and KOSDAQ about 7.80 trillion.
This reflects a clear lag in forced liquidations:
- Stocks fall first;
- Investors receive margin calls;
- Accounts fail to replenish promptly;
- Brokerages execute forced selling in the following days.
Therefore, one cannot just look at forced liquidation amounts on the crash day; the 5-day average and subsequent days are more important.
SK Hynix's U.S. Listing Opens New Cross-Market Leverage Channel
On July 10th, SK Hynix American Depositary Receipts (ADRs) began trading on Nasdaq, with a fundraising scale of about $26.5 billion. At least 10 fund management institutions submitted applications to issue single-stock leveraged or inverse ETFs around SK Hynix ADRs.
This meant risks from the same stock began transmitting across multiple time zones:
- Seoul underlying shares;
- Hong Kong 2x leveraged products;
- U.S. ADRs;
- U.S. single-stock leveraged ETFs;
- Korean spot and futures;
- Market maker cross-market hedging.
It should be noted: There is no public exchange data that can precisely prove how each cross-market arbitrage trade affected Seoul prices. But structurally, new listings and products would increase:
- Overnight price discovery;
- ADR vs. underlying share price arbitrage;
- Market maker hedging;
- Daily rebalancing of overseas products;
- Risk of gap openings at Seoul's next-day open.
Phase Seven: July 13th to 15th – Multiple Sell-Offs Synchronized, Then Pulled Back by Mechanical Rebound
July 13th was the most typical "waterfall deleveraging" of this round.
KOSPI fell 8.95%, closing at 6,806.93 points:
- SK Hynix fell 15.37%;
- Samsung Electronics fell about 10%;
- Foreign investors net sold about 1.7261 trillion won;
- Institutions net sold about 2.1964 trillion won;
- Individual investors conversely net bought about 3.8809 trillion won.
The sell-off that day was driven by a combination of factors:
- "Sell on news" after SK Hynix ADR listing;
- Foreign investors reallocating between ADRs and Korean shares;
- Continued market worries about the sustainability of U.S. tech companies' AI capex;
- Debate about memory cycle peating heating up;
- Renewed escalation of U.S.-Iran tensions;
- Rising oil prices and inflation expectations, hawkish global rate expectations.
Meanwhile, the Hong Kong-listed SK Hynix 2x leveraged ETF fell over 30% that day. ETF liquidation in the same direction further amplified declines in SK Hynix's underlying shares and KOSPI.
The sell-off structure on this day can be summarized as:
Foreign/Institutional Active Risk Reduction + Leveraged ETF Passive Exposure Reduction + Margin Account Margin Calls + Brokerage Forced Liquidation + Programmatic Stop-Loss = Waterfall Selling.
However, individual investors still net bought nearly 3.9 trillion won, so this was closer to a price and liquidity capitulation, not yet a full behavioral capitulation by retail investors.
July 14th Nears Lowest Intraday Point, But Balance Sheet Deleveraging Remained Limited
On July 14th, KOSPI hit an intraday low of 6,448.86 points, a maximum decline of about 29.25% relative to the June 22nd close; it closed up slightly by 0.73%.
Up to that point:
- Individual investors had net bought about 13.2 trillion won worth of KOSPI in July;
- They net bought 42.4 trillion won in June;
- KOSPI credit financing balance was about 28 trillion won;
- Compared to the peak of 29.8 trillion won on June 24th, it had fallen only about 6%.
So, even with an intraday index drop of nearly 30%, KOSPI margin debt had only reduced by about 6%.
July 15th's Surge Doesn't Prove Deleveraging is Over
On July 15th, KOSPI surged 6.24%:
- SK Hynix rose nearly 13%;
- Samsung Electronics rose nearly 8%;
- Semiconductor equipment company Hanmi Semiconductor rose about 25% at one point.
Driving factors included:
- U.S. inflation data came in lower than expected;
- U.S. tech sector rebound;
- Analysts reiterating structural shortage of AI memory;
- Market perception that recent selling partly stemmed from ETF position unwinding, not a collapse in semiconductor fundamentals.
Some industry views suggest current DRAM supply meets only about 75%-80% of demand, with the gap potentially widening further in 2027; meanwhile, another group of investors remained concerned about U.S. cloud vendor capex slowdown, new capacity, and future memory price growth deceleration.
Therefore, the July 15th rebound represented two things happening simultaneously:
- Re-emergence of the fundamental bullish narrative;
- Re-leveraging by 2x ETFs, short covering, and programmatic buying.
It resembled a mechanical re-leveraging bounce within the deleveraging process, not something that could be directly interpreted as the definitive bottom.
Phase Eight: July 16th – Regulation, Interest Rates, and Semiconductors Simultaneously Pressured, Deleveraging Began Institutionalizing
On July 16th, KOSPI fell 6.37%, closing at 6,820.60 points:
- Samsung Electronics fell 8.77%;
- SK Hynix fell 11.53%;
- Foreign investors net sold about 1.9288 trillion won;
- Institutions net sold about 3.0537 trillion won;
- Individual investors net bought about 4.7816 trillion won.
Industry performance showed clear divergence:
- Electrical & Electronics fell 9.43%;
- Manufacturing fell 7.51%;
- Machinery & Equipment fell 4.70%;
- Construction fell 3.30%;
- Telecommunications rose 3.39%;
- Food & Tobacco rose 2.12%;
- Paper & Wood rose 2.00%;
- Textiles & Apparel rose 1.01%.
This indicates the day wasn't an indiscriminate liquidity crash, but rather capital rotation from semiconductors, equipment, and high-beta growth sectors to defensive sectors.
Bank of Korea Raised Interest Rates
The Bank of Korea raised its benchmark interest rate from 2.50% to 2.75%, a 0.25 percentage point hike.
Reasons given by the central bank included:
- Strong export and investment growth;
- Semiconductor industry boom driving economic growth;
- June CPI reached 3.2%;
- Core inflation at 2.5%;
- Exchange rate and financial stability risks persist.
This rate hike wasn't specifically aimed at suppressing the stock market, but it would affect leverage through three channels:
- Increasing the opportunity cost of securities financing and other borrowed funds;
- Increasing the discount rate used for stock valuation;
- Reducing the ability and willingness of retail investors to continually borrow and buy the dip.
Financial Regulatory Policy Officially Shifted
On the same day, the Financial Services Commission announced restrictions on single-stock leveraged products.
Immediate implementation:
- Suspension of new listings of single-stock leveraged, inverse, and related products;
- Prohibition of advertising and active marketing by brokerages and asset managers.
Phased implementation from August:
- LP price deviation management standard tightened from 3% to 2%;
- Restrictions on new product business for LPs and asset managers with serious negligence;
- Investment education extended from 2 hours to 3 hours;
- Enhanced warnings on losses, long-term holding risks, and price deviations;
- Around August 5th, increase minimum base deposit from 10 million won to 30 million won;
- Around August 19th, disallow substitution of base deposit with assets like stocks, requiring 30 million won in cash.
Planned for November implementation:
- Minimum trading unit for domestic single-stock leveraged products raised from 1 unit to a tentative 20 units.
These policies have a dual impact on the market.
Long-term, they will:
- Reduce new leverage demand;
- Raise entry barriers;
- Decrease marketing stimulus;
- Improve ETF market price deviation;
- Limit unlimited expansion of product supply.
Short-term, they may also prompt investors unable to meet the new cash threshold to reduce positions early and reinforce the psychological expectation that "regulators will no longer provide policy support for leveraged rallies."
Therefore, July 16th marked the transition of deleveraging from a market-driven behavior to a regulatory-led, interest-rate-assisted institutionalized phase.
So, in terms of results:
KOSPI fell from 9,114.55 points on June 22nd to 6,820.60 points on July 16th, a cumulative decline of 25.17%;
The total market credit financing balance fell from a peak of about 38.63 trillion won on June 24th to about 34.37 trillion won, a decline of about 11%;
In other words, the price decline was about 2.3 times the decline in margin debt.
This indicates that this round first involved rapid price and product-level deleveraging, while debt deleveraging on investor balance sheets was slightly less.
IV. Overall Assessment
This wasn't a simple "semiconductor valuation correction." It was a negative feedback loop formed by the overlay of "foreign portfolio rebalancing, retail margin buying, single-stock leveraged ETF daily rebalancing, forced liquidations, industry expectation reversal, regulatory policy shift, and monetary policy tightening."
Leveraged ETFs weren't the initial spark, but they were a very important amplifier;
Margin financing wasn't the direct cause of each day's decline, but it determined whether declines could evolve into chain-reaction forced liquidations.
(As discussed in detail in early July regarding compressed deleveraging: When multiple layers of leverage express simultaneously, it causes all expressions to increase delta simultaneously during rallies; when reversed, all expressions decrease delta simultaneously, forming extreme symmetry between "consensus reinforcement" and "crowded stampede." Everyone adds positions in the same direction and will also reduce positions in the same direction. Liquidity appears ample but is actually extremely fragile. Once prices cannot continue rising, delayed counter-proofs erupt collectively.)
In essence, it wasn't about liquidity tightness or major fundamental problems.
It was simply an expectation flip. Once marginal buying disappeared, stock prices propped up by sentiment premiums were squeezed out, i.e., a correction; then leveraged funds were forced to reduce positions, creating a stampede.