Helium jumps 20%, but is this a real trend shift for HNT?

ambcryptoPubblicato 2026-02-16Pubblicato ultima volta 2026-02-16

Introduzione

Helium (HNT) surged over 20% to $1.36, rebounding sharply from a long-term descending regression channel low near $0.75. The price now tests the upper boundary of this channel around $1.50, a level where previous rallies have stalled. While technical indicators like MACD show strengthening bullish momentum and spot trading volume has expanded, underlying sell pressure remains. The 90-day Spot Taker CVD still reflects persistent selling dominance, creating a divergence with the rising price. Open Interest increased 22.83%, indicating new positions are being opened. The rally faces key resistance between $1.40–$1.80. A sustained break above could signal a trend reversal, but rejection at this level would reinforce the ongoing downtrend. The token is at a critical structural decision point.

Helium [HNT] has surged over 20% to $1.36, rebounding sharply from regression channel lows near $0.75 as buyers return aggressively.

Price now trades around $1.27 after reaching $1.40 intraday, marking its strongest upward reaction in months.

This rebound emerged precisely from the lower boundary of a descending regression trend channel that has guided the broader decline since mid-2025.

However, HNT now approaches the channel’s upper boundary, where previous rallies stalled.

At the same time, structural sell pressure still lingers beneath the surface, creating tension between price recovery and underlying flow.

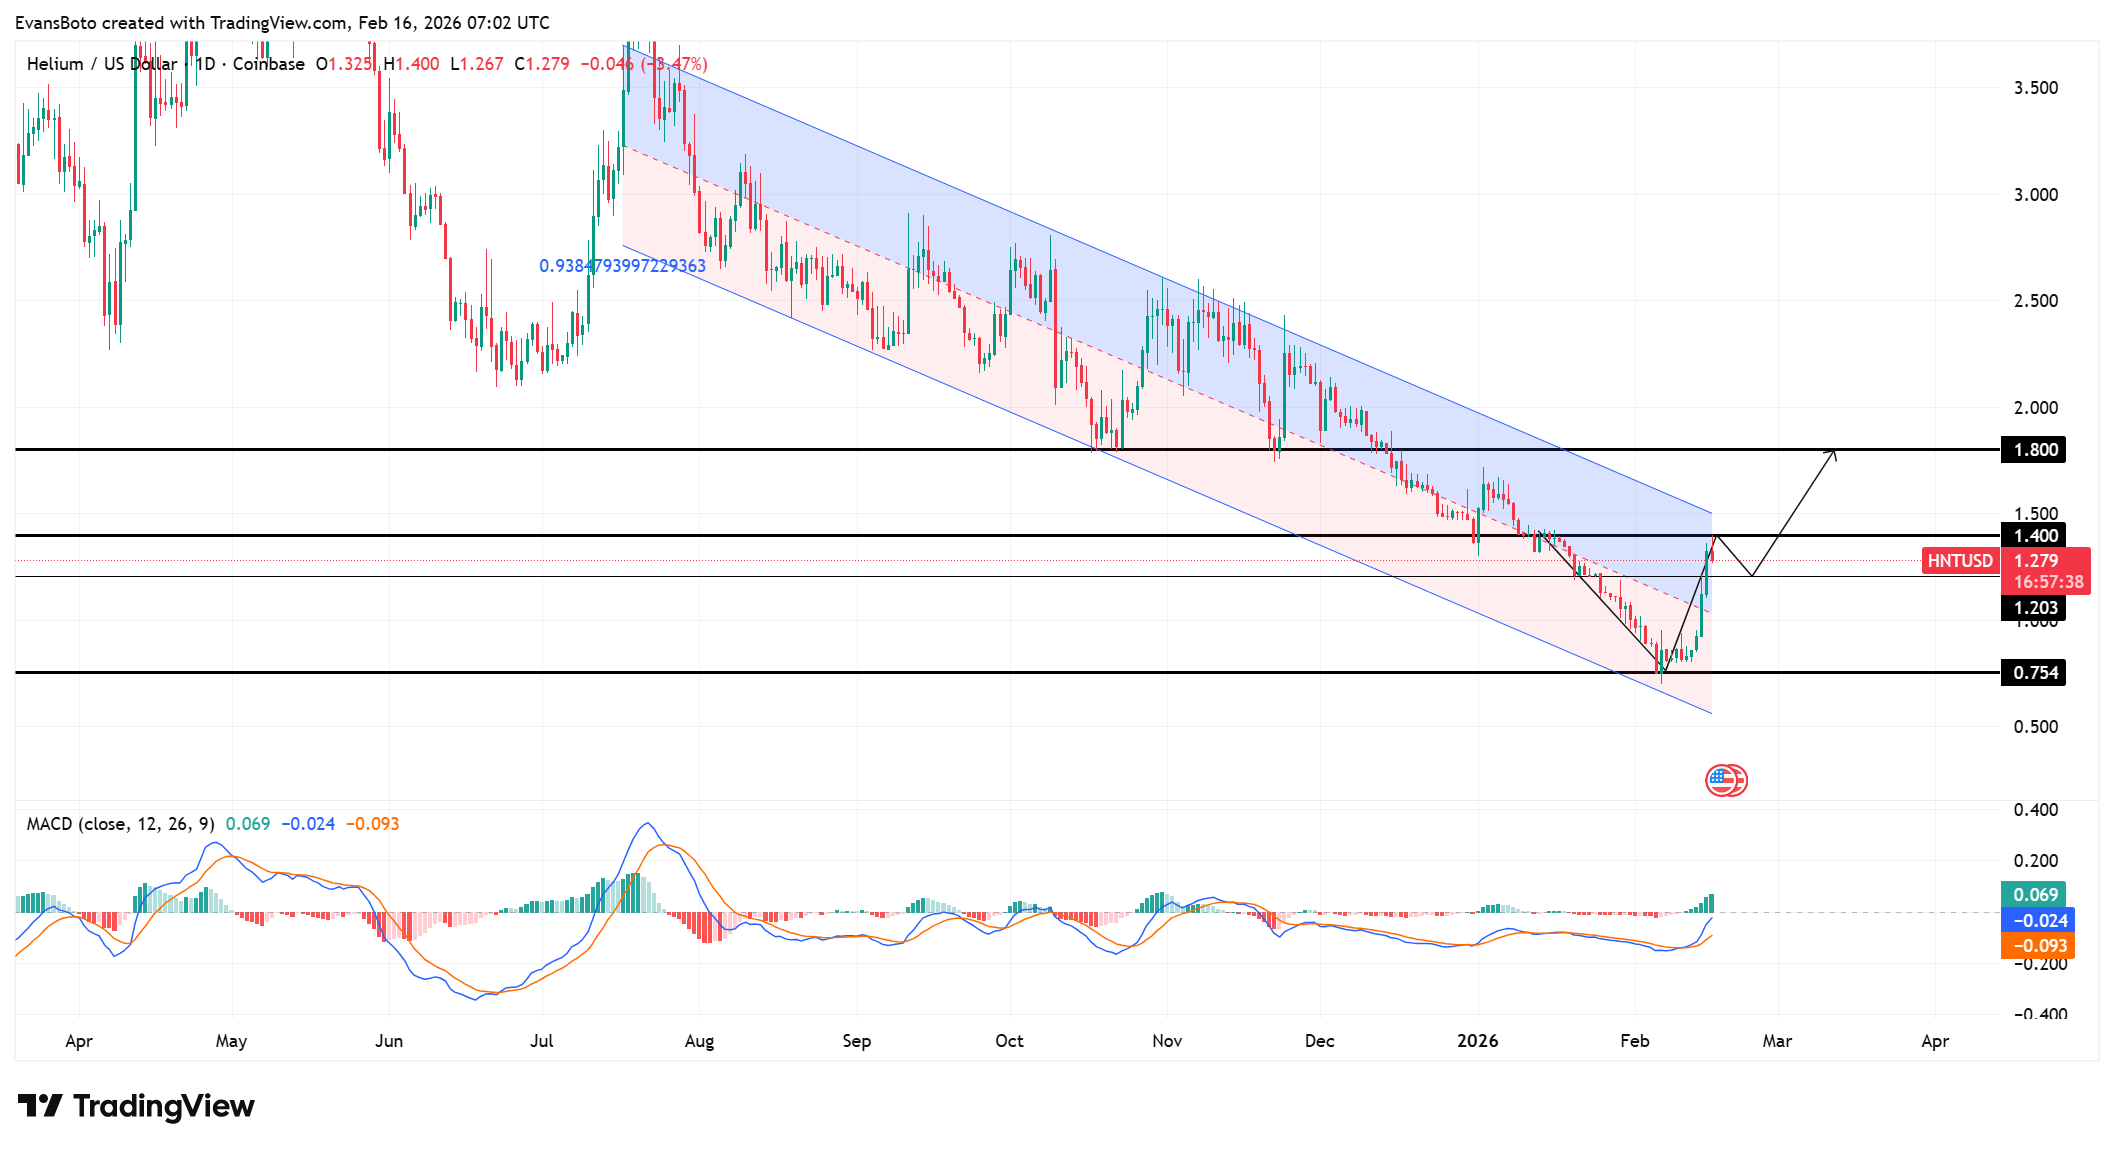
Helium tests upper regression channel

HNT has reclaimed the $1.20 level and pushed into the $1.40 supply zone, marking a decisive short-term shift in structure.

Price now sits near the upper boundary of a descending regression trend channel that has guided the broader decline for months.

This boundary aligns closely with the $1.50 region, while stronger horizontal resistance rests at $1.80. Therefore, price faces layered overhead pressure at a technically sensitive zone.

A sustained hold above $1.40 could open room toward $1.80. However, rejection near the channel ceiling would reinforce the prevailing downtrend.

At the same time, MACD prints 0.069, with the signal line at -0.024 and the histogram turning positive. Green bars are now expanding after prolonged compression, showing strengthening bullish energy.

However, the indicator still hovers near neutral territory. Buyers must maintain follow-through to validate this breakout attempt.

Sell pressure lingers beneath the rally

Despite the sharp rebound from $0.75, the 90-day Spot Taker CVD still reflects taker sell dominance.

This reading shows aggressive market sells continue to outweigh buys on a cumulative basis. This creates a divergence between rising price and persistent sell-side flow.

In other words, price climbs even while broader spot aggression favors sellers. Such divergence can weaken rallies if demand fails to absorb supply fully.

However, rapid technical rebounds sometimes unfold under similar conditions when short-term buyers overwhelm liquidity temporarily.

If spot buyers increase conviction, the CVD trend could stabilize and gradually shift. Until that shift appears clearly, the rally remains technically impressive yet structurally fragile.

Open Interest expansion reflects new positions

Open Interest has increased 22.83% to $4.40 million during this surge. That expansion signals traders are opening fresh positions rather than merely closing shorts.

If short covering drove this rally alone, Open Interest would likely decline. Instead, derivatives traders now position aggressively around current levels.

Rising Open Interest alongside advancing price can support continuation if buyers maintain control.

However, leverage also increases downside risk near resistance zones. Should price reject near $1.50 or $1.80, liquidation pressure could amplify volatility quickly.

Therefore, positioning has become sensitive to price behavior at the regression channel ceiling, where leverage could either fuel extension or accelerate reversal.

Rising participation, confirmed

The Spot Volume Bubble Map now shows heating clusters, reflecting expanding spot participation.

Larger bubbles correspond with heightened trading activity during this rebound phase. Increased engagement supports the move from $0.75 toward the $1.40 region.

Rising participation often strengthens breakout attempts because it reflects genuine liquidity rotation.

However, continuation requires sustained activity above reclaimed resistance. If volume contracts sharply near the $1.50 boundary, buying enthusiasm could fade rapidly.

On the other hand, persistent bubble expansion beyond the regression ceiling would validate structural repair more convincingly.

Therefore, liquidity flow now plays a decisive role in determining whether Helium builds on this surge or stalls beneath overhead supply.

Relief bounce or structural shift?

Helium has delivered a powerful rebound from channel lows and now challenges the upper boundary of its regression trend structure.

Technical indicators show rebuilding strength, and participation has expanded. However, structural sell pressure and overhead resistance still dominate the broader picture.

If price sustains strength above $1.40 and pushes toward $1.80 with expanding participation, recovery could gain traction.

Yet rejection at the channel ceiling would reaffirm the prevailing downtrend. Helium now stands at a clear structural decision point.


Final Summary

  • Helium rebounded over 20% from $0.75 channel lows to test the $1.40–$1.50 resistance zone, signaling a strong short-term structural recovery.
  • However, persistent sell-side flow, rising Open Interest, and overhead channel resistance suggest the rally remains fragile.

Domande pertinenti

QWhat was the percentage surge in Helium (HNT) and what price level did it rebound from?

AHelium (HNT) surged over 20%, rebounding sharply from regression channel lows near $0.75.

QWhat key technical indicator is showing strengthening bullish energy, and what is its current value?

AThe MACD indicator is showing strengthening bullish energy. It currently prints a value of 0.069, with the signal line at -0.024 and the histogram turning positive with expanding green bars.

QDespite the price increase, what does the 90-day Spot Taker CVD reading indicate about market activity?

AThe 90-day Spot Taker CVD reading indicates that aggressive market sells continue to outweigh buys on a cumulative basis, reflecting persistent taker sell dominance beneath the surface.

QHow did Open Interest change during the price surge, and what does this signal about trader behavior?

AOpen Interest increased by 22.83% to $4.40 million. This expansion signals that traders are opening fresh new positions rather than merely closing out short positions.

QWhat are the two critical price levels that will determine if this is a relief bounce or a structural shift for HNT?

AThe two critical levels are $1.40 and $1.80. A sustained hold above $1.40 could open room toward $1.80, validating a recovery. However, rejection at the channel ceiling near $1.50 would reaffirm the prevailing downtrend.

Letture associate

When AI Traffic Surpasses Humans, How Do You Prove You're Human?

As AI-generated web traffic now surpasses human activity, the internet's foundational business models—built on human attention, browsing, and advertising—face severe disruption. AI agents crawl websites at immense scale without generating ad revenue, while AI summaries divert traffic from original content sites. In response, over 2.5 million sites are blocking AI crawlers, and protections like Cloudflare's "honeypot" traps have emerged, though advanced AI can bypass these. The collapse of traditional CAPTCHAs, which assumed machines were weaker than humans, has led to a shift toward behavioral biometrics for human verification. Companies like IBM and BioCatch now analyze unique human patterns—cursor movements, typing rhythms, keystroke dynamics, and even cognitive delays like the Stroop effect—to distinguish real users from bots. These biometric signatures are difficult to fake or alter, offering a new layer of security but raising significant privacy concerns. Two competing visions for a reliable human verification system are emerging. One, exemplified by Sam Altman’s World (formerly Worldcoin), uses centralized iris scanning to generate unique credentials, though it faces bans and criticism over unauthorized data collection. The other employs cryptographic zero-knowledge proofs, allowing users to prove they are human without revealing identity or biometric data, as advocated by Vitalik Buterin. However, decentralized approaches risk exploitation through identity renting in economically unequal regions. The central dilemma is between a scalable but privacy-invasive centralized system that permanently controls users' biometric data, and a privacy-preserving cryptographic system vulnerable to real-world economic manipulation. The author expresses a preference for the cryptographic path, arguing that despite its flaws, it avoids the irreversible biometric surveillance inherent in centralized alternatives.

Foresight News5 min fa

When AI Traffic Surpasses Humans, How Do You Prove You're Human?

Foresight News5 min fa

Crypto Primary Market Investment and Financing Forward-Looking Weekly Report | Stablecoin Regulation Nears Implementation, ETF Funds Continue to Withdraw, Capital Begins Betting on Payment and Cash Flow

Crypto Market Weekly Report (Jun 1-7, 2026): Capital Shifts Focus to Payments & Cash Flow Market data indicates a significant divergence: while traditional institutional funds continue exiting via BTC and ETH ETFs (recording net outflows of $1.72B and $168M this week, respectively), stablecoin supply continues growing. This suggests capital is shifting from speculative asset allocation toward defensive positioning within on-chain liquidity, awaiting new, concrete opportunities. This trend is reflected in venture capital focus. Weekly fundraising fell 27% to $302M, with investments concentrating on infrastructure with tangible revenue potential: 1. **Stablecoin Infrastructure (28% of funding):** Projects like M0 Protocol ($35M raise) are gaining attention as regulatory clarity (e.g., the GENIUS Act) nears, shifting the focus from legitimacy to building payment and settlement networks. 2. **AI Agent Infrastructure (26%):** Investments are moving from conceptual AI Agents towards the execution and economic layers required for a functional "Agent economy." Key raises include OpenRouter ($40M) and Halliday ($20M). 3. **Real World Assets (RWA) (18%):** The search for on-chain yield and cash flow drives continued interest in RWA platforms like Ondo Finance. Security threats are evolving from smart contract exploits toward key management failures, permission control issues, and regulatory execution risks (e.g., court-ordered asset freezes). **Key Takeaways:** The investment thesis is shifting from narrative-driven bets to revenue and cash-flow-generating protocols. Future attention should be on the progression of stablecoin regulations, the commercial validation of AI Agent economies, and the performance of high-revenue protocols like derivatives platforms.

marsbit12 min fa

Crypto Primary Market Investment and Financing Forward-Looking Weekly Report | Stablecoin Regulation Nears Implementation, ETF Funds Continue to Withdraw, Capital Begins Betting on Payment and Cash Flow

marsbit12 min fa

Buy an NFT First to Get a Ticket? The Largest World Cup Ticket Slump in History

"Ticketing Woes for 2026 World Cup: NFT 'Right-to-Buy' and High Prices Dampen Sales" Despite anticipation for the 2026 FIFA World Cup, with 48 teams and 104 matches across North America, the tournament faces significant unsold tickets, with approximately 180,000 group-stage tickets still available for resale just before kick-off. This unexpected shortfall is attributed to FIFA's controversial new ticketing strategy, which includes an NFT-based "Right-to-Buy" (RTB) system and opaque, dynamic pricing. FIFA introduced RTBs as digital collectibles (NFTs) sold on its FIFA Collect platform. An RTB grants the holder only the right to purchase a ticket for a specific match later, not the ticket itself. This two-step process, criticized for selling "scarcity" first, saw RTBs priced from tens to hundreds of dollars, generating millions in revenue for FIFA. With many tickets remaining available on official channels, the value of these prepaid purchase rights is now being questioned. Compounding the issue are ticket prices, reported to be 2 to 4 times higher than the 2022 Qatar World Cup, and up to 7 times more for marquee matches. FIFA employed dynamic pricing, common in U.S. sports, but lacked transparency on seat availability and exact locations during sales, frustrating global fans facing high travel costs. This has drawn scrutiny from regulators in New York and New Jersey. FIFA's official resale platform also drew criticism for imposing high fees—roughly 10% on sellers and 17% on buyers, allowing FIFA to profit further from secondary market transactions. While FIFA President Gianni Infantino states over 6 million tickets have been sold, the situation highlights a potential disconnect between fan enthusiasm and willingness to pay under an aggressive commercial model.

marsbit20 min fa

Buy an NFT First to Get a Ticket? The Largest World Cup Ticket Slump in History

marsbit20 min fa

Trading

Spot
Futures
活动图片