HBAR Consolidates Near Lows While Analysts Map Potential Short-Term Bounce Scenarios

bitcoinistPubblicato 2025-12-17Pubblicato ultima volta 2025-12-17

Introduzione

Hedera's HBAR token is trading near its lowest levels in over a year, reflecting both broader crypto market weakness and project-specific challenges. After a steady decline, HBAR has entered a tight consolidation range, with traders debating whether this pause signals a potential short-term rebound or a continuation of the downtrend. The token recently fell to the $0.11–$0.12 range after failing to hold above the $0.125 support level. Market structure is bearish, with HBAR trading below key moving averages and momentum indicators like RSI and MACD pointing lower. Volume patterns show active trading around key levels, with resistance near $0.119–$0.122 and immediate support at $0.112–$0.113. A break above resistance could signal a move toward $0.13, while a breakdown might lead to a retest of the psychological $0.10 level. Analysts are divided: some see oversold conditions and potential for a bounce to the mid-$0.12 to $0.14 range, while others remain cautious due to slowing ecosystem growth and weak demand for Hedera-linked investment products.

Hedera’s HBAR token is trading near its lowest levels in more than a year, reflecting both broader crypto market weakness and project-specific headwinds.

After a steady decline through November and December, HBAR has slipped into a tight consolidation range, with traders debating whether the current pause marks a base for a short-term rebound or a continuation of the downtrend.

Recent price action indicates growing activity around key technical levels, despite mixed fundamental indicators.

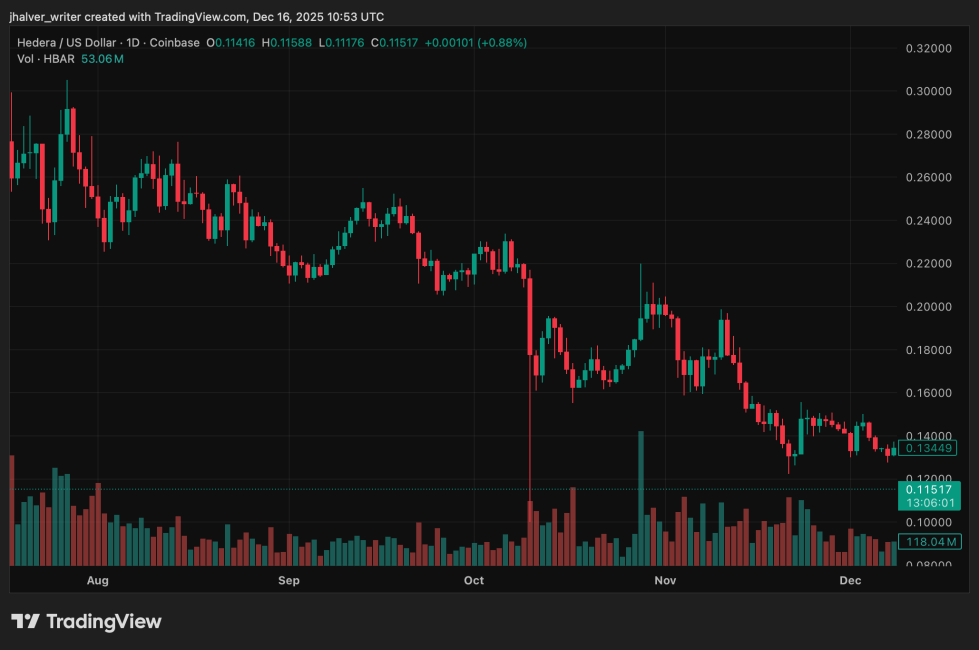
HBAR's price trends to the downside on the daily chart. Source: HBARUSD chart on Tradingview

HBAR Slides to Multi-Month Lows as Selling Pressure Builds

HBAR fell to around $0.11–$0.12 this week after failing to hold above the $0.125 support zone, a level that had acted as a floor several times earlier in the year. The drop coincided with a wider market pullback, as Bitcoin and major altcoins weakened ahead of global macro events, including Senate decisions in the U.S.

Trading data shows that volume surged sharply during attempts to reclaim resistance near $0.119–$0.120, suggesting active distribution rather than sustained accumulation.

Market structure has turned decisively bearish over recent sessions. HBAR is now trading below key moving averages, and momentum indicators such as RSI and MACD continue to point lower.

On-chain and ecosystem data have also weighed on sentiment, with Hedera’s total value locked declining significantly from earlier highs and stablecoin supply on the network shrinking over recent months.

Volume Spikes Show Key Support and Resistance Zones

Despite the broader downtrend, recent volume patterns have drawn attention from short-term traders. During one session, HBAR volume jumped more than 80% above its daily average as the price tested resistance near $0.119.

The rejection triggered another wave of selling, but late-session activity showed renewed buying interest as the price approached the $0.112–$0.113 area. This zone is now viewed as immediate support, with a deeper psychological level around $0.10 acting as the next downside reference if selling resumes.

On the upside, analysts are watching $0.119–$0.122 as a critical resistance band. A clean break above this range would be needed to shift short-term structure and open the door for a move toward prior highs near $0.13.

Analysts Split Between Oversold Bounce and Further Downside Risk

Some technical analysts argue that HBAR is approaching oversold conditions, noting weakening bearish momentum and signs of trendline breaks on lower timeframes. These signals have fueled short-term bounce scenarios targeting the mid-$0.12 to $0.14 range, provided support continues to hold.

Others remain cautious, pointing to stalled demand for recent Hedera-linked investment products and slowing ecosystem growth. From this view, failure to defend current levels could expose HBAR to a retest of $0.10, a level last seen during earlier liquidation events.

Cover image from ChatGPT, HBARUSD chart from Tradingview

Letture associate

US Stocks Hit Record Highs: Why Isn't the Market Afraid of the Flames of War?

U.S. stocks hit a record high on April 15, with the S&P 500 closing at 7,022.95, just 77 days after its previous peak. This rebound occurred in only 11 trading days—far faster than recoveries following past crises like the COVID-19 pandemic (103 days) or the 2011 debt crisis (106 days). The market's rapid recovery is attributed to "ceasefire expectations" rather than deteriorating economic fundamentals. During the sell-off triggered by the U.S.-Israel military action against Iran in late February, the S&P 500 fell nearly 10%. However, the market rallied twice on ceasefire rumors—first on March 24 and again on April 8—even before any permanent peace deal was signed. Notably, the VIX fear index fell below pre-war levels, indicating that the market had repriced the conflict from an uncertainty to a calculable risk. Major financial institutions like JPMorgan reported record trading revenues of $11.6 billion in Q1 2026, largely driven by volatility in commodities and emerging markets. Hedge funds turned net long for the first time since late 2025, while margin debt hit a record $1.28 trillion. This reflects a financial system that commercializes volatility, treating geopolitical shocks as tradable opportunities rather than systemic threats. However, the current optimism relies on assumptions of a sustained ceasefire and stable oil prices, leaving the market vulnerable if these conditions change.

marsbit6 min fa

US Stocks Hit Record Highs: Why Isn't the Market Afraid of the Flames of War?

marsbit6 min fa

Is the Rebound an Illusion? The Bond Market Has Already Given the Answer

Is the stock market's rapid rebound to pre-war levels a sign of recovery or a misleading rally driven by momentum rather than fundamentals? While the S&P 500 has fully recovered its losses from the U.S.-Iran conflict and nears all-time highs, bond and oil markets tell a different story. Key data reveals contradictions: 10-year Treasury yields have risen 30 basis points, signaling persistent inflation concerns and constrained Fed policy space. WTI crude is up 37%, indicating that geopolitical risks are not priced to resolve soon. The 2-year Treasury yield, a sensitive gauge of rate expectations, has increased nearly 40 bps, challenging the narrative of imminent Fed rate cuts. The equity market appears to be pricing in a "perfect scenario": subdued oil impact on consumption, Fed rate cuts despite hot inflation, stable corporate margins, and near-term conflict resolution. However, bonds and oil reflect a reality of sticky inflation, limited Fed flexibility, and ongoing geopolitical tension. This divergence suggests the rally may be momentum-driven rather than fundamentally justified. If upcoming CPI data exceeds expectations (e.g., above 3.5%), the 2026 rate-cut narrative could collapse. Investors chasing the rally are betting on an ideal outcome—swift conflict resolution, controlled inflation, Fed easing, and resilient earnings—while ignoring signals from more cautious asset classes. The gap will likely close either through a fundamental improvement validating stocks or a market correction aligning with bond and oil realities.

marsbit14 min fa

Is the Rebound an Illusion? The Bond Market Has Already Given the Answer

marsbit14 min fa

From Theory to Countdown: Google Sounds the Blockchain Quantum Resistance Alarm with Zero-Knowledge Proofs

An article discusses the significant threat quantum computing poses to blockchain and classical encryption systems, triggered by Google's recent research. By optimizing Shor's algorithm, Google reduced the logical qubits required to break 256-bit elliptic curve encryption from around 6,000 to just 1,200—slashing computational costs by 20 times. This advancement sets a potential countdown, with Google estimating 2029 as the deadline for upgrading to quantum-resistant cryptography. Both Bitcoin and Ethereum face severe risks. About 25-35% of Bitcoin addresses have exposed public keys, making them vulnerable to attacks, especially during transaction processing. Ethereum’s design exposes public keys upon first use, jeopardizing its entire network if signatures aren’t updated. Historical blockchain data remains permanently available for future quantum attacks. The solution lies in adopting post-quantum cryptography (PQC). Ethereum is already implementing account abstraction and PQC-based signatures, leveraging its upgradeable architecture. Bitcoin is considering BIP-360 to introduce quantum-resistant algorithms like FALCON or CRYSTALS-Dilithium, though consensus may delay action. Notably, Google used zero-knowledge proofs to disclose this threat responsibly, aiming to prevent panic. Collaboration with Ethereum Foundation researchers suggests抗量子 (quantum resistance) could become a major narrative, aligning with crypto’s cryptographic roots.

marsbit41 min fa

From Theory to Countdown: Google Sounds the Blockchain Quantum Resistance Alarm with Zero-Knowledge Proofs

marsbit41 min fa

Trading

Spot
Futures

Articoli Popolari

Come comprare HBAR

Benvenuto in HTX.com! Abbiamo reso l'acquisto di Hedera Hashgraph (HBAR) semplice e conveniente. Segui la nostra guida passo passo per intraprendere il tuo viaggio nel mondo delle criptovalute.Step 1: Crea il tuo Account HTXUsa la tua email o numero di telefono per registrarti il tuo account gratuito su HTX. Vivi un'esperienza facile e sblocca tutte le funzionalità,Crea il mio accountStep 2: Vai in Acquista crypto e seleziona il tuo metodo di pagamentoCarta di credito/debito: utilizza la tua Visa o Mastercard per acquistare immediatamente Hedera HashgraphHBAR.Bilancio: Usa i fondi dal bilancio del tuo account HTX per fare trading senza problemi.Terze parti: abbiamo aggiunto metodi di pagamento molto utilizzati come Google Pay e Apple Pay per maggiore comodità.P2P: Fai trading direttamente con altri utenti HTX.Over-the-Counter (OTC): Offriamo servizi su misura e tassi di cambio competitivi per i trader.Step 3: Conserva Hedera Hashgraph (HBAR)Dopo aver acquistato Hedera Hashgraph (HBAR), conserva nel tuo account HTX. In alternativa, puoi inviare tramite trasferimento blockchain o scambiare per altre criptovalute.Step 4: Scambia Hedera Hashgraph (HBAR)Scambia facilmente Hedera Hashgraph (HBAR) nel mercato spot di HTX. Accedi al tuo account, seleziona la tua coppia di trading, esegui le tue operazioni e monitora in tempo reale. Offriamo un'esperienza user-friendly sia per chi ha appena iniziato che per i trader più esperti.

291 Totale visualizzazioniPubblicato il 2024.12.11Aggiornato il 2025.03.21

Come comprare HBAR

Discussioni

Benvenuto nella Community HTX. Qui puoi rimanere informato sugli ultimi sviluppi della piattaforma e accedere ad approfondimenti esperti sul mercato. Le opinioni degli utenti sul prezzo di HBAR HBAR sono presentate come di seguito.

活动图片