Author: Zach Pandl (Head of Research, Grayscale)
Compiled by: Deep Chao TechFlow
Deep Chao Guide: Bitcoin fell below $60,000 this week, hitting a new low for this cycle. From the October peak of $125,000, it has now halved. Grayscale's Head of Research Zach Pandl puts this pullback into historical context, viewing it as another cyclical correction within a long-term uptrend, not a trend reversal. He outlines two scenarios for exiting the bear market: under an optimistic scenario, Bitcoin may already be nearing its bottom; under a pessimistic scenario, it could fall further. The key variables in this judgment are whether the Fed raises interest rates and whether the CLARITY Act can pass the Senate. This is a research report perspective, intended to aid holders in their directional judgment.
This week, Bitcoin fell below $60,000, setting a new low for this cycle. From the October peak of $125,000, Bitcoin has now dropped over 50%. In our view, this pullback is another periodic correction within Bitcoin's long-term uptrend (Chart 1).
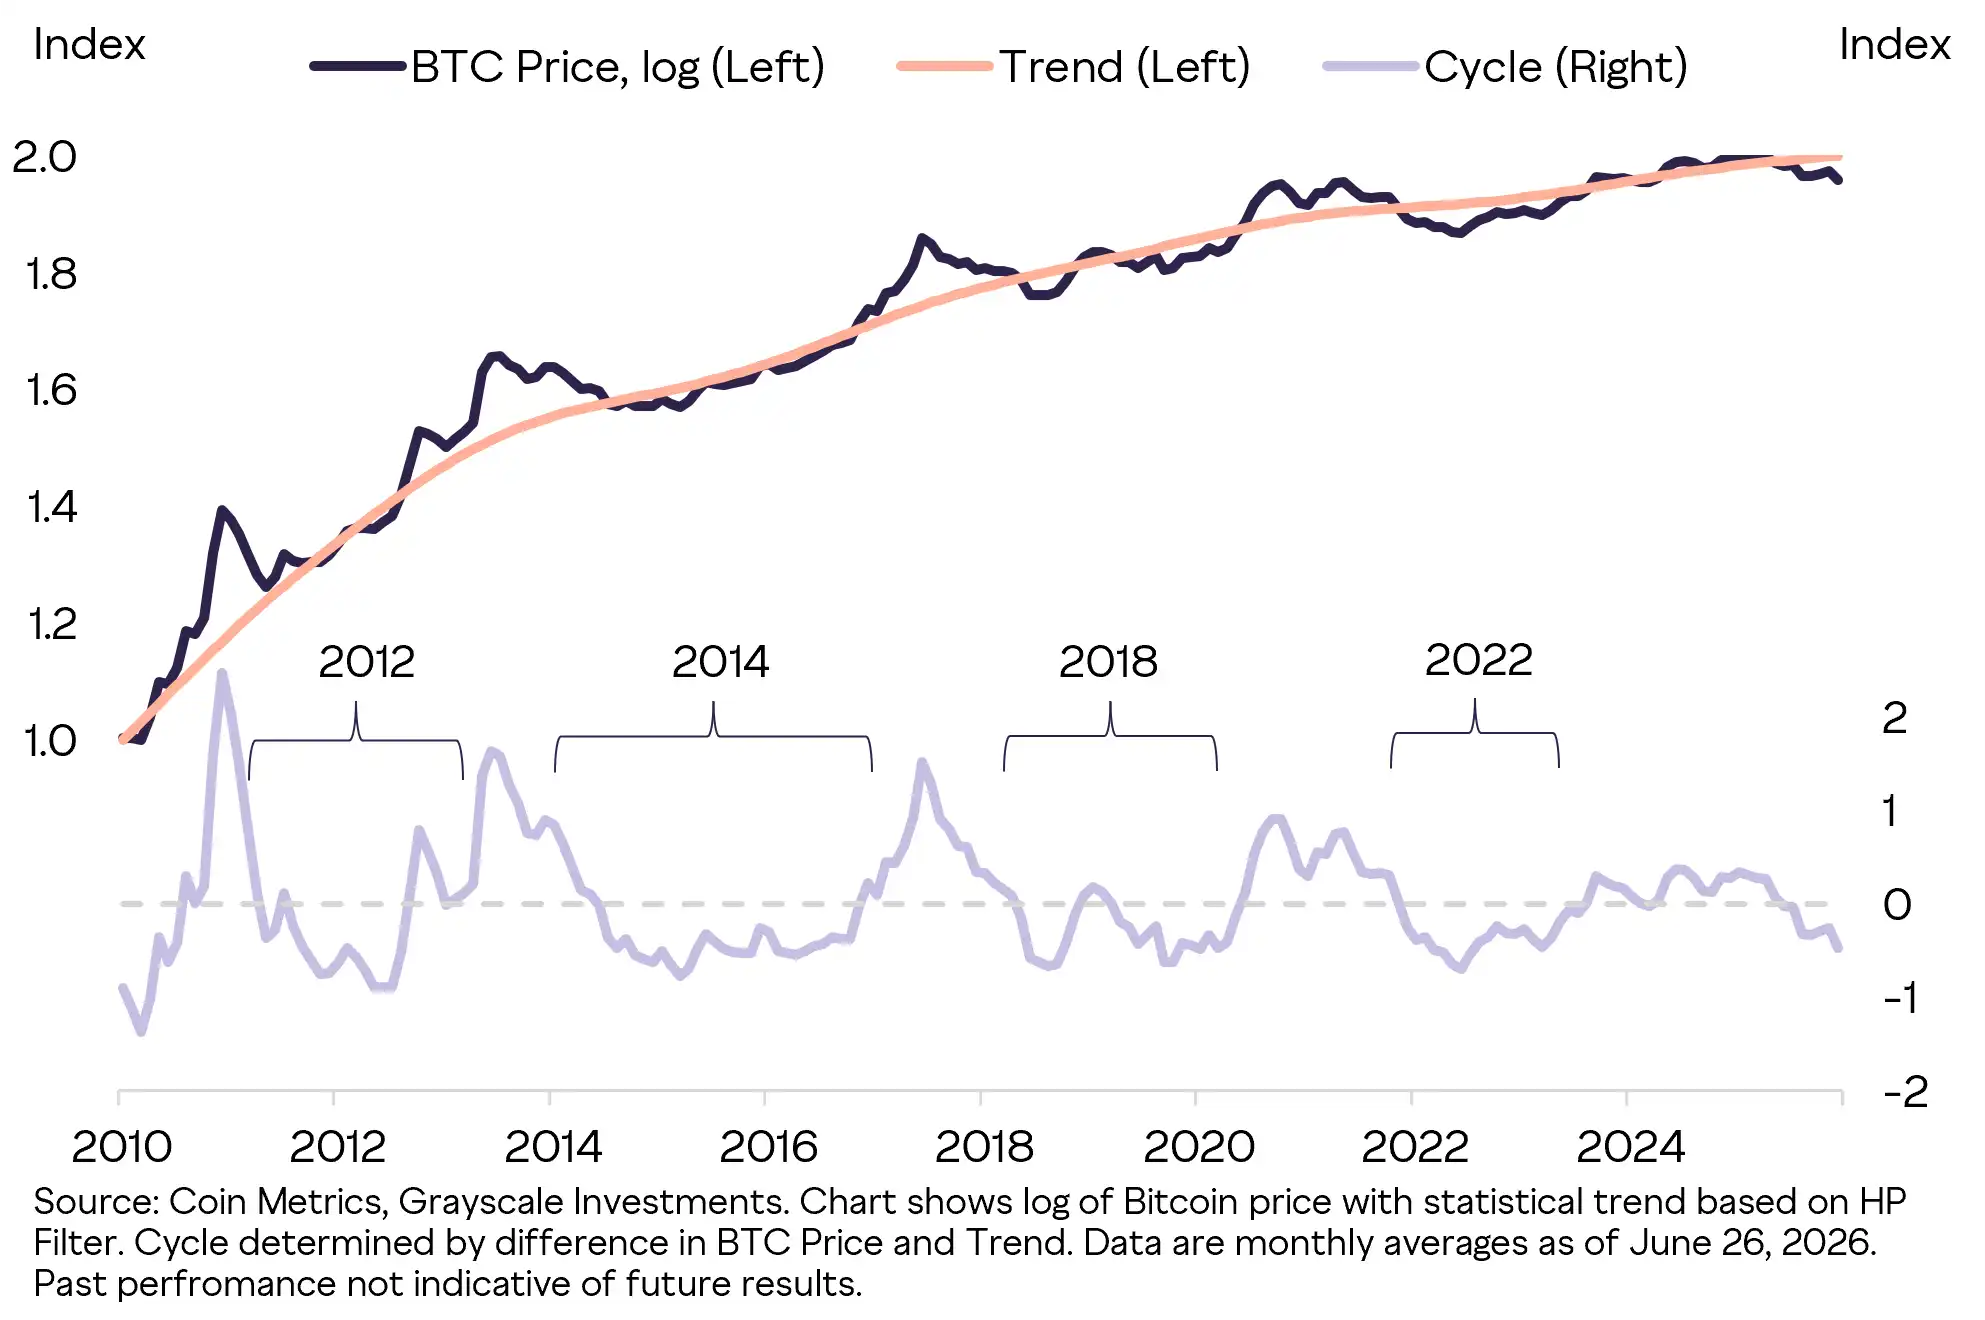
Chart 1: Bitcoin's pullback is just another cycle in the uptrend. The dark line is the Bitcoin price (logarithmic, left axis), the orange line is the statistical trend line based on an HP filter, and the light purple line is the cyclical deviation of the price from the trend (right axis). The cyclical lows from years 2012, 2014, 2018, and 2022 are marked, showing the current cyclical deviation has once again fallen below the zero line.
Source: Coin Metrics, Grayscale Investments, monthly averages through June 26, 2026. Past performance is not indicative of future results.
Several factors have suppressed Bitcoin's price in recent months. The most critical is the shift in market expectations for Fed policy, directly impacting the "money debasement trade" thesis. Late last year, prediction markets widely anticipated Trump would nominate the relatively dovish Kevin Hasset as Fed Chair. Instead, he nominated the relatively hawkish Kevin Warsh, who officially took office this month. Due to persistent inflation, markets now expect the Fed to hike rates this year, not cut (Chart 2). The spot price of gold, also competing with fiat currencies (like the US dollar), has fallen about 25% from its peak; after volatility adjustment, the decline is similar to Bitcoin's.1
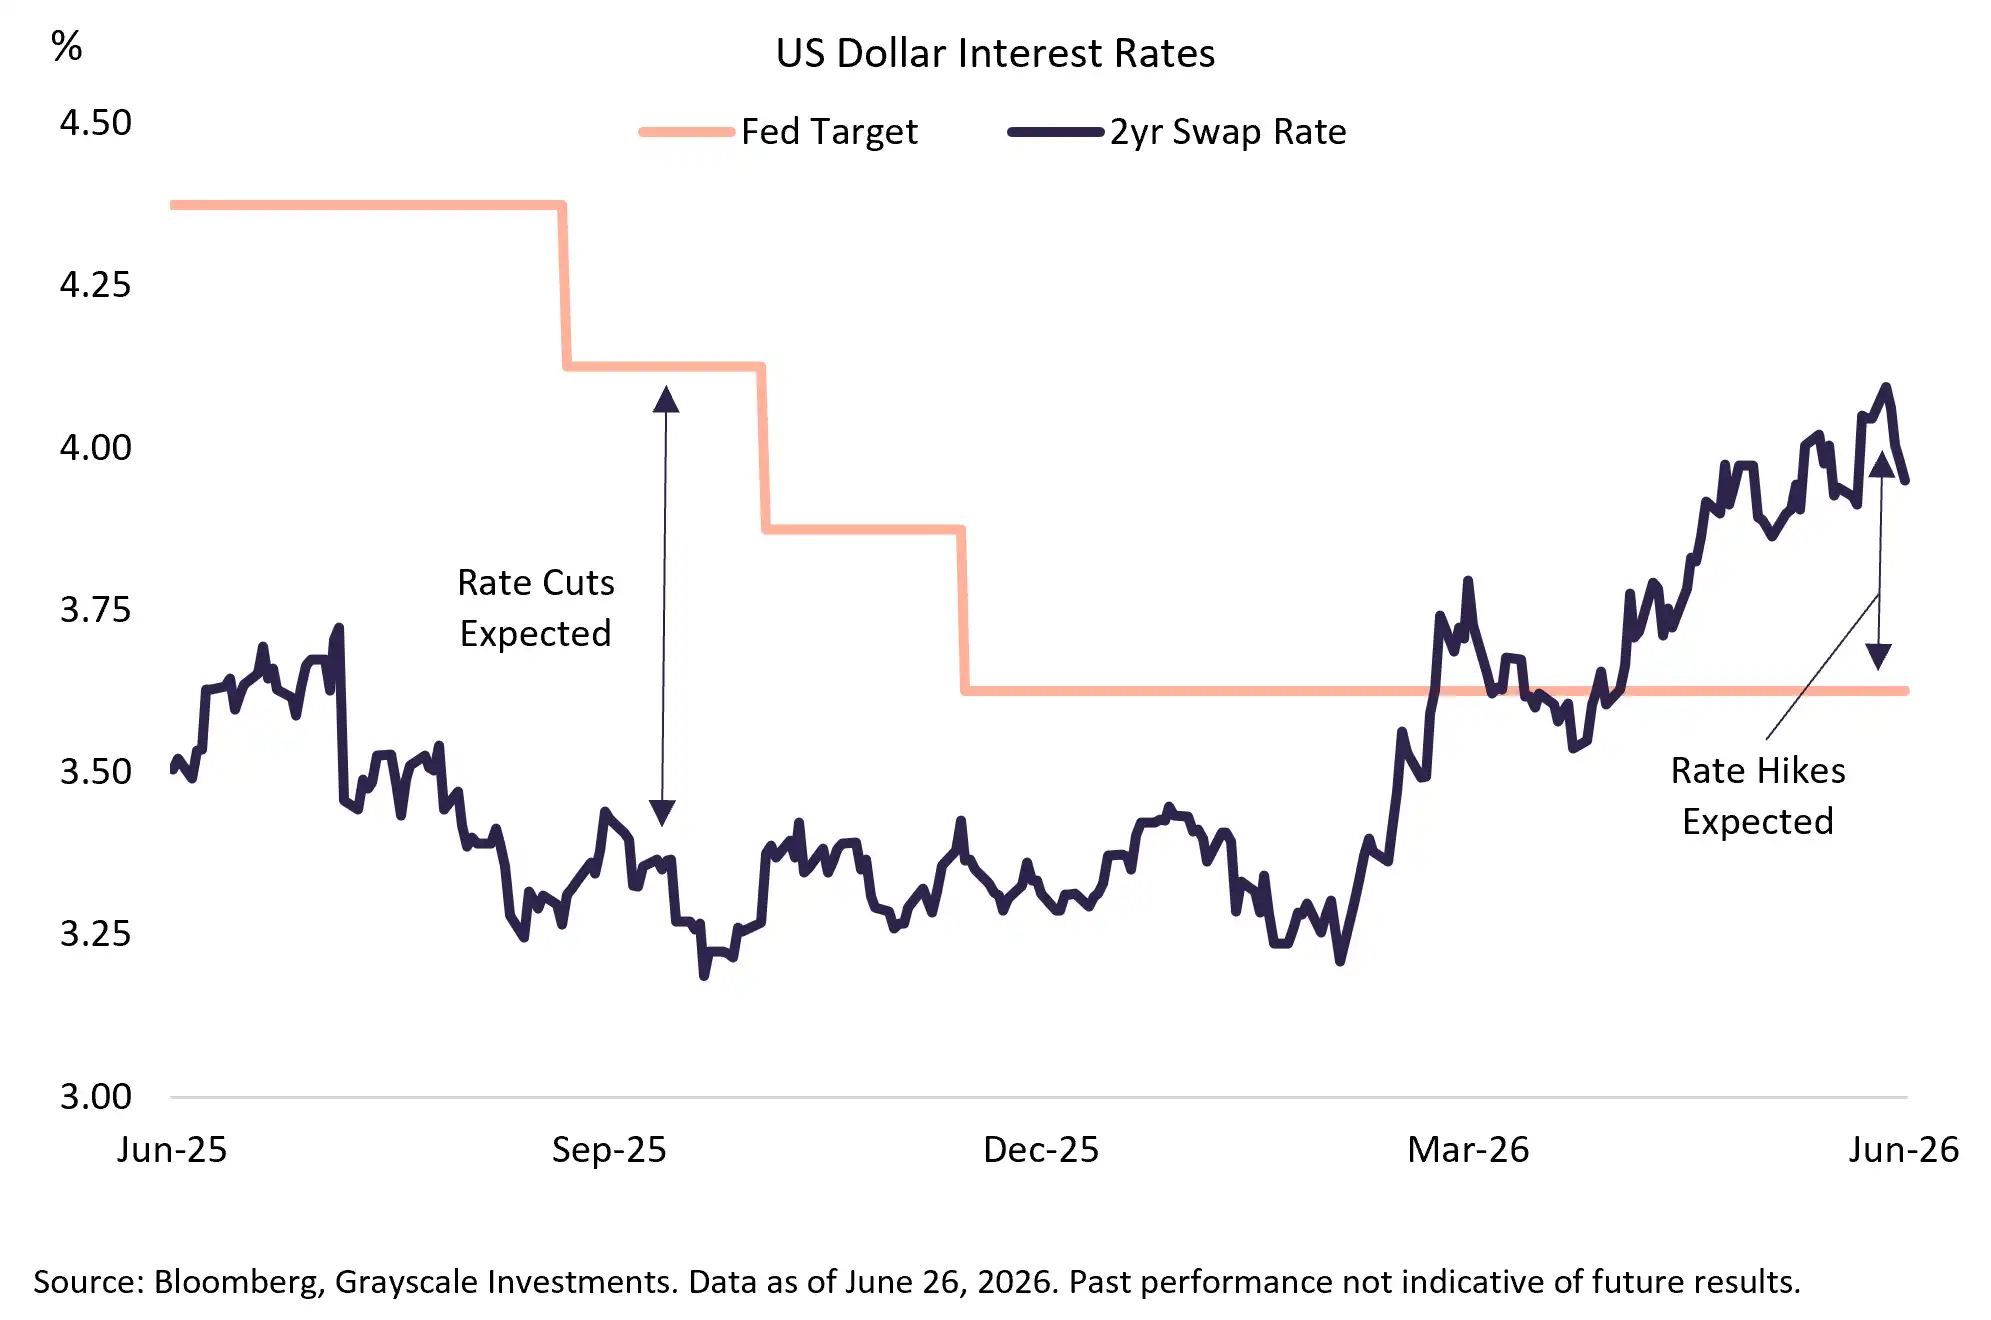
Chart 2: Markets now expect the Warsh-led Fed to hike rates. The orange line is the Fed target rate, the dark line is the 2-year swap rate. In the left half, swap rates were below the target rate (markets expecting cuts); after March 2026, swap rates surpassed the target rate and continued rising (markets expecting hikes).
Source: Bloomberg, Grayscale Investments, through June 26, 2026. Past performance is not indicative of future results.
Beyond the Fed's pivot, the crypto market is currently grappling with three other issues: uncertainty around the passage of the CLARITY Act; pressure on Strategy's leveraged balance sheet; and investor concerns about digital asset security risks from quantum computing.
Meanwhile, improving regulatory conditions continue to drive institutional adoption of public blockchain technology. We believe this is the most important structural trend for the digital asset market. Just this month, the CFTC approved the first perpetual futures contracts in the US, and the growth of stablecoins and tokenized assets will support many leading public chains. The broader social and political underpinnings for crypto assets also remain: unchecked expansion of government debt, declining public trust in intermediaries, and the rise of AI. AI may spur demand for alternative payment systems and technologies that safeguard human sovereignty.
Broadly, we see two paths for Bitcoin to exit this bear market (Chart 3). The base case scenario is: the CLARITY Act passes the Senate, Strategy takes measures to shore up its balance sheet, and the Fed refrains from raising rates. If upcoming developments move in this direction, Bitcoin's price may already be near a bottom. The downside scenario is: the CLARITY Act fails to pass this year, Strategy and other DATs (Digital Asset Treasury companies) further deleverage, and the Fed is forced to hike due to persistent inflation. If downside risks materialize, Bitcoin could still see a moderate decline. Historically, Bitcoin has fallen about 80% in several cycles, but we do not expect such a deep drawdown from peak to trough this cycle, due to the relatively restrained nature of this bull run and stickier institutional demand for digital assets.
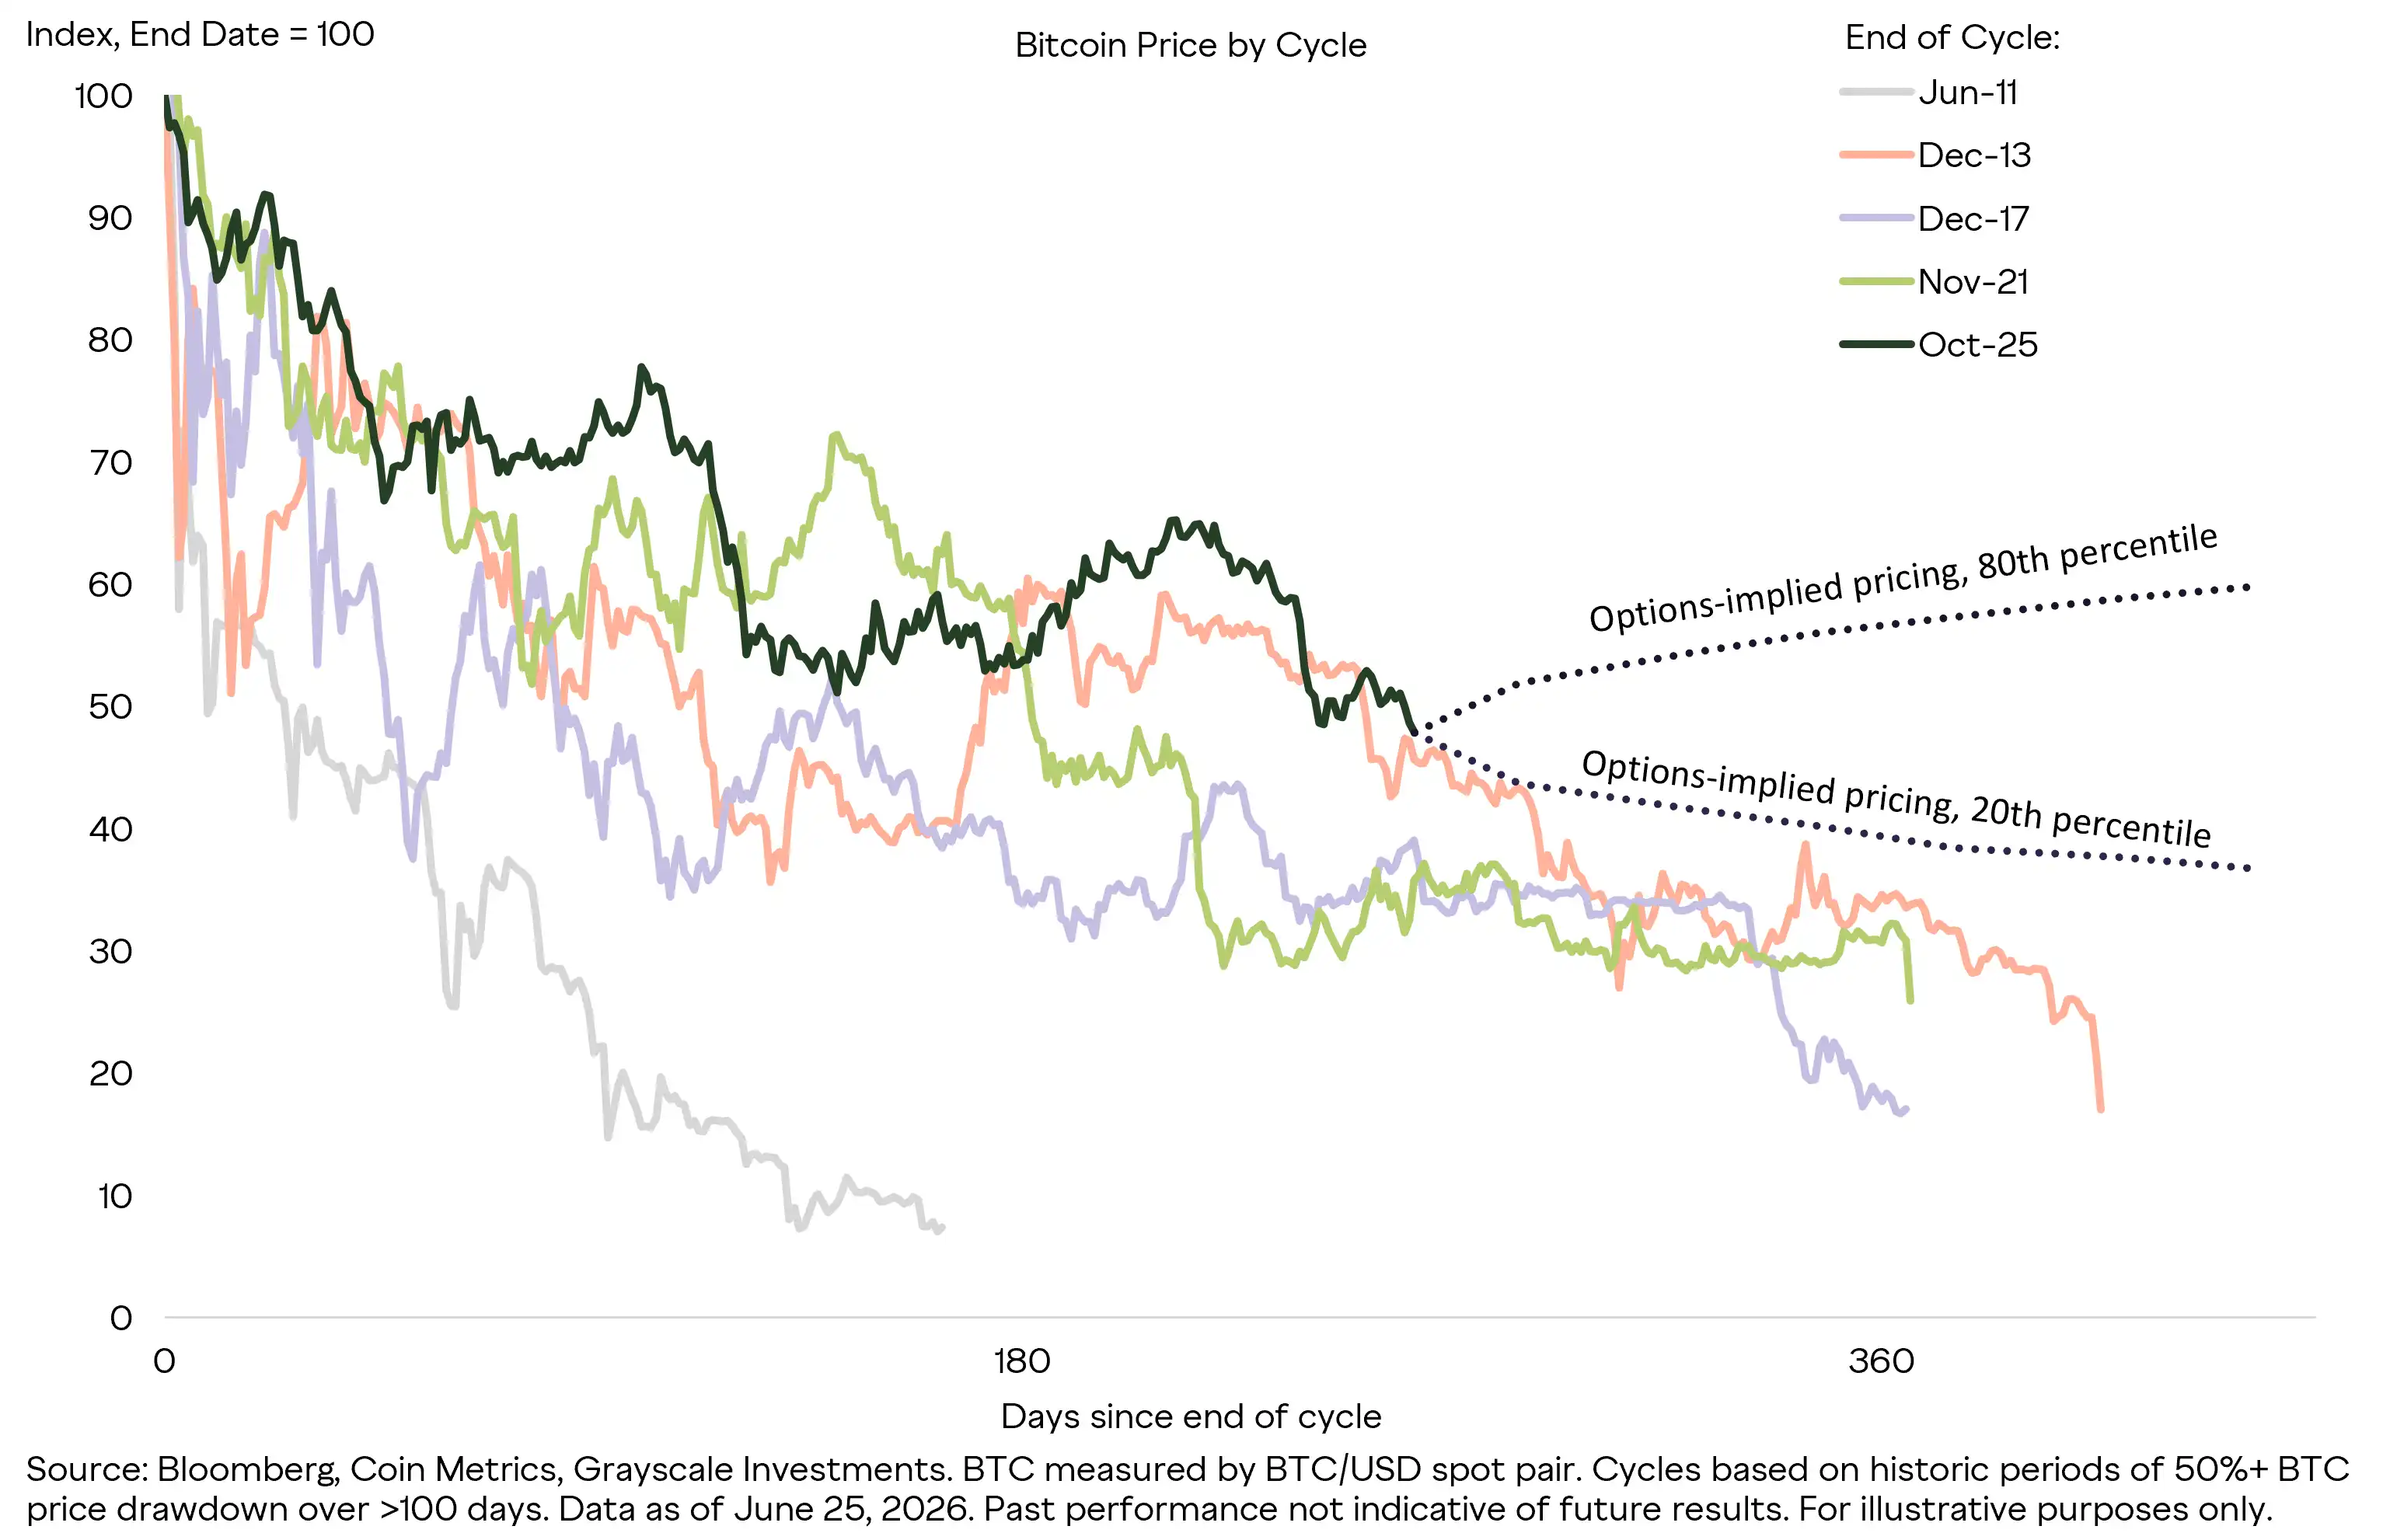
Chart 3: Two scenarios for Bitcoin exiting the latest bear market. The chart aligns historical cycle price movements to the same starting point (Cycle End Day = 100), with the x-axis being days after the cycle end. Gray is Jun-11, orange is Dec-13, purple is Dec-17, green is Nov-21, dark green is this cycle Oct-25. The two dashed lines on the right are the 80th and 20th percentile paths implied by options pricing, corresponding to the optimistic and downside scenarios mentioned above. The worst historical cycles (e.g., Jun-11, Dec-17) fell to levels of 10-20.
Source: Bloomberg, Coin Metrics, Grayscale Investments. Bitcoin priced in BTC/USD spot. Cycles defined as historical periods lasting over 100 days with declines exceeding 50%. Through June 25, 2026. Past performance is not indicative of future results, for illustrative purposes only.
The Grayscale Research team remains extremely bullish on the medium- to long-term prospects for crypto assets. It has been the best-performing asset class over the past decade2, and we believe it will remain so over the next decade. Investors will manage portfolio risk around short-term catalysts according to their individual needs. In our view, the current bear market offers long-term investors an excellent opportunity to position early, betting on the structural growth of public blockchain technology and digital asset valuations over the next decade.
Key Conclusion: Whether Bitcoin's price has seen the low for this cycle depends on upcoming catalysts, including the Fed's rate decisions and the progress of the CLARITY Act in the US Senate. We see many structural tailwinds for crypto assets and believe current valuations represent an attractive entry point for long-term investors.
1 Considering the difference in relative volatility between the two (22% for gold vs. 47% for Bitcoin over the past two years), gold's 25% decline roughly corresponds to a 40-50% decline for Bitcoin.
2 Asset classes represented by the following indices: S&P 500 Total Return Index (US Equities), Dow Jones US Real Estate Total Return Index (Real Estate), S&P/GSCI Total Return Index (Commodities), Bloomberg US Aggregate Bond Index (US Bonds), MSCI Emerging Markets Total Return Index (EM Equities), Bloomberg US Treasury Index (US Treasuries).