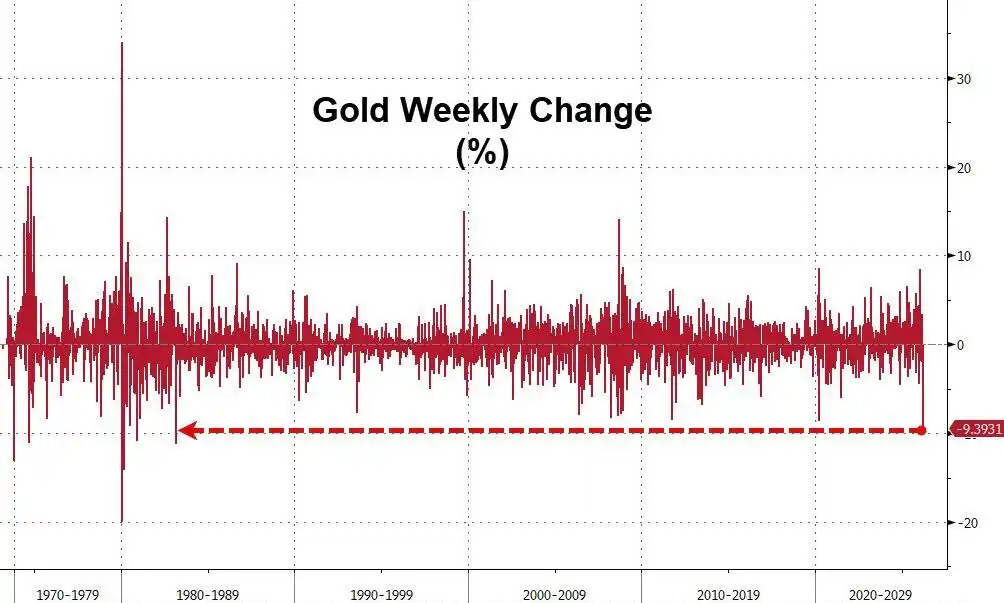
Gold suffered its worst weekly drop in 43 years this week, with echoes of history sending chills through the market.
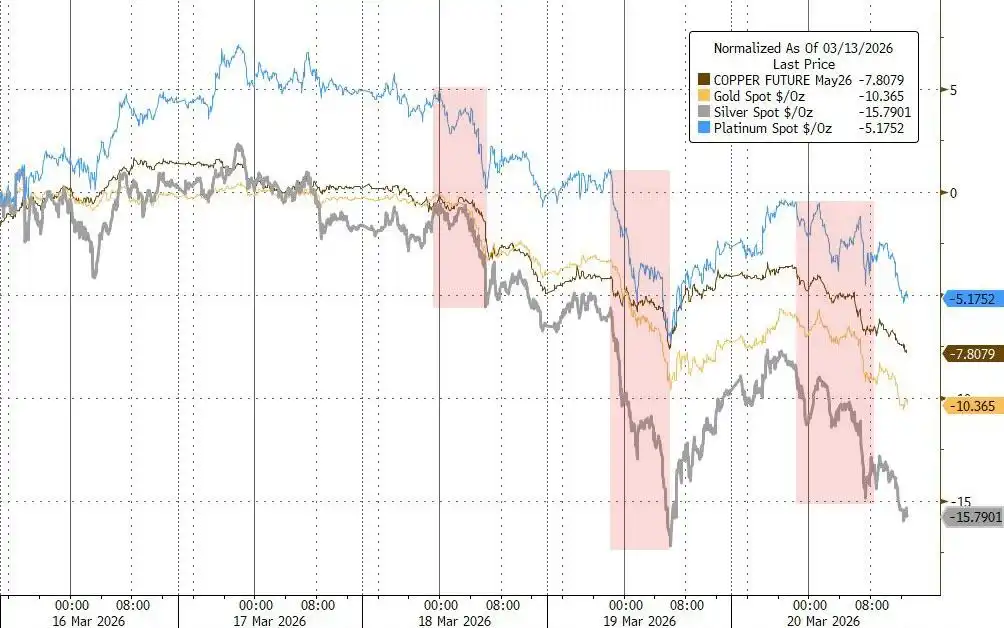
This week, gold recorded its largest weekly percentage decline since March 1983, with the spot price falling for eight consecutive days, marking the longest losing streak since October 2023. Meanwhile, silver fell more than 15% this week, and palladium and platinum also moved lower.
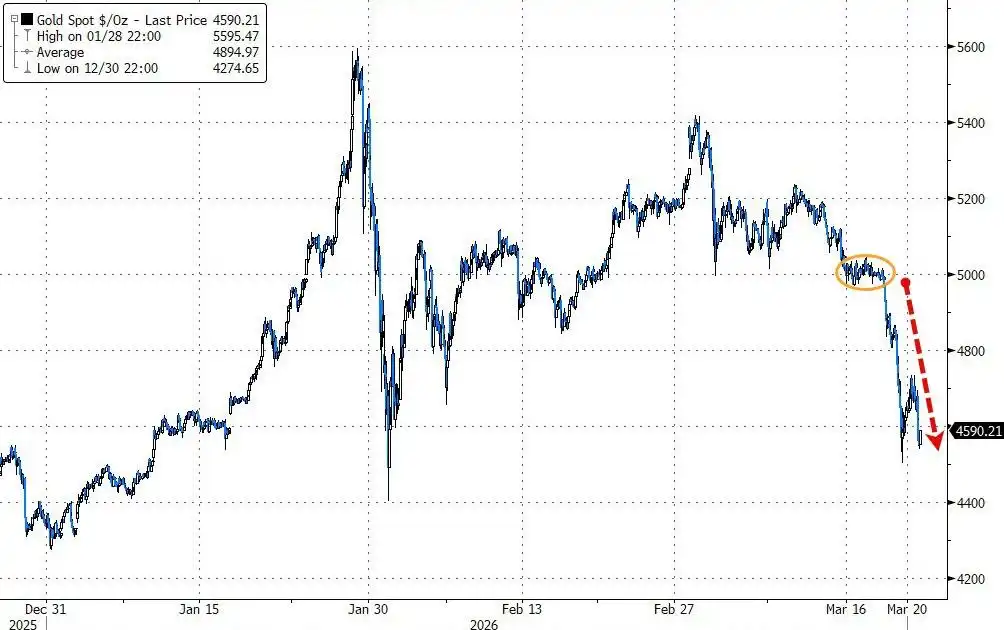
The trigger for this plunge was the escalating conflict in the Middle East, which pushed up energy prices and, in turn, suppressed expectations for interest rate cuts. Market bets on a Federal Reserve rate hike rose to 50%, fueling this wave of precious metal liquidation.
What's more alarming to the market is that the current situation bears a striking resemblance to the historic crash in March 1983, which was triggered by massive gold sales by Middle Eastern oil producers—back then, OPEC members, facing a sharp drop in oil revenues, were forced to sell off gold reserves for cash, causing the gold price to plummet by over a hundred dollars in a matter of days.
It is worth noting that, according to historical data, this week's decline in gold is the most severe since that "selling gold for funds" storm 43 years ago.
Rate Cut Expectations Unravel, Gold's Safe-Haven Logic Fails
Since the US and Israel launched attacks on Iran last month, gold has been falling for several weeks, a stark contrast to its traditional role as a "safe-haven asset."
The reason is that the war brings not expectations of easing but inflationary pressures. Currently, the market's anticipation of the Fed's policy path has undergone a fundamental reversal.
Traders are now pricing in a 50% probability of a Fed rate hike by October. Soaring energy prices are boosting inflation expectations, and gold, as a non-yielding asset, becomes significantly less attractive in an environment of rising real interest rates.
At the same time, there are signs of tightening US dollar liquidity. Cross-currency basis swaps began to widen noticeably this week, indicating a certain degree of dollar funding pressure.
This phenomenon may explain the deeper logic behind the gold sell-off—when dollar liquidity tightens, gold is often one of the first assets investors liquidate.
It is noteworthy that the most severe declines in the metal markets this week were concentrated during Asian and European trading hours, consistent with the pattern that dollar shortage pressures first manifest in offshore markets.
Technical Stop-Losses Triggered, Selling Reinforces Itself
Amid the sustained decline, gold's technical indicators deteriorated significantly, with the 14-day Relative Strength Index (RSI) falling below 30, entering a zone some traders consider oversold.
Rhona O'Connell, an analyst at StoneX Financial, pointed out that this gold correction is the result of profit-taking and liquidity liquidation. She stated that the price above $5,200 had attracted substantial buying, making the market accumulate considerable vulnerability to a pullback.
Once prices started to slide, stop-loss orders from a large number of investors were automatically triggered, and selling quickly formed a self-reinforcing spiral. Technical signals like moving averages further exacerbated the downward pressure.
Meanwhile, passive selling triggered by falling stock markets also spilled over into gold.
O'Connell noted that forced liquidations related to equity assets may have dragged down gold prices, while slowing central bank gold purchases and continued outflows from gold ETFs further dampened market sentiment. According to Bloomberg data, gold ETFs have seen net outflows for three consecutive weeks, with combined holdings dropping by more than 60 tonnes over those three weeks.
The Ghost of the 1983 Middle East 'Selling Gold for Funds'
The current situation reminds market participants of the gold crash triggered by the oil crisis 43 years ago.
Historical data shows that around February 21, 1983, British and Norwegian oil producers led price cuts, putting pressure on OPEC to follow suit, abruptly intensifying the global oil market's oversupply situation. Faced with a sharp contraction in oil revenues, Middle Eastern oil producers (mainly OPEC members) were forced to sell off gold reserves on a large scale to raise cash, triggering a gold price avalanche.
A report in The New York Times at the time corroborated this view. According to a March 1, 1983, New York Times report, traders explicitly stated that Middle Eastern oil producers selling gold was the direct trigger for the price crash and warned that if oil revenues fell further, these Arab countries might sell more gold. At that time, the gold price plunged more than $105 from its high in less than a week, with the largest single-day drop reaching $42.50, the worst in nearly three years.
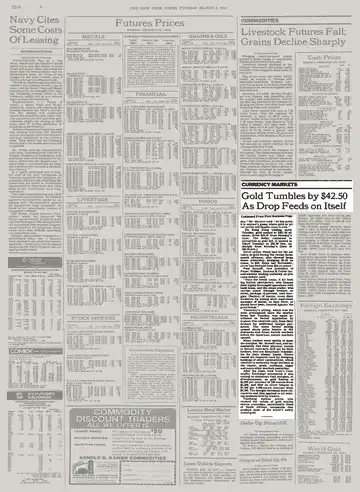
According to the New York Times report at the time, the funds from the Middle Eastern sales immediately flowed into Eurodollars and other short-term investment instruments, causing short-term interest rates to soften, which in turn sent warning signals to the global gold market. Since February 21 coincided with the US Presidents' Day holiday, with the New York market closed, the full impact wasn't felt until the following week, subsequently triggering chain-reaction forced liquidations that also affected commodity markets like copper, grains, soybeans, and sugar.
ZeroHedge pointed out that the 1983 gold crash marked the entry of the oil market into a bear market cycle that lasted for years—OPEC discipline frayed, market share was continuously lost, and oil prices remained under pressure throughout the 1980s.
Stagflation Clouds Loom, Can Gold Prices Stabilize?
Despite this week's heavy losses, gold is still up about 4% year-to-date. The price hit a record high of nearly $5,600 per ounce in late January, supported at that time by investor enthusiasm, central bank buying sprees, and market concerns about Trump interfering with Fed independence.
However, the current macroeconomic environment has deteriorated significantly. According to a Bloomberg report, Goldman Sachs economist Joseph Briggs expects rising energy prices to drag down global GDP by 0.3 percentage points over the next year and push overall inflation up by 0.5 to 0.6 percentage points. Rising stagflation risks are severely constraining central banks' policy space.
Goldman Sachs analyst Chris Hussey noted that the blockade of the Strait of Hormuz has entered its fourth week, and hopes for a quick resolution to the conflict are fading. If the conflict persists, the longer oil prices remain high, the harder it becomes for the "looking through the short-term pain" narrative in stock and bond markets to hold, and the vulnerability of global assets will be further exposed.
For gold, the path of real interest rates will be the key variable. If the conflict drags on, inflation expectations continue to heat up, and the Fed's rate hike path becomes clearer, pressure on gold may continue; whereas, once signals of easing geopolitical tensions emerge, whether suppressed safe-haven demand can be released again remains the market's biggest悬念 (suspense).






