Finding Missed Pivot Points Correctly: How a Crypto Trader Can Apply the Rob Booker Indicator

cryptonews.ruPubblicato 2026-08-08Pubblicato ultima volta 2026-08-08

Introduzione

"Missed Pivot Points (MPP), popularized by retail trader Rob Booker, are support and resistance levels calculated mathematically from the previous period's close, high, and low, rather than drawn visually. The article explains their calculation and application in cryptocurrency trading. MPPs act as 'price magnets,' and clusters of these levels are considered strong signals for potential trend reversals, often aligning with Fibonacci retracement levels—as seen in Bitcoin's resistance zones around $62,000-$66,000 and $74,000-$80,000. Traders can use them in breakout or pullback strategies. However, the indicator has drawbacks: numerous variations exist, it shouldn't be used alone, identifying level clusters is subjective, and it can give false signals during consolidation. In conclusion, MPP is a mathematical tool for identifying key levels but requires confirmation from other analysis methods."

Missed Pivot Points (MPP) are levels plotted on charts. The main difference with MPP is that they are drawn not in the standard way, but based on calculations. The foundation of missed pivot points is data from the previous trading period, which can be a day, week, or month. The tool was popularized by retail trader Rob Booker, who specializes in short selling.

So how are they calculated?

Calculating Missed Pivot Points

To determine where a particular missed pivot point is located, it is necessary to find the arithmetic mean of the closing, high, and low prices of the previous trading period. Considering that the determination of the level is based on mathematics, drawing it on the chart may not always be obvious from a visualization standpoint. An image of Bitcoin's price movement on the Bitstamp exchange will help confirm this:
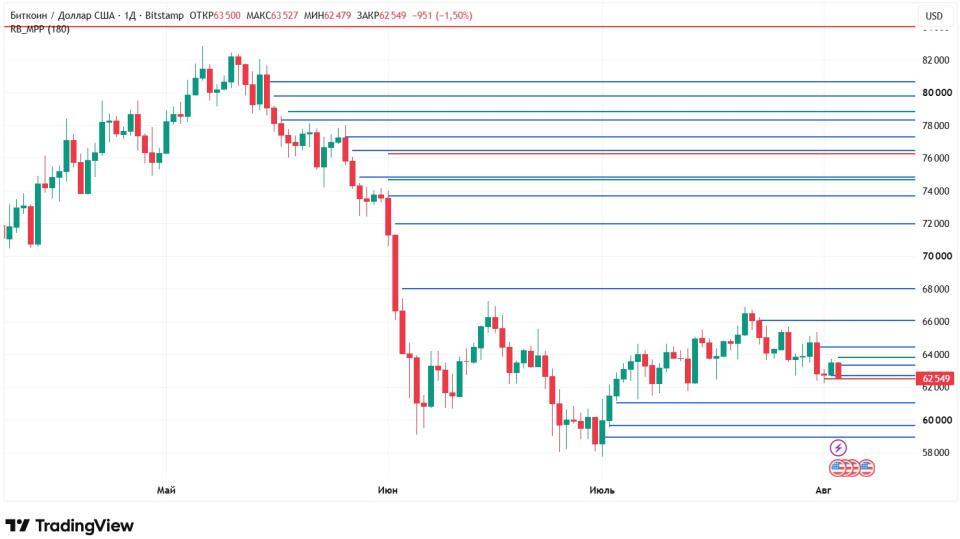
Source: tradingview.com

The chart shows many lines of different colors: red monthly, green weekly, and blue daily. As can be seen from the image, far from all of them could have been drawn by eye alone, as they often do not coincide with extremes.

In actual cryptocurrency trading, you won't have to calculate missed pivot points yourself. The trading platform will do this automatically. For example, on TradingView, you only need to set the "Days Ago" argument. It is responsible for the time period on which to search for levels. By default, the argument is set to 180 days. A crypto trader can decrease or increase this parameter at their discretion.

Having figured out how to build and plot missed pivot points, let's turn to how to trade using them.

Missed Pivot Points in Trading

Rob Booker himself believes that the levels act as so-called magnets: the price will tend towards them one way or another. The best reversal signal for a crypto trader will be an area where many different levels have formed. This strengthens the signal that a long-term trend break is quite likely.

If we look at Bitcoin's daily chart, quite strong resistance zones have currently formed in two ranges: $62,000–66,000 and $74,000–80,000. If BTC can break above them, a serious rise is quite possible. At the moment, they act as substantial resistance zones.

Moreover, Booker claims that a cluster of missed pivot points is often confirmed by Fibonacci levels. If we consider Bitcoin from its low to its high, this holds true. The 50% correction level is around $63,000, thus falling into the first range, and the 38.2% level is not far from $78,000, which corresponds to the second price interval.
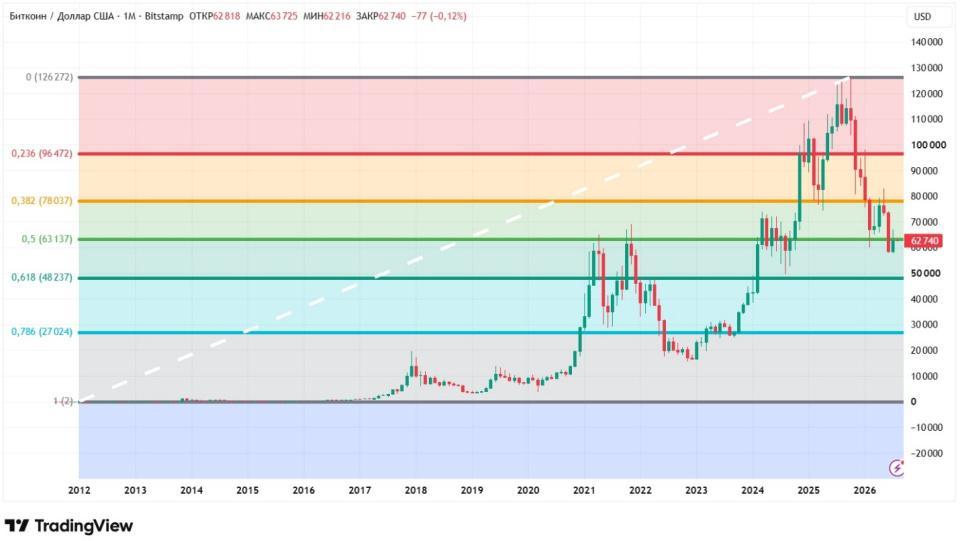
Source: tradingview.com

Additionally, missed pivot points can also be used as regular support and resistance levels. In this case, you only need to decide on a strategy: breakout or bounce. In the first case, a trade is made when the level is broken in its direction; in the second case, in the opposite direction. In any case, do not forget to place stop-loss orders, which will prevent unlimited losses.

Despite missed pivot points according to Rob Booker being a simple and effective tool, it has some drawbacks.

Indicator Disadvantages

The first downside is multiple variations. There are quite a few versions of missed pivot points. There are versions by Booker, by Thomas DeMark, by Ken Wood, and others. They all have a right to exist, and their effectiveness depends on the specific trading system.

The second downside is that missed pivot points should not be used as a standalone analytical tool. Even Rob Booker himself, in his lessons, constantly uses the Knoxville Divergence indicator as confirmation.

The third downside is subjectivity. Determining where there are "many" missed pivot points, as Booker advises, has no clear boundaries. As a result, the outcomes can be ambiguous.

The fourth downside is that the indicator can give false signals, especially during consolidation.

Conclusion

Rob Booker's Missed Pivot Points, MPP, is an indicator that operates on the principle of support and resistance levels. The peculiarity of MPP is that the set of its lines is plotted not based on visual representation, but on a mathematical calculation.

This material and the information in it are not individual or any other recommendation. The opinion of the editorial board may not coincide with the opinions of analytical portals and experts.



end-content

Domande pertinenti

QWhat are Missed Pivot Points (MPP) and how do they differ from standard pivot points?

AMissed Pivot Points (MPP) are levels plotted on charts. Their key difference from standard pivot points is that they are not drawn based on visual or standard calculations but are derived from specific mathematical calculations using data from the previous trading period (such as day, week, or month). They were popularized by retail trader Rob Booker.

QHow is a Missed Pivot Point calculated?

ATo calculate a Missed Pivot Point, you need to find the arithmetic mean of the previous trading period's closing price, high price, and low price. In practice, trading platforms like TradingView perform this calculation automatically; the trader only needs to set the 'Days Back' parameter to determine the time frame for finding the levels.

QAccording to the article, how does Rob Booker suggest traders use the concentration of multiple MPP levels?

ARob Booker suggests that an area where multiple different MPP levels cluster together serves as a strong signal. He refers to these zones as a 'magnet' for price, and a cluster often indicates a higher probability of a long-term trend reversal or a significant price movement.

QWhat is one of the main disadvantages of using the Missed Pivot Points indicator mentioned in the article?

AOne of the main disadvantages is that Missed Pivot Points should not be used as a standalone analytical tool. Even Rob Booker, in his own lessons, consistently uses other indicators, like the Knoxville Divergence, to confirm signals generated by MPP.

QHow can crypto traders potentially use MPP levels in their trading strategies?

ATraders can use MPP levels as regular support and resistance levels. They need to decide on a strategy type: a 'breakout' strategy, where a trade is executed when the price breaks through the level in the direction of the break, or a 'bounce' strategy, where a trade is taken in the opposite direction of the level test. Proper stop-loss orders are essential with either approach.

Letture associate

Google's Decade-Long AI Power Struggle Concludes, Pichai Gracefully Consolidates Control

A decade of internal AI rivalry at Google has concluded with CEO Sundar Pichai consolidating power through a masterful, bloodless reorganization. The key moves saw Demis Hassabis, DeepMind's visionary founder, step down as CEO of Google DeepMind to become Alphabet's Chief Scientist, focusing on long-term AGI. Concurrently, Google's legendary technical leader Jeff Dean departed with his team to start a new venture, in which Google invested. This restructuring marks the end of a long-standing divide between the research-focused DeepMind and the product-oriented Google Brain. Pichai's strategy, beginning with their 2023 merger under Hassabis, gradually centralized control. While Hassabis gained public acclaim for Gemini's progress and a Nobel Prize, Pichai quietly elevated Koray Kavukcuoglu, a pragmatic engineering veteran, to oversee daily operations. The catalyst was mounting pressure in 2026 as Gemini's development timelines slipped, causing stock declines. Hassabis, more passionate about pure research and his AI drug discovery company Isomorphic Labs, grew weary of the commercial grind. His graceful "promotion" effectively removed him from operational control. Pichai handled both transitions with characteristic finesse: granting Hassabis a prestigious, future-focused role to prevent a defection to rivals (as happened with former DeepMind co-founder Mustafa Suleyman), and investing in Dean's new company to keep his pioneering work within Google's orbit. The outcome is a fundamental shift: control of Google's AI future has passed from brilliant scientist-visionaries to professional managers and engineers like Kavukcuoglu and Pichai himself. It signals Pichai's bet that the AI race has entered an industrial phase won by systemic execution, organizational efficiency, and stable delivery, rather than lone genius. The era of scientists directly managing core AI is over at Google, replaced by a machine-like division of labor where the CEO decides who decides.

marsbit1 h fa

Google's Decade-Long AI Power Struggle Concludes, Pichai Gracefully Consolidates Control

marsbit1 h fa

Conversation with Blockchain Capital Partners: The Next Bull Market May Be Right in Front of Us

In a recent Bankless podcast, Blockchain Capital partners Aleks Larsen and Spencer Bogart discussed the crypto market's evolution from infrastructure to applications. They noted that widespread stablecoin adoption has built significant on-chain liquidity, boosting revenues for lending and trading protocols. The partners defended the "buyback and burn" token model, explaining its current effectiveness in aligning incentives and establishing credibility with holders, despite past debates on capital efficiency. Addressing the sentiment divide in crypto, they highlighted positive catalysts like regulatory clarity and institutional entry, even during the bear market. Aleks compared the industry's current state to the 2003-2004 internet era—post-"broadband transition" with cheap block space, awaiting mainstream adoption through applications like stablecoins and prediction markets. They observed a shift from "fat protocol" to "fat application," where value now accrues more at the application layer than the base infrastructure, a sign of a maturing ecosystem. Drawing parallels to AI, they noted similarities in early hype cycles but emphasized crypto's transparent, token-driven market corrections versus AI's private market adjustments. On Real World Assets (RWA), Spencer projected stablecoin market cap to reach trillions by 2030, detailing its multiplier effect on on-chain economic activity. For stock tokenization, he outlined two approaches: permissionless but legally indirect models and compliant, direct ownership channels, suggesting they can coexist in "sidecar" models alongside pure DeFi. The conversation concluded that while the industry's ethos evolves with institutional adoption, crypto's core promise of upgrading global financial infrastructure for greater efficiency remains intact and is steadily progressing.

marsbit3 h fa

Conversation with Blockchain Capital Partners: The Next Bull Market May Be Right in Front of Us

marsbit3 h fa

Trading

Spot
活动图片