Everyone Is Waiting for the War to End, But Does the Oil Price Suggest a Long-Term Conflict?

marsbitPubblicato 2026-04-07Pubblicato ultima volta 2026-04-07

Introduzione

This article argues that the market views oil price volatility as a consequence of the ongoing conflict, but the real insight is understanding how the war itself is being priced through oil. With the Strait of Hormuz blocked, global crude supply is being restructured, with Asian buyers shifting to US oil, causing WTI to surpass Brent—a sign of structural changes in pricing and trade flows. While short-term price differences can be explained by contract timing, the deeper issue is a fundamental shift in who can supply oil. The market's key misjudgment is not on price, but on time. Futures curves still imply the conflict will end soon and supply will recover. However, the more likely path is a prolonged war of attrition. This means high oil prices are not a temporary shock but a new structural reality, with a range of $120-$150. In this framework, oil is no longer just a commodity but the "upstream variable" for all assets. Its repricing will ripple through interest rates, currencies, equity, and credit markets. The market has priced in the war's occurrence, but not its persistence. The analysis concludes that a prolonged conflict is the base case scenario, and any pullbacks in oil prices present an opportunity as the market has yet to fully price in a long-term disruption.

Editor's Note: While the market still views oil price fluctuations as an "outcome variable" of the war, this article argues that what truly needs to be understood is how the war itself is being priced through oil.

As the Strait of Hormuz remains blocked, the global crude oil supply system is being forcibly restructured—Asian buyers are turning to U.S. crude oil on a large scale, and WTI surpassing Brent marks a structural shift in pricing mechanisms and trade flows. Short-term price differentials can be explained by contracts, but at a deeper level, it's a question of "who can still supply."

The author further points out that the market's key misjudgment lies not in price but in time. The futures curve still implies one premise: the conflict will end in the short term, and supply will recover. But the more likely path is a prolonged war of attrition. This means that high oil prices are no longer a temporary shock but will evolve into a more persistent structural state, with the range potentially shifting upward to $120–150.

Under this framework, crude oil is no longer just a commodity but becomes the "upstream variable" for all assets. Its repricing will transmit layer by layer through interest rates, exchange rates, stock markets, and credit markets.

The market has priced in the occurrence of the war but has not yet priced in its persistence.

Below is the original text:

Trump gave Iran a 10-day deadline. That was a week ago. Yesterday, he reminded everyone again: the countdown has only 48 hours left. Tehran's response: no.

Five weeks ago, on February 28, when U.S. and Israeli warplanes launched airstrikes on Iran, the market's pricing logic was still that of a "surgical" air strike: two weeks, three at most; the Strait of Hormuz would reopen; oil prices would spike and then fall back, and everything would return to normal.

But our judgment at the time was: it won't.

From day one, our core view has been that this war would first escalate and only later possibly de-escalate. The most likely path is the involvement of ground forces, evolving into a long and draining conflict. The duration of the Strait of Hormuz's closure would far exceed the assumptions the market is willing to model. We have provided the full logic in our duration framework, Hormuz pricing model, and war variable analysis.

The core judgment is simple: Iran doesn't need to win; it only needs to raise the cost of the war high enough to force Washington to seek an exit path. And this "exit" will not come with the smooth reopening of the strait.

Five weeks later, every key part of this judgment is being gradually validated. The Strait of Hormuz remains closed. Brent crude settled around $110. The Pentagon is preparing for weeks of ground operations. Trump's war goals have also shifted from "denuclearization" to "bombing them back to the Stone Age," but he still cannot clearly define what "victory" means.

The deployment of ground forces is the escalation inflection point we have been tracking. Marine and airborne troops are already assembling in the theater; this moment is approaching.

But more critical than the next round of airstrikes or the next ultimatum is oil.

Oil is not a byproduct of this war; oil is the core of the war itself. Stock markets, bond markets, crypto markets, the Fed, even your daily food expenses—everything is a downstream variable. As long as you judge oil prices correctly, everything else will unfold accordingly; once you misjudge, all other decisions will lose meaning.

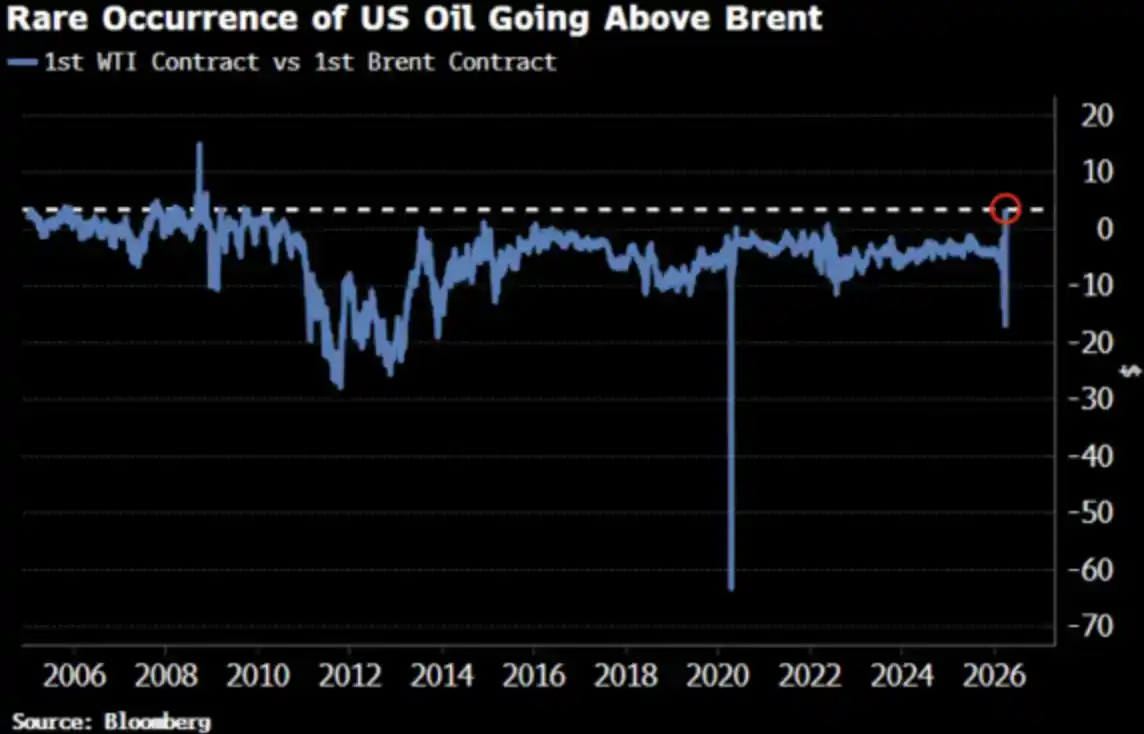
WTI crude prices have just surpassed Brent for the first time since 2022, a change that has already drawn market attention.

Good. It should.

WTI Above Brent: What Everyone Is Asking

On April 2, WTI crude settled at $111.54, while Brent settled at $109.03. WTI's premium over Brent was $2.51, the largest spread since 2009. Just two weeks ago, WTI was still at a significant discount to Brent.

Everyone is asking: What happened? Below is the brief version, and the version closer to reality.
Brief Version: Mismatch in Contract Expiries

WTI's front-month contract is for May delivery, while Brent's front-month contract has rolled to June. In such a tight supply situation, "delivery one month earlier" means a higher price—WTI just happens to have an earlier delivery date.

Adi Imsirovic, an oil trader with 35 years of experience now at Oxford, stated that on top of historically high freight and insurance costs, buyers are willing to pay nearly $30/barrel more for Brent crude delivered one month earlier. In his 35-year career, he has never seen anything like this.

This is a "mechanism-level" explanation—it is correct but incomplete.

Real Version: The Entire Price Curve Is Shifting

The convergence of WTI and Brent is not just a sporadic mismatch in front-month contracts. Bloomberg points out that this phenomenon is clearly visible across multiple contract months, running through the entire forward curve. In other words, the entire price curve is being repriced.

Why? A shift in Asian demand. In late March, Asian refineries locked in about 10 million barrels of U.S. crude for May shipment; the previous week, they also purchased about 8 million barrels. Kpler expects U.S. crude exports to Asia to reach 1.7 million barrels per day in April, up from 1.3 million in March. China, South Korea, Japan, and ExxonMobil's refinery in Singapore are all buying U.S. crude—because it is "the only available supply right now."

The Strait of Hormuz remains closed. Abu Dhabi's benchmark crude Murban—the closest substitute for WTI—has disappeared from the global market. WTI is becoming the world's "marginal pricing oil."

This is not panic buying but a change in flow structure.
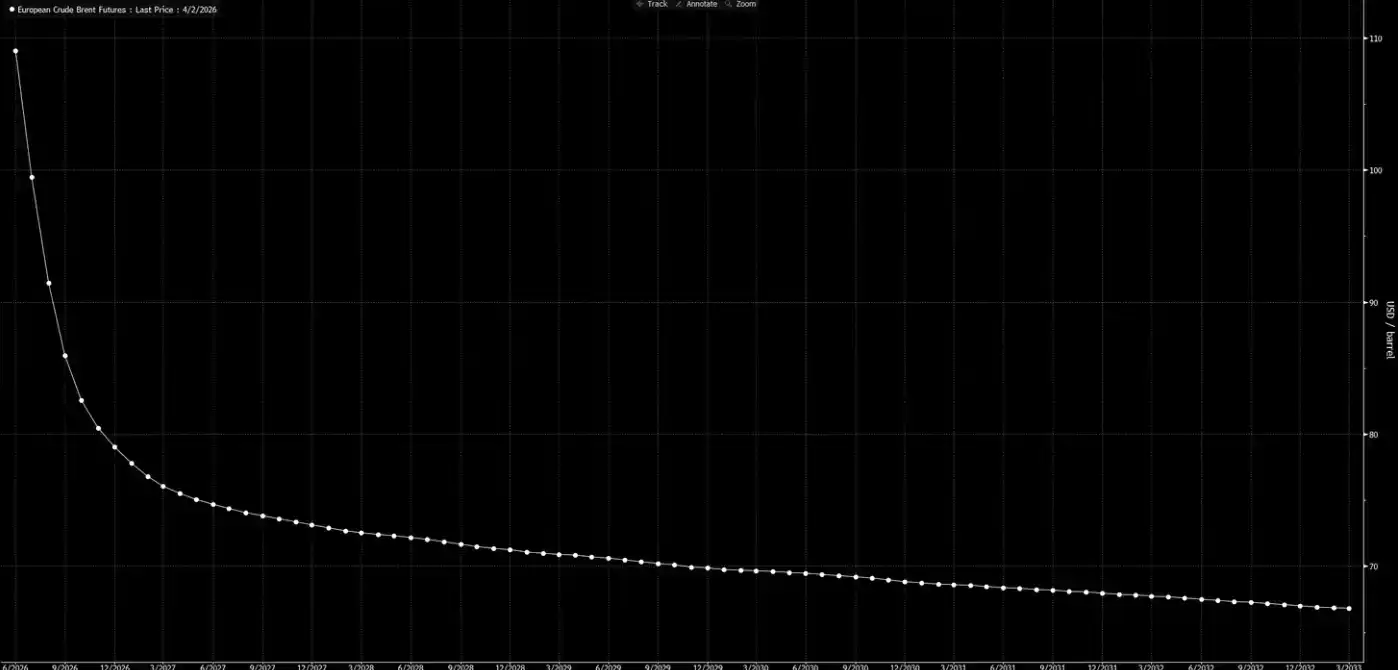
Now look at the forward price curve.

This curve is sending a signal: this is just a temporary shock; by Christmas, everything will be back to normal.

Our judgment: This curve is "dreaming."

Three Endings, One Baseline Path

We have already proposed this analytical framework in the "Weekly Signal Playbook." So far, nothing has changed; if anything, the probability of the baseline scenario has only strengthened.

This war will ultimately end in only three ways:
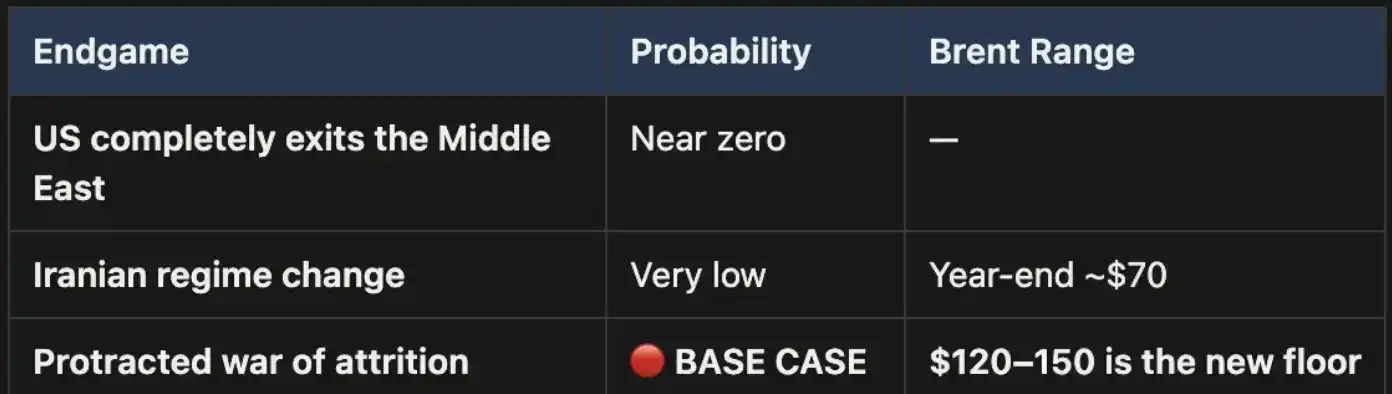
Ending one is almost politically impossible.


Ending two is equally untenable: terrain conditions, troop requirements, and the logic of guerrilla warfare all indicate that this path would be costly and difficult to conclude. Iran's land area is three times that of Iraq, with nearly twice the population, not to mention mountainous terrain that leaves no room for invaders. This is not 2003.

Ending three is the baseline scenario, and its probability is far ahead. If the conflict evolves into a long-term war of attrition, the closure of the Strait of Hormuz will persist, and oil prices will remain high. This high level will be structural, not temporary. The current forward price curve clearly underprices this.

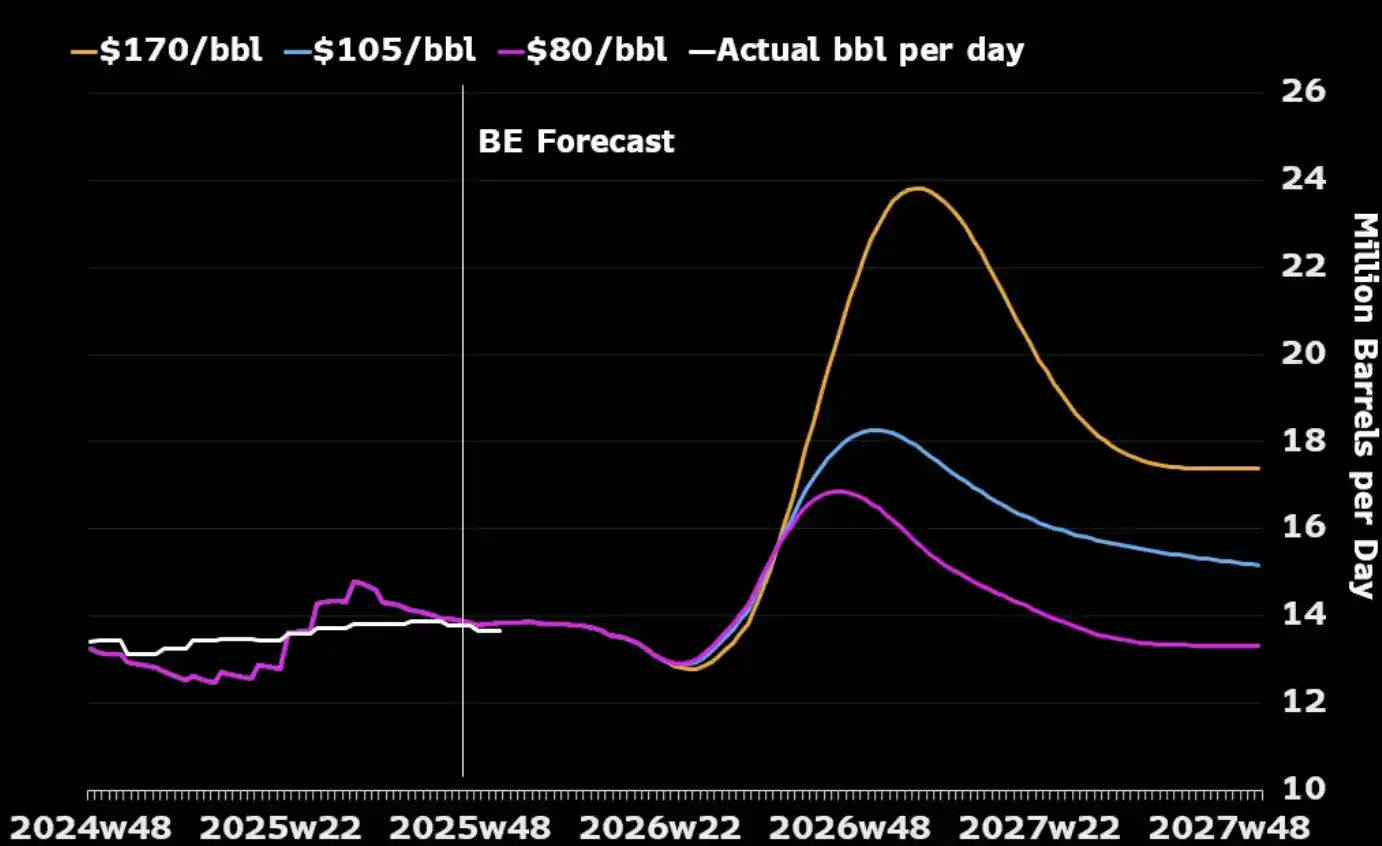
What most people overlook is this: from the perspective of the oil industry itself, a long-term war might actually align with U.S. strategic interests. Middle Eastern crude production capacity would be damaged in the conflict, forcing global buyers to turn to North American energy because other alternative sources are scarce. Higher oil prices would also stimulate U.S. producers to expand output—increasing rigs and investing more in shale oil. Look at the chart below: historically, almost every major oil price spike has been followed by an uptick in U.S. production within 12 to 18 months.
The only cost the U.S. truly needs to manage is domestic: how to avoid gasoline prices staying above $4 per gallon for too long, triggering political backlash. This is a "pain threshold," not a condition for ending the war.

The "Arithmetic" of Price

With the Strait of Hormuz closed, $110 for Brent is not the ceiling but the starting point. Under our baseline scenario, as long as the strait remains closed, oil prices will sustain in the $120 to $150 range.

With each passing week, inventories are being drawn down. UBS data shows global inventories had fallen to the five-year average by the end of March—and that was before the latest round of escalation. Macquarie estimates: if the war drags past June and the strait remains closed, there is a 40% probability oil prices will surge to $200.

The front-month spread (the difference between Brent's two nearest contracts) has widened to $8.59/barrel. The market is paying about an 8% premium for "delivery one month earlier"—this is tension at the 2008 level.

But in 2008, 15% of global supply wasn't physically blocked.

Now, almost every model, every price curve, every year-end prediction on Wall Street is built on the same premise: this conflict will end, the Strait of Hormuz will reopen, oil prices will return to normal, and the world will go back to the way it was.

Our judgment: It won't.

The back end of the forward curve hasn't caught up with reality. The market has priced in the "occurrence of the war" but has not priced in the "persistence of the war." Before Hormuz reopens, every pullback in crude is an opportunity. This is our core position, and we will not hedge it.

Oil is the first node. When "ground forces enter" and there is no quick victory—when the conflict evolves into the long-term war of attrition we judged from day one—repricing will not stop at crude itself but will transmit sequentially to interest rates, exchange rates, stock markets, and credit markets. This is what will happen next.


Crypto di tendenza

Domande pertinenti

QWhat is the main argument of the article regarding the oil market and the ongoing conflict?

AThe article argues that the oil market is mispricing the duration of the conflict. While the market prices in a short-term disruption, the more likely path is a prolonged war of attrition, which would make high oil prices a structural, not a transitory, state. Oil is not just a commodity but the core of the war and the upstream variable for all other assets.

QWhat significant change occurred between WTI and Brent crude oil prices, and what does it signify?

AWTI crude oil price traded at a premium to Brent for the first time since 2022, with a spread of $2.51. This signifies a structural shift in global oil trade flows, driven by Asian buyers turning to US crude after the closure of the Strait of Hormuz, making WTI the marginal pricing oil for the world.

QAccording to the article, what are the three possible outcomes of the conflict, and which is the most probable?

AThe three outcomes are: 1) A swift, decisive US victory forcing Iran surrender (politically impossible), 2) A full-scale US invasion and occupation of Iran (unviable due to terrain and cost), and 3) A prolonged war of attrition. The article states that Outcome 3 is the base case with the highest probability.

QWhat is the expected price range for oil in the article's base case scenario, and why?

AIn the base case scenario of a prolonged conflict with the Strait of Hormuz closed, the expected oil price range is $120 to $150 per barrel. This is because the disruption is structural, global inventories are being drawn down, and 15% of global supply is physically blockaded.

QHow does the article suggest the market's current pricing is flawed?

AThe market's current pricing, as seen in the futures curve, is flawed because it is predicated on the assumption that the conflict will end soon and the Strait of Hormuz will reopen. The article contends the market has priced in the 'occurrence' of the war but has not priced in its 'persistence,' leading to a significant mispricing of long-term oil price structure.

Letture associate

Must-Watch Events Next Week|CLARITY Act Could Face Senate Vote; SpaceX, Circle to Report Earnings (8.3-8.9)

**Summary: Key Events and Developments to Watch (August 3-9)** The upcoming week is marked by significant financial disclosures, key legislative deadlines, and notable product updates. **Major Financial Events:** Several companies are scheduled to release their Q2 2026 earnings. American Bitcoin (ABTC) will report on August 3, followed by SpaceX and Hut 8 Mining Corp. on August 4, and Circle on August 5. Notably, a significant portion of SpaceX shares (up to 12% of total shares) will be unlocked on August 6 following their earnings release. **Key Legislative Deadline:** The U.S. Senate faces an August 7 deadline to secure 60 votes for the CLARITY Act, a bipartisan bill aiming to establish a federal regulatory framework for cryptocurrencies. The Senate may hold a full vote on the bill during the week. **Economic Data:** The U.S. July Non-Farm Payrolls report will be released on August 7, providing crucial labor market data. **Technology & Product Updates:** * **Shutdowns:** DeFi portfolio tracker Zapper and wallet app Ctrl Wallet will cease operations on August 3. * **Upgrades:** LayerZero will deprecate its v1 relayers on August 3. XRP Ledger's new version 3.3.0, featuring five new functions, is expected next week. * **AI:** Elon Musk announced that the advanced Grok 4.6 AI model is set for release around August 7. * **Bitcoin:** The BIP-110 forced signaling for a potential Bitcoin network change is scheduled to begin around August 8. **Other Notable Events:** Chinese robotics firm Unitree Tech has set its preliminary price inquiry for its IPO for August 5. South Korean exchange Upbit will delist AQT and AERGO tokens on August 3.

marsbit21 min fa

Must-Watch Events Next Week|CLARITY Act Could Face Senate Vote; SpaceX, Circle to Report Earnings (8.3-8.9)

marsbit21 min fa

Stocks Are Plummeting More Sharply Than Cryptocurrencies. Where Has the Money Gone?

Stock Markets Plunge Deeper Than Cryptocurrencies: Where Did the Money Go? In late July, Seoul's Kospi index triggered circuit breakers for two consecutive days, plummeting over 40% from its June high. The collapse was led by heavyweight stocks like SK Hynix, whose record profits still disappointed investors, and devastating leveraged ETFs, with one major product losing over 83% of its value. This signaled a global, forced deleveraging targeting the most crowded trades. Interestingly, while stocks exhibited extreme volatility akin to crypto markets, Bitcoin rose nearly 15% in July after a prior steep drop. Analysis shows the money fleeing equities did not flow into Bitcoin. Instead, Bitcoin had already absorbed its sell-off in May-June, when U.S. spot Bitcoin ETFs saw historic outflows. The true safe-haven beneficiary was gold, whose price rose over 20% year-on-year, highlighting a decoupling between Bitcoin and gold as "digital gold." The sell-off was a targeted unwinding of leveraged positions in tech and semiconductors, accelerated by broker-dealer risk management and shifts in the AI narrative, including new competition from Chinese memory chipmakers. The retreat path was clear: from high-valuation tech stocks to cash and U.S. Treasuries, then to gold. For Bitcoin to attract sustained institutional inflows, conditions like eased global liquidity pressure, a "soft-landing" Fed rate cut, and U.S. regulatory clarity via legislation like the stalled CLARITY Act are needed. Currently, Bitcoin is not a safe haven but an already-cleared asset. Its low correlation with tech stocks, however, makes it a potential diversification play for institutional portfolios once the storm passes. The money isn't here yet, but the positioning is underway.

marsbit21 min fa

Stocks Are Plummeting More Sharply Than Cryptocurrencies. Where Has the Money Gone?

marsbit21 min fa

In Conversation with Ray Dalio: We Are Currently in an AI Bubble, with 1% of My Portfolio in Bitcoin

Ray Dalio, founder of Bridgewater Associates, warns in an interview that the current AI boom shows classic bubble characteristics, which could lead to significant economic downturns as seen in past cycles like 1929 or 2000. He explains that speculative enthusiasm, fueled by debt and overvaluation, often precedes a crash when rising rates or taxation force asset sales, causing widespread losses and recession. Dalio also outlines his "Big Cycle" theory, describing an approximate 80-year pattern where widening wealth gaps, massive government deficits, and shifting geopolitical power (like China's rise) create internal conflict and global instability. He emphasizes that we are in a late-cycle, transitional phase where traditional powers like the US and UK face decline. For personal wealth protection, Dalio advises diversification beyond cash into assets like stocks, bonds, real estate, and particularly gold, which he prefers over Bitcoin. While he holds about 1% of his portfolio in Bitcoin as a non-printable hard asset, he views gold as more secure from technological or governmental threats. Regarding AI's impact, Dalio believes it will disproportionately benefit capital owners, worsening inequality by replacing both physical and cognitive labor. He suggests that human intuition and emotional intelligence, combined with AI, will be key for future workers. On taxation, Dalio argues that wealth taxes are impractical and risk triggering asset sell-offs, reducing productive investment. He points to the UK as a cautionary example of debt, low productivity, and political strife. Geopolitically, Dalio foresees a more regionalized world, with the US showing weakness in prolonged conflicts like with Iran, akin to past imperial declines. The ideal outcome, he suggests, is coexisting powerful blocs (e.g., Americas, China-Asia Pacific) without major war.

marsbit4 h fa

In Conversation with Ray Dalio: We Are Currently in an AI Bubble, with 1% of My Portfolio in Bitcoin

marsbit4 h fa

Daily 7.2 Trillion KRW: Foreign Capital's Record Net Buying on Friday! Wall Street Says Headwinds for Korean Stock Fund Flows Have Subsided

South Korean stock market sees a dramatic shift in fund flows. On July 31, foreign investors made a record net purchase of approximately KRW 7.2 trillion in KOSPI stocks, marking a fundamental reversal from the persistent large-scale net outflows seen in previous months. This contributed to a significant narrowing of foreign net selling in July to KRW 9.8 trillion, down sharply from KRW 48.4 trillion in June and KRW 44.5 trillion in May. Simultaneously, domestic institutional pressure eased. South Korean pension funds and asset managers turned to a net buying position in July, purchasing KRW 1.0 trillion worth of KOSPI shares, contrasting with net sales in May and June. Market volatility is expected to be dampened by new financial regulations. Effective July 31, the Financial Services Commission tightened access for retail investors to single-stock leveraged ETFs by raising the minimum cash deposit requirement. Trading volumes for these products subsequently dropped to about 50% of their monthly average. Citigroup Research maintains its year-end KOSPI target of 10,000 points. The firm cites several supportive factors: the substantial easing of headwinds from capital outflows, a robust fundamental outlook for the semiconductor sector, historically low market valuations, strong economic fundamentals, and the potential for policy support from financial authorities if needed.

marsbit4 h fa

Daily 7.2 Trillion KRW: Foreign Capital's Record Net Buying on Friday! Wall Street Says Headwinds for Korean Stock Fund Flows Have Subsided

marsbit4 h fa

Trading

Spot

Articoli Popolari

Come comprare WAR

Benvenuto in HTX.com! Abbiamo reso l'acquisto di WAR (WAR) semplice e conveniente. Segui la nostra guida passo passo per intraprendere il tuo viaggio nel mondo delle criptovalute.Step 1: Crea il tuo Account HTXUsa la tua email o numero di telefono per registrarti il tuo account gratuito su HTX. Vivi un'esperienza facile e sblocca tutte le funzionalità,Crea il mio accountStep 2: Vai in Acquista crypto e seleziona il tuo metodo di pagamentoCarta di credito/debito: utilizza la tua Visa o Mastercard per acquistare immediatamente WARWAR.Bilancio: Usa i fondi dal bilancio del tuo account HTX per fare trading senza problemi.Terze parti: abbiamo aggiunto metodi di pagamento molto utilizzati come Google Pay e Apple Pay per maggiore comodità.P2P: Fai trading direttamente con altri utenti HTX.Over-the-Counter (OTC): Offriamo servizi su misura e tassi di cambio competitivi per i trader.Step 3: Conserva WAR (WAR)Dopo aver acquistato WAR (WAR), conserva nel tuo account HTX. In alternativa, puoi inviare tramite trasferimento blockchain o scambiare per altre criptovalute.Step 4: Scambia WAR (WAR)Scambia facilmente WAR (WAR) nel mercato spot di HTX. Accedi al tuo account, seleziona la tua coppia di trading, esegui le tue operazioni e monitora in tempo reale. Offriamo un'esperienza user-friendly sia per chi ha appena iniziato che per i trader più esperti.

253 Totale visualizzazioniPubblicato il 2024.12.11Aggiornato il 2026.06.02

Come comprare WAR

Discussioni

Benvenuto nella Community HTX. Qui puoi rimanere informato sugli ultimi sviluppi della piattaforma e accedere ad approfondimenti esperti sul mercato. Le opinioni degli utenti sul prezzo di WAR WAR sono presentate come di seguito.

活动图片












