Ethereum Price Last Time This Signal Appeared, It Surged 260%: Can ETH Break Through the $5000 Mark?
Ethereum (ETH) reaching its realized price level provides a significant buying opportunity for investors, with analysis indicating the potential for a substantial future rally. Experts predict a return to the $5000 level by 2026 is achievable.

ETH's recent trading price is approaching a historically significant bottom indicator level, with multiple classic technical patterns suggesting the price has the potential to surge towards the $5000 high.
Key Points:
ETH price is nearing its realized price level, an indicator historically seen as an excellent buying opportunity, often leading to strong subsequent rallies.
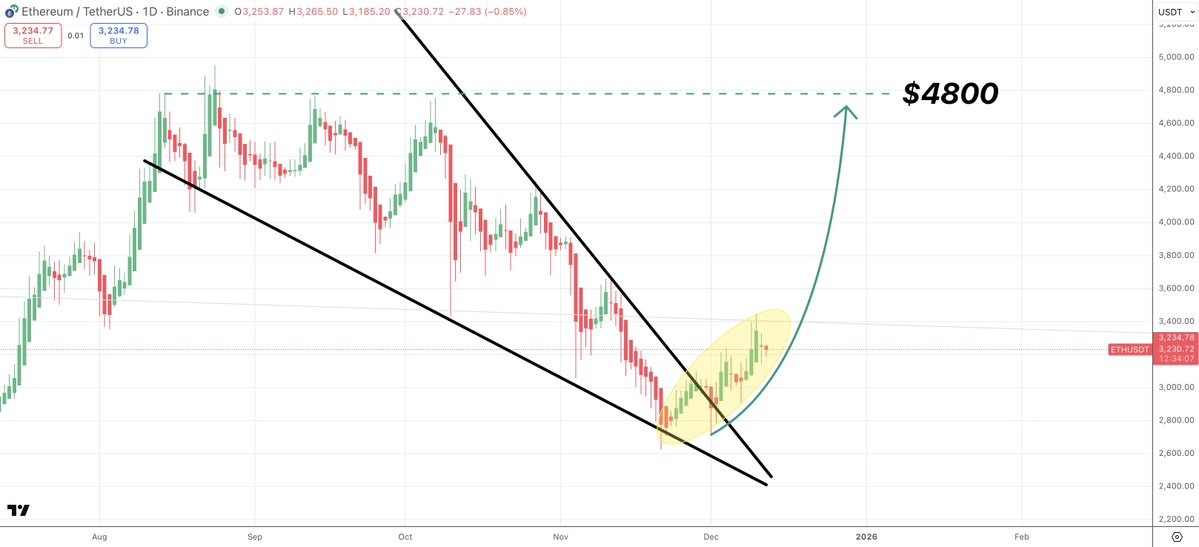
A V-shaped reversal and falling wedge pattern are clearly emerging, indicating an ETH price target of $5000.
ETH Price Brewing for a Major Rally
The ETH/USD pair experienced a significant 45% correction from its October 7th high of $4758, touching a multi-month low of $2621 on November 21st.
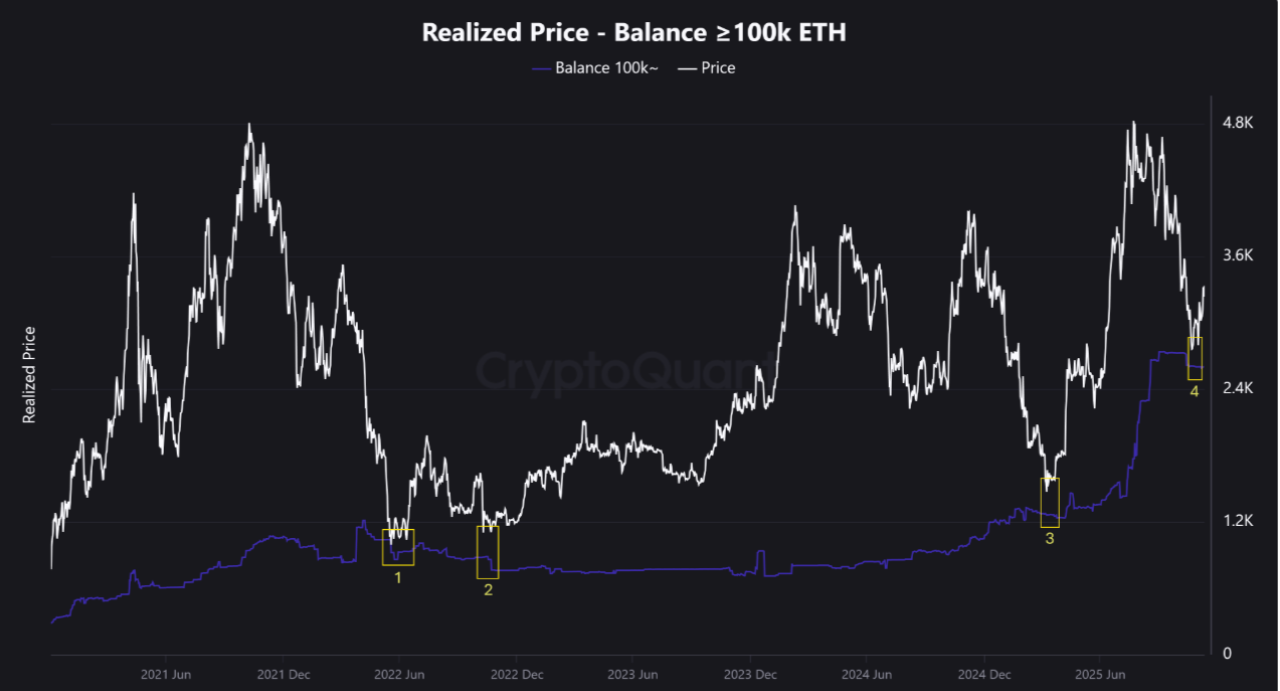
This deep correction brought the price close to the realized price of large holders ("whales" holding over 10,000 ETH), as shown in the chart below.
This realized price represents the average purchase cost of all current investors holding over 10,000 ETH.
CryptoQuant analyst Onchain pointed out in his latest quick analysis report: "Over the past five years, ETH's trading price has only approached the realized price level of whales holding at least 10,000 ETH on four occasions." He further added:
"Two of these occurred during the 2022 bear market, while the other two happened this year."
In April this year, the ETH price rebounded strongly from this key level, subsequently staging a staggering 260% surge, ultimately setting a new all-time high of $5000.
Analyst Quentin Francois stated in a recent post on platform X: "$ETH is currently trading at the realized price area of large holders." He emphasized:
"Historically, this typically represents an excellent buying opportunity."
The ETH price rebounded from this key trendline on November 22nd, surging 23.5% to $3238 by Friday.
If historical patterns repeat, ETH is expected to climb back to the $5000 high, a rise primarily driven by factors such as increased demand from treasury companies and renewed inflows into spot ETFs.
ETH Technical Chart Shows Potential to Reach $5000
ETH technical analysis reveals a V-shaped recovery pattern forming on the weekly chart, as shown below.
ETH is currently retesting the 50-week Simple Moving Average (SMA) located at $3300. Analysts point out that bulls need to push the price above this level to increase the likelihood of a rise to the $4955 neckline and complete the V-shaped pattern.
Achieving this trend would imply a gain of approximately 53% from the current price.
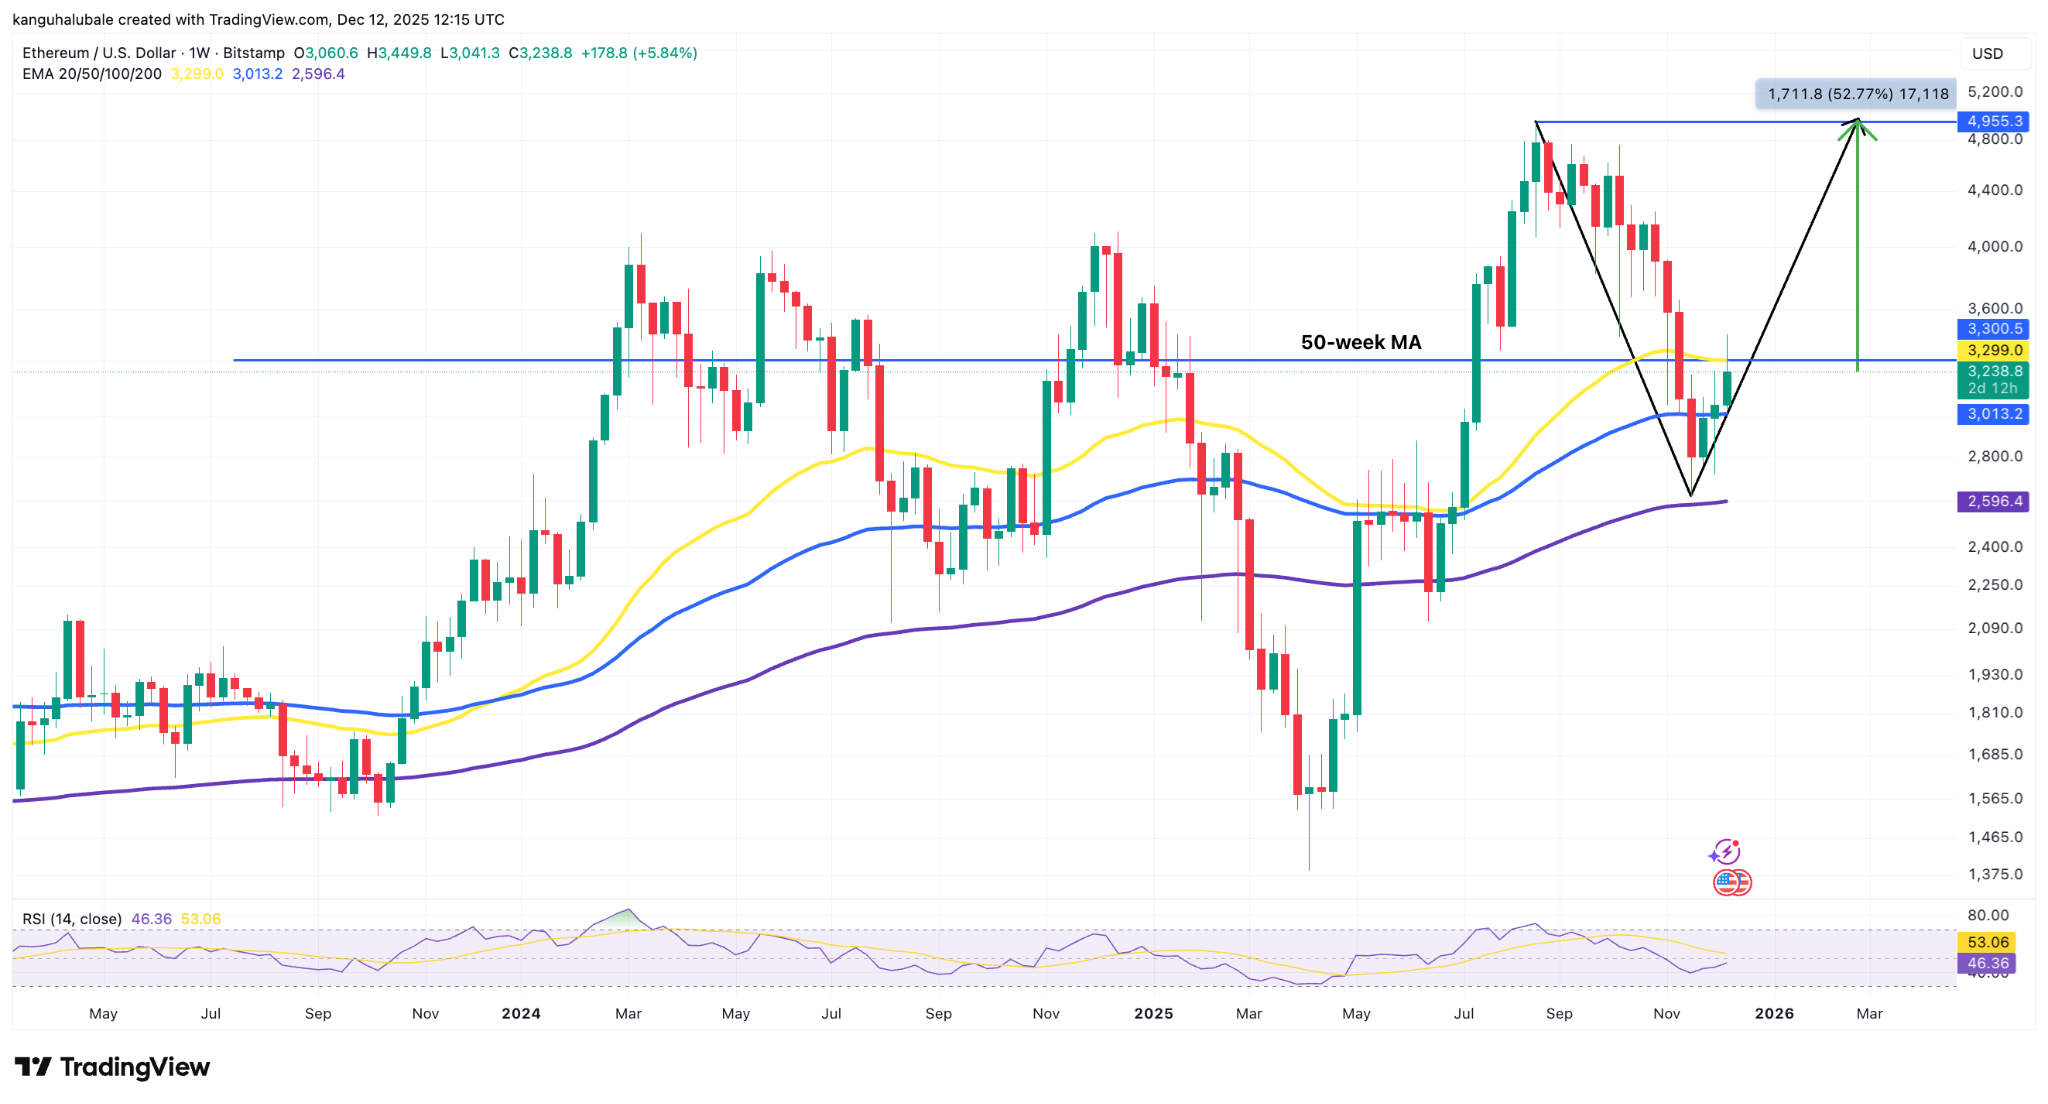
Several market experts indicate that ETH has the potential to climb to $5000 by 2026. Satoshi Flipper believes the falling wedge pattern预示着 this major altcoin is poised for a significant breakout.
"$4800 for $ETH is closer than most people expect."
As previously reported by Cointelegraph, the inverse head and shoulders (IH&S) pattern of Ethereum against Bitcoin (BTC) suggests a potential 80% surge in 2026, which would push the ETH price above $5800.
Related recommendation: Ethereum (ETH) Could See Triple-Digit Gains, ETF Inflows Act as Catalyst
This article does not contain investment advice or recommendations. Every investment and trading move involves risk, and readers should conduct their own research when making a decision. While we strive to provide accurate and timely information, Cointelegraph does not guarantee the accuracy, completeness, or reliability of any information in this article. This article may contain forward-looking statements that are subject to risks and uncertainties. Cointelegraph shall not be liable for any losses or damages arising from your reliance on this information.